***Last / Change / Volume data in this table is the closing quote data***
Symbol/Exchange
Company Name
Industry Group |
PRICE |
CHANGE
(%Change) |
Day High |
Volume
(% DAV)
(% 50 day avg vol) |
52 Wk Hi
% From Hi |
Featured
Date |
Price
Featured |
Pivot Featured |
|
Max Buy |
OSBC
-
NASDAQ
Old Second Bancorp Inc
BANKING - Regional - Midwest Banks
|
$15.05
|
+0.10
0.67% |
$15.20
|
41,554
47.01% of 50 DAV
50 DAV is 88,400
|
$15.60
-3.53%
|
5/21/2018
|
$15.50
|
PP = $15.10
|
|
MB = $15.86
|
 Most Recent Note - 7/23/2018 4:02:04 PM
Y - Rebounding above its 50 DMA line ($14.97). Its prior low ($14) and 200 DMA line define the next important support level. Its Relative Strength Rating has slumped to 74, below the 80+ minimum guideline for buy candidates. Due to report earnings news on 7/25/18. Volume and volatility often increase near earnings news.
>>> FEATURED STOCK ARTICLE : Consolidating Above 50-Day Moving Average - 7/9/2018 |
View all notes |
Set NEW NOTE alert |
Company Profile |
SEC
News |
Chart |
Request a new note
C
A
S
I |
PFBC
-
NASDAQ
Preferred Bank Los Angls
BANKING - Regional - Pacific Banks
|
$66.30
|
+0.71
1.08% |
$66.35
|
120,189
62.18% of 50 DAV
50 DAV is 193,300
|
$69.48
-4.58%
|
5/18/2018
|
$62.91
|
PP = $67.75
|
|
MB = $71.14
|
Most Recent Note - 7/23/2018 4:09:28 PM
Y - Consolidating above its 50 DMA line ($65.12). Stalled after recently spiking to a new all-time high. Recent low ($63.35 on 7/18/18) defines near-term support where more damaging losses would raise serious concerns. Relative Strength Rating is now 60, remaining below the 80+ minimum guideline for buy candidates, however it is only -4.6% off its all-time high.
>>> FEATURED STOCK ARTICLE : Volume-Driven Gains Hit New All-Time High - 7/3/2018 |
View all notes |
Set NEW NOTE alert |
Company Profile |
SEC
News |
Chart |
Request a new note
C
A
S
I |
SIVB
-
NASDAQ
S V B Financial Group
BANKING - Regional - Pacific Banks
|
$315.48
|
+6.76
2.19% |
$316.27
|
345,731
74.03% of 50 DAV
50 DAV is 467,000
|
$329.65
-4.30%
|
3/12/2018
|
$267.79
|
PP = $263.19
|
|
MB = $276.35
|
Most Recent Note - 7/23/2018 4:37:14 PM
G - Rebounded above the 50 DMA line ($311.38) with today's gain helping its outlook improve. Faces resistance due to overhead supply up to the $329 level. The recent low ($284.42 on 7/02/18) defines the next important near-term support to watch on pullbacks.
>>> FEATURED STOCK ARTICLE : Still Sputtering Below 50-Day Moving Average - 7/10/2018 |
View all notes |
Set NEW NOTE alert |
Company Profile |
SEC
News |
Chart |
Request a new note
C
A
S
I |
UCFC
-
NASDAQ
United Community Finl Cp
BANKING - Savings and Loans
|
$11.13
|
-0.07
-0.63% |
$11.24
|
180,834
87.44% of 50 DAV
50 DAV is 206,800
|
$11.98
-7.10%
|
5/30/2018
|
$10.50
|
PP = $10.80
|
|
MB = $11.34
|
Most Recent Note - 7/18/2018 12:06:54 PM
Y - Hit a new high today. Reported earnings +19% on +6% sales revenues for the Jun '18 quarter, below the +25% minimum earnings guideline (C criteria). Found support recently above the prior high ($10.70 on 4/19/18) and above its 50 DMA line ($10.87) defining near-term support to watch.
>>> FEATURED STOCK ARTICLE : Consolidating Above 50-Day Average and Prior Highs - 7/17/2018 |
View all notes |
Set NEW NOTE alert |
Company Profile |
SEC
News |
Chart |
Request a new note
C
A
S
I |
EPAM
-
NYSE
Epam Systems Inc
COMPUTER SOFTWARE and SERVICES - Information Technology Service
|
$136.44
|
+2.69
2.01% |
$136.64
|
595,362
123.52% of 50 DAV
50 DAV is 482,000
|
$134.87
1.16%
|
7/5/2018
|
$123.70
|
PP = $131.85
|
|
MB = $138.44
|
Most Recent Note - 7/19/2018 3:47:30 PM
Y - Quietly hovering near its all-time high with no resistance remaining due to overhead supply. Gains above the pivot point must have at least +40% above average volume to trigger a proper new (or add-on) technical buy signal. Its 50 DMA line ($125.86) defines near-term support above the recent low ($118.34 on 6/25/18).
>>> FEATURED STOCK ARTICLE : Sputtering Below 50-Day Average After Negating Prior Breakout - 6/27/2018 |
View all notes |
Set NEW NOTE alert |
Company Profile |
SEC
News |
Chart |
Request a new note
C
A
S
I |
Symbol/Exchange
Company Name
Industry Group |
PRICE |
CHANGE
(%Change) |
Day High |
Volume
(% DAV)
(% 50 day avg vol) |
52 Wk Hi
% From Hi |
Featured
Date |
Price
Featured |
Pivot Featured |
|
Max Buy |
FLT
-
NYSE
Fleetcor Technologies
DIVERSIFIED SERVICES - Business/Management Services
|
$219.29
|
+0.20
0.09% |
$219.50
|
697,984
55.79% of 50 DAV
50 DAV is 1,251,000
|
$222.92
-1.63%
|
6/18/2018
|
$219.31
|
PP = $213.84
|
|
MB = $224.53
|
Most Recent Note - 7/19/2018 3:50:37 PM
Y - Still perched within close striking distance of its 52-week high. Found support above its 50 DMA line ($209.12) during the recent consolidation.
>>> FEATURED STOCK ARTICLE : Breakaway Gap With Heavy Volume - 6/18/2018 |
View all notes |
Set NEW NOTE alert |
Company Profile |
SEC
News |
Chart |
Request a new note
C
A
S
I |
MA
-
NYSE
Mastercard Inc Cl A
Finance-CrdtCard/PmtPr
|
$207.84
|
+1.13
0.55% |
$207.96
|
2,715,850
89.63% of 50 DAV
50 DAV is 3,030,000
|
$209.19
-0.65%
|
7/11/2018
|
$203.84
|
PP = $204.10
|
|
MB = $214.31
|
Most Recent Note - 7/18/2018 5:43:48 PM
Y - Posted a gain with near average volume today for a new all-time high close. Gains above the pivot point must be backed by at least +40% above average volume to trigger a proper technical buy signal. Its 50 DMA line ($197.24 and recent low ($193.16 on 6/27/18) define important near-term support to watch on pullbacks.
>>> FEATURED STOCK ARTICLE : Extended From Prior Base and Perched at All-Time High - 6/20/2018 |
View all notes |
Set NEW NOTE alert |
Company Profile |
SEC
News |
Chart |
Request a new note
C
A
S
I |
V
-
NYSE
Visa Inc Cl A
Finance-CrdtCard/PmtPr
|
$140.03
|
-0.96
-0.68% |
$140.97
|
7,645,676
107.10% of 50 DAV
50 DAV is 7,139,000
|
$141.47
-1.02%
|
4/26/2018
|
$126.68
|
PP = $126.98
|
|
MB = $133.33
|
Most Recent Note - 7/23/2018 4:34:44 PM
G - Due to report earnings news on 7/25/18 after the close. Volume and volatility often increase near earnings news. Extended from any sound base, stubbornly holding its ground perched at its all-time high. The 50 DMA line ($134) defines support above the prior low ($129.53 on 6/25/18).
>>> FEATURED STOCK ARTICLE : Encountered Distributional Pressure at All-Time High - 6/11/2018 |
View all notes |
Set NEW NOTE alert |
Company Profile |
SEC
News |
Chart |
Request a new note
C
A
S
I |
BRKS
-
NASDAQ
Brooks Automation
ELECTRONICS - Semiconductor Equipment and Mate
|
$31.56
|
-0.55
-1.71% |
$32.01
|
635,965
88.70% of 50 DAV
50 DAV is 717,000
|
$36.45
-13.42%
|
6/15/2018
|
$35.44
|
PP = $34.87
|
|
MB = $36.61
|
Most Recent Note - 7/18/2018 5:39:10 PM
Y - Consolidating above its 50 DMA line ($32.31) with recent gains backed by light volume. Stalled after featured in the 6/15/18 mid-day report.
>>> FEATURED STOCK ARTICLE : Volume Was Heavy Behind Big Breakout Gain - 6/15/2018 |
View all notes |
Set NEW NOTE alert |
Company Profile |
SEC
News |
Chart |
Request a new note
C
A
S
I |
ENV
-
NYSE
Envestnet Inc
FINANCIAL SERVICES - Diversified Investments
|
$61.40
|
+2.10
3.54% |
$61.70
|
542,106
147.31% of 50 DAV
50 DAV is 368,000
|
$60.28
1.87%
|
6/15/2018
|
$57.85
|
PP = $60.37
|
|
MB = $63.39
|
Most Recent Note - 7/19/2018 4:19:28 PM
Y - Quietly consolidating above its 50 DMA line ($56.50) and still perched within close striking distance of its pivot point. Subsequent volume-driven gains for new highs may trigger a technical buy signal. The recent low ($53.75 on 6/28/18) and 200 DMA line define important near-term support.
>>> FEATURED STOCK ARTICLE : Gain With Above Average Volume Challenged Prior High - 6/19/2018 |
View all notes |
Set NEW NOTE alert |
Company Profile |
SEC
News |
Chart |
Request a new note
C
A
S
I |
Symbol/Exchange
Company Name
Industry Group |
PRICE |
CHANGE
(%Change) |
Day High |
Volume
(% DAV)
(% 50 day avg vol) |
52 Wk Hi
% From Hi |
Featured
Date |
Price
Featured |
Pivot Featured |
|
Max Buy |
TPL
-
NYSE
Texas Pacific Land Trust
Real Estate Dvlpmt/Ops
|
$772.81
|
-2.13
-0.27% |
$788.00
|
10,420
61.29% of 50 DAV
50 DAV is 17,000
|
$816.28
-5.33%
|
7/5/2018
|
$714.90
|
PP = $739.99
|
|
MB = $776.99
|
Most Recent Note - 7/20/2018 7:11:48 PM
Y - Volume totals have been cooling while consolidating back below its "max buy" level following the recent breakout. Prior high in the $740 area defines near-term support above its 50 DMA line ($707.22). See the latest FSU analysis for more details and a new annotated graph.
>>> FEATURED STOCK ARTICLE : Volume Totals Cooling While Consolidating Above Prior High - 7/20/2018 |
View all notes |
Set NEW NOTE alert |
Company Profile |
SEC
News |
Chart |
Request a new note
C
A
S
I |
STMP
-
NASDAQ
Stamps.com Inc
Retail-Internet
|
$273.85
|
+4.10
1.52% |
$274.35
|
267,885
104.24% of 50 DAV
50 DAV is 257,000
|
$285.75
-4.16%
|
5/4/2018
|
$234.15
|
PP = $233.23
|
|
MB = $244.89
|
Most Recent Note - 7/19/2018 4:12:56 PM
G - Has not formed a sound base, yet it found support at its 50 DMA line ($260.29). Below that important short-term average prior highs in the $233 area define support to watch on pullbacks.
>>> FEATURED STOCK ARTICLE : Big Loss on Heavy Volume Tests 50-Day Moving Average - 6/21/2018 |
View all notes |
Set NEW NOTE alert |
Company Profile |
SEC
News |
Chart |
Request a new note
C
A
S
I |
CHDN
-
NASDAQ
Churchill Downs Inc
LEISURE - Gaming Activities
|
$303.30
|
-1.70
-0.56% |
$305.35
|
32,398
35.22% of 50 DAV
50 DAV is 92,000
|
$314.60
-3.59%
|
6/20/2018
|
$285.80
|
PP = $314.70
|
|
MB = $330.44
|
Most Recent Note - 7/23/2018 3:53:06 PM
Y - Volume totals have been cooling while consolidating above its 50 DMA line ($301.16). Below that short-term average, the prior low ($285.50 on 6/28/18) defines the next important support. Violations would raise concerns and trigger technical sell signals. A new pivot point was cited based on its 5/16/18 high plus 10 cents. Subsequent volume-driven gains for a new high are needed to trigger a new (or add-on) technical buy signal.
>>> FEATURED STOCK ARTICLE : Consolidating Near 50-Day Moving Average - 6/29/2018 |
View all notes |
Set NEW NOTE alert |
Company Profile |
SEC
News |
Chart |
Request a new note
C
A
S
I |
HTHT
-
NASDAQ
Huazhu Group Ads
LEISURE - Lodging
|
$40.62
|
-0.40
-0.98% |
$42.00
|
873,547
37.39% of 50 DAV
50 DAV is 2,336,000
|
$49.60
-18.10%
|
5/15/2018
|
$34.52
|
PP = $41.57
|
|
MB = $43.65
|
Most Recent Note - 7/23/2018 3:58:57 PM
G - Still sputtering below its 50 DMA line ($43.82) yet finding support near prior highs in the $40-41 area. A rebound above the 50 DMA line is needed for its outlook to improve.
>>> FEATURED STOCK ARTICLE : At Prior High and Slumping Below 50-Day Average After 4:1 Split - 7/2/2018 |
View all notes |
Set NEW NOTE alert |
Company Profile |
SEC
News |
Chart |
Request a new note
C
A
S
I |
NFLX
-
NASDAQ
Netflix Inc
SPECIALTY RETAIL - Music and Video Stores
|
$362.66
|
+1.61
0.45% |
$363.90
|
11,450,582
101.04% of 50 DAV
50 DAV is 11,333,000
|
$423.21
-14.31%
|
5/24/2018
|
$348.85
|
PP = $338.92
|
|
MB = $355.87
|
Most Recent Note - 7/20/2018 11:34:12 AM
G - Sputtering below its 50 DMA line ($373) following damaging volume-driven losses. Reported very strong earnings and sales increases for the Jun '18 quarter, however, subscriber growth was below consensus estimates.
>>> FEATURED STOCK ARTICLE : Extended From Base and Pulling Back From All-Time High - 7/13/2018 |
View all notes |
Set NEW NOTE alert |
Company Profile |
SEC
News |
Chart |
Request a new note
C
A
S
I |
Symbol/Exchange
Company Name
Industry Group |
PRICE |
CHANGE
(%Change) |
Day High |
Volume
(% DAV)
(% 50 day avg vol) |
52 Wk Hi
% From Hi |
Featured
Date |
Price
Featured |
Pivot Featured |
|
Max Buy |
DPZ
-
NYSE
Dominos Pizza Inc
Retail-Restaurants
|
$271.75
|
-5.42
-1.96% |
$276.80
|
690,496
115.47% of 50 DAV
50 DAV is 598,000
|
$293.81
-7.51%
|
5/21/2018
|
$248.13
|
PP = $255.10
|
|
MB = $267.86
|
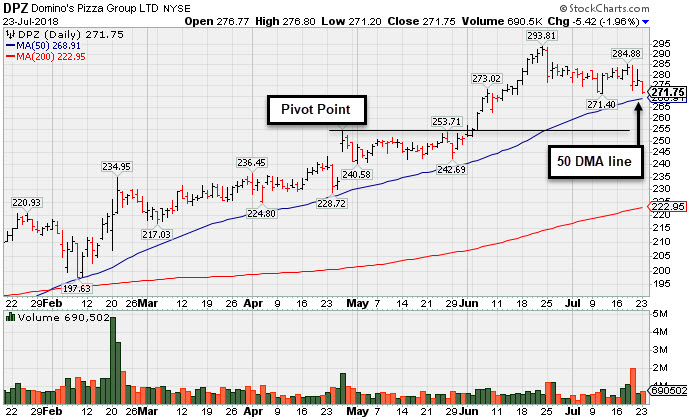
Most Recent Note - 7/23/2018 6:05:44 PM
G - Pulling back following the latest strong earnings report. Its 50 DMA line ($269.15) defines near-term support. It is extended from the prior base. Has a new CEO effective 7/02/18.
>>> FEATURED STOCK ARTICLE : Consolidating Near 50-Day Moving Average Line - 7/23/2018 |
View all notes |
Set NEW NOTE alert |
Company Profile |
SEC
News |
Chart |
Request a new note
C
A
S
I |
FIVE
-
NASDAQ
Five Below Inc
Retail-DiscountandVariety
|
$101.24
|
-1.70
-1.65% |
$103.97
|
949,675
68.03% of 50 DAV
50 DAV is 1,396,000
|
$109.09
-7.20%
|
7/6/2018
|
$98.90
|
PP = $104.09
|
|
MB = $109.29
|
Most Recent Note - 7/20/2018 11:29:47 AM
Y - Gapped down today retreating from its all-time high. Gains above the stock's pivot point this week lacked the minimum +40% above average volume necessary to trigger a proper technical buy signal.
>>> FEATURED STOCK ARTICLE : Hovering Near Record High After Big Gap Up and Volume-Driven Gain - 6/25/2018 |
View all notes |
Set NEW NOTE alert |
Company Profile |
SEC
News |
Chart |
Request a new note
C
A
S
I |
NOW
-
NYSE
Servicenow Inc
Computer Sftwr-Enterprse
|
$190.50
|
-0.58
-0.30% |
$191.35
|
1,626,354
103.13% of 50 DAV
50 DAV is 1,577,000
|
$194.81
-2.21%
|
5/8/2018
|
$174.63
|
PP = $176.66
|
|
MB = $185.49
|
Most Recent Note - 7/19/2018 3:54:29 PM
G - Hovering near its all-time high, extended from any sound base. The 50 DMA line ($180) and recent low ($167) define important near-term support.
>>> FEATURED STOCK ARTICLE : Recent Slump Below 50-Day Average Hurt Outlook - 6/26/2018 |
View all notes |
Set NEW NOTE alert |
Company Profile |
SEC
News |
Chart |
Request a new note
C
A
S
I |
NVEE
-
NASDAQ
N V 5 Global Inc
Comml Svcs-Consulting
|
$73.05
|
+1.55
2.17% |
$73.95
|
51,970
92.80% of 50 DAV
50 DAV is 56,000
|
$74.53
-1.99%
|
6/15/2018
|
$7,070.00
|
PP = $72.00
|
|
MB = $75.60
|
Most Recent Note - 7/19/2018 3:55:50 PM
Y - Volume totals have been cooling in recent weeks while hovering in a very tight range perched near its all-time high. Confirming gains above the pivot point backed by at least +40% above average volume may trigger a technical buy signal. Its 50 DMA line ($66.17) defines near-term support above the prior low ($56.65 on 5/15/18).
>>> FEATURED STOCK ARTICLE : Holding its Ground in Tight Range Near All-Time High - 6/28/2018 |
View all notes |
Set NEW NOTE alert |
Company Profile |
SEC
News |
Chart |
Request a new note
C
A
S
I |
PANW
-
NYSE
Palo Alto Networks
Computer Sftwr-Security
|
$211.64
|
-2.42
-1.13% |
$213.68
|
1,057,645
79.40% of 50 DAV
50 DAV is 1,332,000
|
$219.38
-3.53%
|
6/12/2018
|
$206.55
|
PP = $214.69
|
|
MB = $225.42
|
Most Recent Note - 7/23/2018 4:04:35 PM
Y - Hovering near its all-time high with volume totals cooling. Quietly consolidating above its 50 DMA line ($208). The prior low ($199.22 on 6/28/18) defines the next important support level.
>>> FEATURED STOCK ARTICLE : New High Close After 2 Consecutive Volume Driven Gains - 6/13/2018 |
View all notes |
Set NEW NOTE alert |
Company Profile |
SEC
News |
Chart |
Request a new note
C
A
S
I |
Symbol/Exchange
Company Name
Industry Group |
PRICE |
CHANGE
(%Change) |
Day High |
Volume
(% DAV)
(% 50 day avg vol) |
52 Wk Hi
% From Hi |
Featured
Date |
Price
Featured |
Pivot Featured |
|
Max Buy |
QLYS
-
NASDAQ
Qualys Inc
Computer Sftwr-Security
|
$97.05
|
+0.00
0.00% |
$97.35
|
224,061
68.52% of 50 DAV
50 DAV is 327,000
|
$97.75
-0.72%
|
7/23/2018
|
$97.05
|
PP = $97.85
|
|
MB = $102.74
|
Most Recent Note - 7/23/2018 4:30:32 PM
Y - Color code is changed to yellow while quietly perched near its 52-week high. A new pivot point is cited based on its 6/14/18 high plus 10 cents. Subsequent gains above the pivot point backed by at least +40% above average volume may trigger a new (or add-on) technical buy signal. Its 50 DMA line ($85.61) defines near-term support above the prior low ($82.51 on 6/28/18).
>>> FEATURED STOCK ARTICLE : Computer Software-Security Firm Hovering Near All-Time High - 7/16/2018 |
View all notes |
Set NEW NOTE alert |
Company Profile |
SEC
News |
Chart |
Request a new note
C
A
S
I |
SPLK
-
NASDAQ
Splunk Inc
Computer Sftwr-Database
|
$105.10
|
-0.41
-0.39% |
$106.09
|
1,748,135
91.91% of 50 DAV
50 DAV is 1,902,000
|
$121.64
-13.60%
|
5/8/2018
|
$113.14
|
PP = $112.76
|
|
MB = $118.40
|
Most Recent Note - 7/18/2018 5:37:47 PM
G - Still needs a rebound above the 50 DMA line (110.45) for its outlook to improve. Recent low ($95.10 on 6/28/18) defines near-term support above its 200 DMA line ($92.39). See the latest FSU analysis for more details and a new annotated graph.
>>> FEATURED STOCK ARTICLE : Splunk Still Sputtering Below 50-Day Moving Average - 7/18/2018 |
View all notes |
Set NEW NOTE alert |
Company Profile |
SEC
News |
Chart |
Request a new note
C
A
S
I |
SUPN
-
NASDAQ
Supernus Pharmaceuticals
Medical-Biomed/Biotech
|
$55.35
|
+0.48
0.87% |
$56.35
|
621,872
75.65% of 50 DAV
50 DAV is 822,000
|
$61.25
-9.63%
|
6/20/2018
|
$58.05
|
PP = $59.15
|
|
MB = $62.11
|
Most Recent Note - 7/23/2018 4:21:35 PM
G - Consolidating near its 50 DMA line ($55.42). Deterioration below the recent low ($49.75 on 7/09/18) would raise more serious concerns.
>>> FEATURED STOCK ARTICLE : Extended From Prior Base After Spiking Higher - 6/6/2018 |
View all notes |
Set NEW NOTE alert |
Company Profile |
SEC
News |
Chart |
Request a new note
C
A
S
I |
GRUB
-
NYSE
Grubhub Inc
INTERNET - Content
|
$110.27
|
-1.67
-1.49% |
$111.98
|
1,817,763
114.90% of 50 DAV
50 DAV is 1,582,000
|
$120.07
-8.16%
|
5/30/2018
|
$107.56
|
PP = $105.68
|
|
MB = $110.96
|
Most Recent Note - 7/23/2018 3:58:04 PM
Y - Due to report earnings on 7/25/18 prior to the open. Volume and volatility often increase near earnings news. Consolidating above its 50 DMA line ($107.83). Recent lows in the $101 area define the next important near-term support to watch.
>>> FEATURED STOCK ARTICLE : Gain With +25% Above Average Volume for Best Ever Close - 6/12/2018 |
View all notes |
Set NEW NOTE alert |
Company Profile |
SEC
News |
Chart |
Request a new note
C
A
S
I |
HQY
-
NASDAQ
Healthequity Inc
COMPUTER SOFTWARE and SERVICES - Healthcare Information Service
|
$82.47
|
+0.13
0.16% |
$83.34
|
307,175
59.19% of 50 DAV
50 DAV is 519,000
|
$82.73
-0.31%
|
5/2/2018
|
$66.31
|
PP = $68.85
|
|
MB = $72.29
|
Most Recent Note - 7/20/2018 7:09:51 PM
G - Posted a 4th consecutive gain today with light volume as it inched into new high territory. Found support while recently consolidating above its 50 DMA line ($77.60). Subsequent losses leading to a violation would raise greater concerns and trigger a technical sell signal.
>>> FEATURED STOCK ARTICLE : Pullback After Volume-Driven Gains For New Highs - 6/7/2018 |
View all notes |
Set NEW NOTE alert |
Company Profile |
SEC
News |
Chart |
Request a new note
C
A
S
I |
Symbol/Exchange
Company Name
Industry Group |
PRICE |
CHANGE
(%Change) |
Day High |
Volume
(% DAV)
(% 50 day avg vol) |
52 Wk Hi
% From Hi |
Featured
Date |
Price
Featured |
Pivot Featured |
|
Max Buy |
LOB
-
NASDAQ
Live Oak Bancshares Inc
Banks-Southeast
|
$32.45
|
+0.10
0.31% |
$32.95
|
118,275
84.48% of 50 DAV
50 DAV is 140,000
|
$32.80
-1.07%
|
5/21/2018
|
$29.35
|
PP = $30.15
|
|
MB = $31.66
|
Most Recent Note - 7/18/2018 5:42:23 PM
G - Still consolidating above its "max buy" level. Near term support to watch is at its 50 DMA line ($30.32).
>>> FEATURED STOCK ARTICLE : Bank Making Gradual Progress After Support Found at 50-Day Average - 7/11/2018 |
View all notes |
Set NEW NOTE alert |
Company Profile |
SEC
News |
Chart |
Request a new note
C
A
S
I |
PYPL
-
NASDAQ
Paypal Holdings Inc
Finance-CrdtCard/PmtPr
|
$89.24
|
+1.77
2.02% |
$89.60
|
11,722,043
164.96% of 50 DAV
50 DAV is 7,106,000
|
$89.19
0.06%
|
7/23/2018
|
$89.24
|
PP = $87.55
|
|
MB = $91.93
|
Most Recent Note - 7/23/2018 5:24:00 PM
Y - Posted a solid gain today backed by +65% above average volume, hitting a new all-time high, indicative of institutional buying demand. Due to report earnings news on 7/25/18. Volume and volatility often increase near earnings news. A valid secondary buy point exists up to 5% above the prior high ($87.55 on 6/21/18) since finding support at the 10 WMA line following a prior breakout. The 50 DMA line ($83.89) defines near-term support above the prior low ($80.16 on 6/28/18).
>>> FEATURED STOCK ARTICLE : Gains Have Lacked Volume While Approaching All-Time High - 6/8/2018 |
View all notes |
Set NEW NOTE alert |
Company Profile |
SEC
News |
Chart |
Request a new note
C
A
S
I |
OLLI
-
NASDAQ
Ollie's Bargain Outlet
Retail-DiscountandVariety
|
$74.40
|
+0.80
1.09% |
$74.85
|
505,036
56.68% of 50 DAV
50 DAV is 891,000
|
$77.50
-4.00%
|
7/12/2018
|
$74.43
|
PP = $77.60
|
|
MB = $81.48
|
Most Recent Note - 7/19/2018 3:57:13 PM
Y - Subsequent volume driven gains for new highs may trigger a new (or add-on) technical buy signal. Volume totals have been cooling while consolidating above its 50 DMA line ($72.34) which defines important near-term support to watch.
>>> FEATURED STOCK ARTICLE : Found Recent Support at 50-Day Moving Average Line - 7/5/2018 |
View all notes |
Set NEW NOTE alert |
Company Profile |
SEC
News |
Chart |
Request a new note
C
A
S
I |
MOMO
-
NASDAQ
Momo Inc Ads Cl A
INTERNET - Content
|
$45.99
|
+0.52
1.14% |
$46.40
|
2,546,190
49.76% of 50 DAV
50 DAV is 5,117,000
|
$54.24
-15.21%
|
6/1/2018
|
$48.62
|
PP = $46.79
|
|
MB = $49.13
|
Most Recent Note - 7/23/2018 4:40:05 PM
Y - Quietly consolidating near its 50 DMA line ($45.70) which acted as support after a slump below the old high ($46.69 on 8/08/17) into the prior base raised concerns. Subsequent losses below the recent low ($41.11 on 6/27/18) would raise serious concerns and trigger a worrisome technical sell signal.
>>> FEATURED STOCK ARTICLE : Chinese Internet Content Firm Below 50-Day Moving Average - 7/19/2018 |
View all notes |
Set NEW NOTE alert |
Company Profile |
SEC
News |
Chart |
Request a new note
C
A
S
I |
NOVT
-
NASDAQ
Novanta Inc
Elec-Scientific/Msrng
|
$68.85
|
+0.30
0.44% |
$69.10
|
174,425
92.78% of 50 DAV
50 DAV is 188,000
|
$69.70
-1.22%
|
7/12/2018
|
$65.90
|
PP = $68.10
|
|
MB = $71.51
|
Most Recent Note - 7/20/2018 11:34:53 AM
Y - Hitting a new 52-week high today. Volume-driven gains above the pivot point may trigger a new (or add-on) technical buy signal. The 50 DMA line ($64.42 and recent low ($59.25) define important near-term support.
>>> FEATURED STOCK ARTICLE : Gain Challenged 52-Week High and New Pivot Point - 7/12/2018 |
View all notes |
Set NEW NOTE alert |
Company Profile |
SEC
News |
Chart |
Request a new note
C
A
S
I |
Symbol/Exchange
Company Name
Industry Group |
PRICE |
CHANGE
(%Change) |
Day High |
Volume
(% DAV)
(% 50 day avg vol) |
52 Wk Hi
% From Hi |
Featured
Date |
Price
Featured |
Pivot Featured |
|
Max Buy |
BZUN
-
NASDAQ
Baozun Inc Cl A Ads
Computer Sftwr-Enterprse
|
$63.59
|
+1.65
2.66% |
$64.30
|
1,171,687
46.76% of 50 DAV
50 DAV is 2,506,000
|
$67.41
-5.67%
|
5/15/2018
|
$45.38
|
PP = $52.43
|
|
MB = $55.05
|
Most Recent Note - 7/19/2018 3:44:18 PM
G - It has not formed a sound base. Its 50 DMA line ($58) defines near-term support above the recent low ($51.50 on 6/27/18).
>>> FEATURED STOCK ARTICLE : Found Support Near Prior Highs and 50 Day Moving Average - 7/6/2018 |
View all notes |
Set NEW NOTE alert |
Company Profile |
SEC
News |
Chart |
Request a new note
C
A
S
I |