***Last / Change / Volume data in this table is the closing quote data***
Symbol/Exchange
Company Name
Industry Group |
PRICE |
CHANGE
(%Change) |
Day High |
Volume
(% DAV)
(% 50 day avg vol) |
52 Wk Hi
% From Hi |
Featured
Date |
Price
Featured |
Pivot Featured |
|
Max Buy |
OSBC
-
NASDAQ
Old Second Bancorp Inc
BANKING - Regional - Midwest Banks
|
$14.75
|
+0.00
0.00% |
$14.85
|
41,223
48.67% of 50 DAV
50 DAV is 84,700
|
$15.60
-5.45%
|
5/21/2018
|
$15.50
|
PP = $15.10
|
|
MB = $15.86
|
Most Recent Note - 7/16/2018 6:11:21 PM
Y - Rebounded near its 50 DMA line ($14.91). Its prior low ($14) and 200 DMA line define the next important support level. Its Relative Strength Rating has slumped to 72, below the 80+ minimum guideline for buy candidates.
>>> FEATURED STOCK ARTICLE : Consolidating Above 50-Day Moving Average - 7/9/2018 |
View all notes |
Set NEW NOTE alert |
Company Profile |
SEC
News |
Chart |
Request a new note
C
A
S
I |
PFBC
-
NASDAQ
Preferred Bank Los Angls
BANKING - Regional - Pacific Banks
|
$65.62
|
+1.27
1.97% |
$66.92
|
191,757
101.62% of 50 DAV
50 DAV is 188,700
|
$69.48
-5.56%
|
5/18/2018
|
$62.91
|
PP = $67.75
|
|
MB = $71.14
|
Most Recent Note - 7/16/2018 12:12:03 PM
Y - Stalled after spiking to a new all-time high, and with today's 5th loss it is sputtering below its 50 DMA line ($64.95). Recent low ($61.14) defines near-term support where more damaging losses would raise serious concerns. Relative Strength Rating is now 65, remaining below the 80+ minimum guideline for buy candidates, however it is only -7% off its all-time high.
>>> FEATURED STOCK ARTICLE : Volume-Driven Gains Hit New All-Time High - 7/3/2018 |
View all notes |
Set NEW NOTE alert |
Company Profile |
SEC
News |
Chart |
Request a new note
C
A
S
I |
SIVB
-
NASDAQ
S V B Financial Group
BANKING - Regional - Pacific Banks
|
$307.02
|
-1.72
-0.56% |
$308.29
|
304,930
64.33% of 50 DAV
50 DAV is 474,000
|
$329.65
-6.86%
|
3/12/2018
|
$267.79
|
PP = $263.19
|
|
MB = $276.35
|
Most Recent Note - 7/17/2018 5:27:38 PM
G - A rebound above the 50 DMA line ($311.73) still is needed for its outlook to improve. The recent low ($284.42 on 7/02/18) defines the next important near-term support to watch on pullbacks.
>>> FEATURED STOCK ARTICLE : Still Sputtering Below 50-Day Moving Average - 7/10/2018 |
View all notes |
Set NEW NOTE alert |
Company Profile |
SEC
News |
Chart |
Request a new note
C
A
S
I |
UCFC
-
NASDAQ
United Community Finl Cp
BANKING - Savings and Loans
|
$11.28
|
-0.08
-0.70% |
$11.36
|
181,306
89.76% of 50 DAV
50 DAV is 202,000
|
$11.98
-5.84%
|
5/30/2018
|
$10.50
|
PP = $10.80
|
|
MB = $11.34
|
Most Recent Note - 7/18/2018 12:06:54 PM
Y - Hit a new high today. Reported earnings +19% on +6% sales revenues for the Jun '18 quarter, below the +25% minimum earnings guideline (C criteria). Found support recently above the prior high ($10.70 on 4/19/18) and above its 50 DMA line ($10.87) defining near-term support to watch.
>>> FEATURED STOCK ARTICLE : Consolidating Above 50-Day Average and Prior Highs - 7/17/2018 |
View all notes |
Set NEW NOTE alert |
Company Profile |
SEC
News |
Chart |
Request a new note
C
A
S
I |
EPAM
-
NYSE
Epam Systems Inc
COMPUTER SOFTWARE and SERVICES - Information Technology Service
|
$134.48
|
+1.21
0.91% |
$134.87
|
282,469
57.76% of 50 DAV
50 DAV is 489,000
|
$134.78
-0.22%
|
7/5/2018
|
$123.70
|
PP = $131.85
|
|
MB = $138.44
|
 Most Recent Note - 7/19/2018 3:47:30 PM
Y - Quietly hovering near its all-time high with no resistance remaining due to overhead supply. Gains above the pivot point must have at least +40% above average volume to trigger a proper new (or add-on) technical buy signal. Its 50 DMA line ($125.86) defines near-term support above the recent low ($118.34 on 6/25/18).
>>> FEATURED STOCK ARTICLE : Sputtering Below 50-Day Average After Negating Prior Breakout - 6/27/2018 |
View all notes |
Set NEW NOTE alert |
Company Profile |
SEC
News |
Chart |
Request a new note
C
A
S
I |
Symbol/Exchange
Company Name
Industry Group |
PRICE |
CHANGE
(%Change) |
Day High |
Volume
(% DAV)
(% 50 day avg vol) |
52 Wk Hi
% From Hi |
Featured
Date |
Price
Featured |
Pivot Featured |
|
Max Buy |
FLT
-
NYSE
Fleetcor Technologies
DIVERSIFIED SERVICES - Business/Management Services
|
$218.00
|
+0.11
0.05% |
$219.16
|
423,210
33.80% of 50 DAV
50 DAV is 1,252,000
|
$222.92
-2.21%
|
6/18/2018
|
$219.31
|
PP = $213.84
|
|
MB = $224.53
|
Most Recent Note - 7/19/2018 3:50:37 PM
Y - Still perched within close striking distance of its 52-week high. Found support above its 50 DMA line ($209.12) during the recent consolidation.
>>> FEATURED STOCK ARTICLE : Breakaway Gap With Heavy Volume - 6/18/2018 |
View all notes |
Set NEW NOTE alert |
Company Profile |
SEC
News |
Chart |
Request a new note
C
A
S
I |
MA
-
NYSE
Mastercard Inc Cl A
Finance-CrdtCard/PmtPr
|
$206.06
|
-2.30
-1.10% |
$208.71
|
2,228,646
72.93% of 50 DAV
50 DAV is 3,056,000
|
$209.19
-1.50%
|
7/11/2018
|
$203.84
|
PP = $204.10
|
|
MB = $214.31
|
Most Recent Note - 7/18/2018 5:43:48 PM
Y - Posted a gain with near average volume today for a new all-time high close. Gains above the pivot point must be backed by at least +40% above average volume to trigger a proper technical buy signal. Its 50 DMA line ($197.24 and recent low ($193.16 on 6/27/18) define important near-term support to watch on pullbacks.
>>> FEATURED STOCK ARTICLE : Extended From Prior Base and Perched at All-Time High - 6/20/2018 |
View all notes |
Set NEW NOTE alert |
Company Profile |
SEC
News |
Chart |
Request a new note
C
A
S
I |
V
-
NYSE
Visa Inc Cl A
Finance-CrdtCard/PmtPr
|
$140.13
|
-0.77
-0.55% |
$140.99
|
7,915,247
112.11% of 50 DAV
50 DAV is 7,060,000
|
$141.17
-0.74%
|
4/26/2018
|
$126.68
|
PP = $126.98
|
|
MB = $133.33
|
Most Recent Note - 7/16/2018 6:16:15 PM
G - Quietly holding its ground perched at its all-time high following a spurt of volume-driven gains. Found support above its 50 DMA line ($133) and above prior highs in the $126 area.
>>> FEATURED STOCK ARTICLE : Encountered Distributional Pressure at All-Time High - 6/11/2018 |
View all notes |
Set NEW NOTE alert |
Company Profile |
SEC
News |
Chart |
Request a new note
C
A
S
I |
BRKS
-
NASDAQ
Brooks Automation
ELECTRONICS - Semiconductor Equipment and Mate
|
$32.43
|
-0.33
-1.01% |
$32.71
|
563,051
78.42% of 50 DAV
50 DAV is 718,000
|
$36.45
-11.03%
|
6/15/2018
|
$35.44
|
PP = $34.87
|
|
MB = $36.61
|
Most Recent Note - 7/18/2018 5:39:10 PM
Y - Consolidating above its 50 DMA line ($32.31) with recent gains backed by light volume. Stalled after featured in the 6/15/18 mid-day report.
>>> FEATURED STOCK ARTICLE : Volume Was Heavy Behind Big Breakout Gain - 6/15/2018 |
View all notes |
Set NEW NOTE alert |
Company Profile |
SEC
News |
Chart |
Request a new note
C
A
S
I |
ENV
-
NYSE
Envestnet Inc
FINANCIAL SERVICES - Diversified Investments
|
$59.10
|
+0.65
1.11% |
$59.45
|
202,662
54.92% of 50 DAV
50 DAV is 369,000
|
$60.28
-1.95%
|
6/15/2018
|
$57.85
|
PP = $60.37
|
|
MB = $63.39
|
Most Recent Note - 7/19/2018 4:19:28 PM
Y - Quietly consolidating above its 50 DMA line ($56.50) and still perched within close striking distance of its pivot point. Subsequent volume-driven gains for new highs may trigger a technical buy signal. The recent low ($53.75 on 6/28/18) and 200 DMA line define important near-term support.
>>> FEATURED STOCK ARTICLE : Gain With Above Average Volume Challenged Prior High - 6/19/2018 |
View all notes |
Set NEW NOTE alert |
Company Profile |
SEC
News |
Chart |
Request a new note
C
A
S
I |
Symbol/Exchange
Company Name
Industry Group |
PRICE |
CHANGE
(%Change) |
Day High |
Volume
(% DAV)
(% 50 day avg vol) |
52 Wk Hi
% From Hi |
Featured
Date |
Price
Featured |
Pivot Featured |
|
Max Buy |
TPL
-
NYSE
Texas Pacific Land Trust
Real Estate Dvlpmt/Ops
|
$765.50
|
-5.90
-0.76% |
$774.70
|
6,695
37.19% of 50 DAV
50 DAV is 18,000
|
$816.28
-6.22%
|
7/5/2018
|
$714.90
|
PP = $739.99
|
|
MB = $776.99
|
Most Recent Note - 7/19/2018 4:15:02 PM
Y - Volume totals have been cooling while consolidating back below its "max buy" level and the color code is changed to yellow. Its 50 DMA line ($704.80) and prior lows define important near-term support to watch on pullbacks.
>>> FEATURED STOCK ARTICLE : Negative Reversal on Higher Volume After Hitting New All-Time High - 6/4/2018 |
View all notes |
Set NEW NOTE alert |
Company Profile |
SEC
News |
Chart |
Request a new note
C
A
S
I |
STMP
-
NASDAQ
Stamps.com Inc
Retail-Internet
|
$274.60
|
-0.80
-0.29% |
$277.65
|
185,886
71.22% of 50 DAV
50 DAV is 261,000
|
$285.75
-3.90%
|
5/4/2018
|
$234.15
|
PP = $233.23
|
|
MB = $244.89
|
Most Recent Note - 7/19/2018 4:12:56 PM
G - Has not formed a sound base, yet it found support at its 50 DMA line ($260.29). Below that important short-term average prior highs in the $233 area define support to watch on pullbacks.
>>> FEATURED STOCK ARTICLE : Big Loss on Heavy Volume Tests 50-Day Moving Average - 6/21/2018 |
View all notes |
Set NEW NOTE alert |
Company Profile |
SEC
News |
Chart |
Request a new note
C
A
S
I |
CHDN
-
NASDAQ
Churchill Downs Inc
LEISURE - Gaming Activities
|
$308.00
|
+2.35
0.77% |
$308.60
|
40,062
43.08% of 50 DAV
50 DAV is 93,000
|
$314.60
-2.10%
|
6/20/2018
|
$285.80
|
PP = $314.70
|
|
MB = $330.44
|
Most Recent Note - 7/16/2018 6:12:19 PM
Y - Still quietly consolidating above support at its 50 DMA line ($298.50). The prior high ($285.70 on 4/26/18) defines the next important support. A new pivot point was cited based on its 5/16/18 high plus 10 cents. Subsequent volume-driven gains for a new high are needed to trigger a new (or add-on) technical buy signal.
>>> FEATURED STOCK ARTICLE : Consolidating Near 50-Day Moving Average - 6/29/2018 |
View all notes |
Set NEW NOTE alert |
Company Profile |
SEC
News |
Chart |
Request a new note
C
A
S
I |
HTHT
-
NASDAQ
Huazhu Group Ads
LEISURE - Lodging
|
$40.25
|
-0.23
-0.57% |
$40.86
|
1,459,227
63.31% of 50 DAV
50 DAV is 2,305,000
|
$49.60
-18.85%
|
5/15/2018
|
$34.52
|
PP = $41.57
|
|
MB = $43.65
|
Most Recent Note - 7/16/2018 6:09:28 PM
G - Still sputtering below its 50 DMA line ($43.41) yet finding support near prior highs in the $40-41 area. A rebound above the 50 DMA line is needed for its outlook to improve.
>>> FEATURED STOCK ARTICLE : At Prior High and Slumping Below 50-Day Average After 4:1 Split - 7/2/2018 |
View all notes |
Set NEW NOTE alert |
Company Profile |
SEC
News |
Chart |
Request a new note
C
A
S
I |
NFLX
-
NASDAQ
Netflix Inc
SPECIALTY RETAIL - Music and Video Stores
|
$364.23
|
-10.90
-2.91% |
$375.75
|
16,734,093
153.47% of 50 DAV
50 DAV is 10,904,000
|
$423.21
-13.94%
|
5/24/2018
|
$348.85
|
PP = $338.92
|
|
MB = $355.87
|
Most Recent Note - 7/19/2018 11:56:36 AM
G - Sputtering near its 50 DMA line ($372.64) following damaging volume-driven losses. Reported very strong earnings and sales increases for the Jun '18 quarter, however, subscriber growth was below consensus estimates.
>>> FEATURED STOCK ARTICLE : Extended From Base and Pulling Back From All-Time High - 7/13/2018 |
View all notes |
Set NEW NOTE alert |
Company Profile |
SEC
News |
Chart |
Request a new note
C
A
S
I |
Symbol/Exchange
Company Name
Industry Group |
PRICE |
CHANGE
(%Change) |
Day High |
Volume
(% DAV)
(% 50 day avg vol) |
52 Wk Hi
% From Hi |
Featured
Date |
Price
Featured |
Pivot Featured |
|
Max Buy |
DPZ
-
NYSE
Dominos Pizza Inc
Retail-Restaurants
|
$276.75
|
-6.93
-2.44% |
$284.77
|
1,968,288
345.31% of 50 DAV
50 DAV is 570,000
|
$293.81
-5.81%
|
5/21/2018
|
$248.13
|
PP = $255.10
|
|
MB = $267.86
|
Most Recent Note - 7/19/2018 11:45:59 AM
G - Pulling back today after reporting earnings +39% on +24% sales revenues for the Jun '18 quarter. Its 50 DMA line ($268.15) defines near-term support to watch above the prior high ($255 on 4/26/18). Has a new CEO effective 7/02/18.
>>> FEATURED STOCK ARTICLE : New High With Gain Backed by Above Average Volume - 6/5/2018 |
View all notes |
Set NEW NOTE alert |
Company Profile |
SEC
News |
Chart |
Request a new note
C
A
S
I |
FIVE
-
NASDAQ
Five Below Inc
Retail-DiscountandVariety
|
$107.93
|
+1.11
1.04% |
$109.09
|
1,354,860
100.51% of 50 DAV
50 DAV is 1,348,000
|
$107.45
0.45%
|
7/6/2018
|
$98.90
|
PP = $104.09
|
|
MB = $109.29
|
Most Recent Note - 7/19/2018 3:48:51 PM
Y - Hitting another new all-time high today. Gains above a stock's pivot point must have at least +40% above average volume to trigger a proper technical buy signal.
>>> FEATURED STOCK ARTICLE : Hovering Near Record High After Big Gap Up and Volume-Driven Gain - 6/25/2018 |
View all notes |
Set NEW NOTE alert |
Company Profile |
SEC
News |
Chart |
Request a new note
C
A
S
I |
NOW
-
NYSE
Servicenow Inc
Computer Sftwr-Enterprse
|
$190.04
|
-1.97
-1.03% |
$192.73
|
950,642
58.07% of 50 DAV
50 DAV is 1,637,000
|
$194.81
-2.45%
|
5/8/2018
|
$174.63
|
PP = $176.66
|
|
MB = $185.49
|
Most Recent Note - 7/19/2018 3:54:29 PM
G - Hovering near its all-time high, extended from any sound base. The 50 DMA line ($180) and recent low ($167) define important near-term support.
>>> FEATURED STOCK ARTICLE : Recent Slump Below 50-Day Average Hurt Outlook - 6/26/2018 |
View all notes |
Set NEW NOTE alert |
Company Profile |
SEC
News |
Chart |
Request a new note
C
A
S
I |
NVEE
-
NASDAQ
N V 5 Global Inc
Comml Svcs-Consulting
|
$72.25
|
-0.10
-0.14% |
$72.60
|
41,063
69.60% of 50 DAV
50 DAV is 59,000
|
$74.53
-3.06%
|
6/15/2018
|
$7,070.00
|
PP = $72.00
|
|
MB = $75.60
|
Most Recent Note - 7/19/2018 3:55:50 PM
Y - Volume totals have been cooling in recent weeks while hovering in a very tight range perched near its all-time high. Confirming gains above the pivot point backed by at least +40% above average volume may trigger a technical buy signal. Its 50 DMA line ($66.17) defines near-term support above the prior low ($56.65 on 5/15/18).
>>> FEATURED STOCK ARTICLE : Holding its Ground in Tight Range Near All-Time High - 6/28/2018 |
View all notes |
Set NEW NOTE alert |
Company Profile |
SEC
News |
Chart |
Request a new note
C
A
S
I |
PANW
-
NYSE
Palo Alto Networks
Computer Sftwr-Security
|
$214.58
|
-1.64
-0.76% |
$217.00
|
601,589
43.85% of 50 DAV
50 DAV is 1,372,000
|
$219.38
-2.19%
|
6/12/2018
|
$206.55
|
PP = $214.69
|
|
MB = $225.42
|
Most Recent Note - 7/17/2018 11:02:30 AM
Y - Hovering near its all-time high with volume totals cooling. Its 50 DMA line ($207) and prior low ($199.22 on 6/28/18) defines the next important support level.
>>> FEATURED STOCK ARTICLE : New High Close After 2 Consecutive Volume Driven Gains - 6/13/2018 |
View all notes |
Set NEW NOTE alert |
Company Profile |
SEC
News |
Chart |
Request a new note
C
A
S
I |
Symbol/Exchange
Company Name
Industry Group |
PRICE |
CHANGE
(%Change) |
Day High |
Volume
(% DAV)
(% 50 day avg vol) |
52 Wk Hi
% From Hi |
Featured
Date |
Price
Featured |
Pivot Featured |
|
Max Buy |
QLYS
-
NASDAQ
Qualys Inc
Computer Sftwr-Security
|
$96.35
|
+0.40
0.42% |
$97.05
|
201,837
61.72% of 50 DAV
50 DAV is 327,000
|
$97.75
-1.43%
|
4/17/2018
|
$82.85
|
PP = $79.50
|
|
MB = $83.48
|
Most Recent Note - 7/16/2018 6:18:12 PM
G - Perched near its 52-week high. Its 50 DMA line ($83.67) defines near-term support to watch on pullbacks. See the latest FSU analysis for more details and a new annotated graph.
>>> FEATURED STOCK ARTICLE : Computer Software-Security Firm Hovering Near All-Time High - 7/16/2018 |
View all notes |
Set NEW NOTE alert |
Company Profile |
SEC
News |
Chart |
Request a new note
C
A
S
I |
SPLK
-
NASDAQ
Splunk Inc
Computer Sftwr-Database
|
$106.25
|
-1.23
-1.14% |
$107.80
|
1,099,406
56.64% of 50 DAV
50 DAV is 1,941,000
|
$121.64
-12.65%
|
5/8/2018
|
$113.14
|
PP = $112.76
|
|
MB = $118.40
|
Most Recent Note - 7/18/2018 5:37:47 PM
G - Still needs a rebound above the 50 DMA line (110.45) for its outlook to improve. Recent low ($95.10 on 6/28/18) defines near-term support above its 200 DMA line ($92.39). See the latest FSU analysis for more details and a new annotated graph.
>>> FEATURED STOCK ARTICLE : Splunk Still Sputtering Below 50-Day Moving Average - 7/18/2018 |
View all notes |
Set NEW NOTE alert |
Company Profile |
SEC
News |
Chart |
Request a new note
C
A
S
I |
SUPN
-
NASDAQ
Supernus Pharmaceuticals
Medical-Biomed/Biotech
|
$54.25
|
-0.45
-0.82% |
$54.60
|
420,428
49.64% of 50 DAV
50 DAV is 847,000
|
$61.25
-11.43%
|
6/20/2018
|
$58.05
|
PP = $59.15
|
|
MB = $62.11
|
Most Recent Note - 7/16/2018 6:07:49 PM
G - Still sputtering below its 50 DMA line ($54.63), while a rebound above the 50 DMA line is needed for its outlook to improve. Deterioration below the recent low ($49.75 on 7/09/18) would raise more serious concerns.
>>> FEATURED STOCK ARTICLE : Extended From Prior Base After Spiking Higher - 6/6/2018 |
View all notes |
Set NEW NOTE alert |
Company Profile |
SEC
News |
Chart |
Request a new note
C
A
S
I |
GRUB
-
NYSE
Grubhub Inc
INTERNET - Content
|
$112.45
|
-1.42
-1.25% |
$114.81
|
1,072,753
67.94% of 50 DAV
50 DAV is 1,579,000
|
$120.07
-6.35%
|
5/30/2018
|
$107.56
|
PP = $105.68
|
|
MB = $110.96
|
Most Recent Note - 7/16/2018 6:14:43 PM
Y - Quietly consolidating above its 50 DMA line ($106.80). Recent lows in the $101 area define the next important near-term support to watch.
>>> FEATURED STOCK ARTICLE : Gain With +25% Above Average Volume for Best Ever Close - 6/12/2018 |
View all notes |
Set NEW NOTE alert |
Company Profile |
SEC
News |
Chart |
Request a new note
C
A
S
I |
HQY
-
NASDAQ
Healthequity Inc
COMPUTER SOFTWARE and SERVICES - Healthcare Information Service
|
$81.98
|
+0.47
0.58% |
$82.21
|
357,653
68.25% of 50 DAV
50 DAV is 524,000
|
$82.04
-0.07%
|
5/2/2018
|
$66.31
|
PP = $68.85
|
|
MB = $72.29
|
Most Recent Note - 7/13/2018 5:36:57 PM
G - It has not formed a sound base of sufficient length and has been consolidating above its 50 DMA line ($76.39) with volume totals cooling. Subsequent losses leading to a violation would raise greater concerns and trigger a technical sell signal.
>>> FEATURED STOCK ARTICLE : Pullback After Volume-Driven Gains For New Highs - 6/7/2018 |
View all notes |
Set NEW NOTE alert |
Company Profile |
SEC
News |
Chart |
Request a new note
C
A
S
I |
Symbol/Exchange
Company Name
Industry Group |
PRICE |
CHANGE
(%Change) |
Day High |
Volume
(% DAV)
(% 50 day avg vol) |
52 Wk Hi
% From Hi |
Featured
Date |
Price
Featured |
Pivot Featured |
|
Max Buy |
LOB
-
NASDAQ
Live Oak Bancshares Inc
Banks-Southeast
|
$31.95
|
+0.15
0.47% |
$32.00
|
159,237
116.23% of 50 DAV
50 DAV is 137,000
|
$32.60
-1.99%
|
5/21/2018
|
$29.35
|
PP = $30.15
|
|
MB = $31.66
|
Most Recent Note - 7/18/2018 5:42:23 PM
G - Still consolidating above its "max buy" level. Near term support to watch is at its 50 DMA line ($30.32).
>>> FEATURED STOCK ARTICLE : Bank Making Gradual Progress After Support Found at 50-Day Average - 7/11/2018 |
View all notes |
Set NEW NOTE alert |
Company Profile |
SEC
News |
Chart |
Request a new note
C
A
S
I |
PYPL
-
NASDAQ
Paypal Holdings Inc
Finance-CrdtCard/PmtPr
|
$87.38
|
-0.84
-0.95% |
$88.59
|
5,394,133
75.97% of 50 DAV
50 DAV is 7,100,000
|
$89.19
-2.03%
|
5/18/2018
|
$81.63
|
PP = $80.89
|
|
MB = $84.93
|
Most Recent Note - 7/19/2018 3:59:15 PM
Y - Volume totals have been cooling while stubbornly holding its ground perched near its all-time high. Found support at its 50 DMA line ($83.48) recently. Disciplined investors will note that since featured on 5/18/18 it has not posted confirming gains above the pivot point backed by at least +40% above average volume to confirm a proper technical buy signal.
>>> FEATURED STOCK ARTICLE : Gains Have Lacked Volume While Approaching All-Time High - 6/8/2018 |
View all notes |
Set NEW NOTE alert |
Company Profile |
SEC
News |
Chart |
Request a new note
C
A
S
I |
OLLI
-
NASDAQ
Ollie's Bargain Outlet
Retail-DiscountandVariety
|
$74.95
|
+0.30
0.40% |
$75.25
|
640,509
72.29% of 50 DAV
50 DAV is 886,000
|
$77.50
-3.29%
|
7/12/2018
|
$74.43
|
PP = $77.60
|
|
MB = $81.48
|
Most Recent Note - 7/19/2018 3:57:13 PM
Y - Subsequent volume driven gains for new highs may trigger a new (or add-on) technical buy signal. Volume totals have been cooling while consolidating above its 50 DMA line ($72.34) which defines important near-term support to watch.
>>> FEATURED STOCK ARTICLE : Found Recent Support at 50-Day Moving Average Line - 7/5/2018 |
View all notes |
Set NEW NOTE alert |
Company Profile |
SEC
News |
Chart |
Request a new note
C
A
S
I |
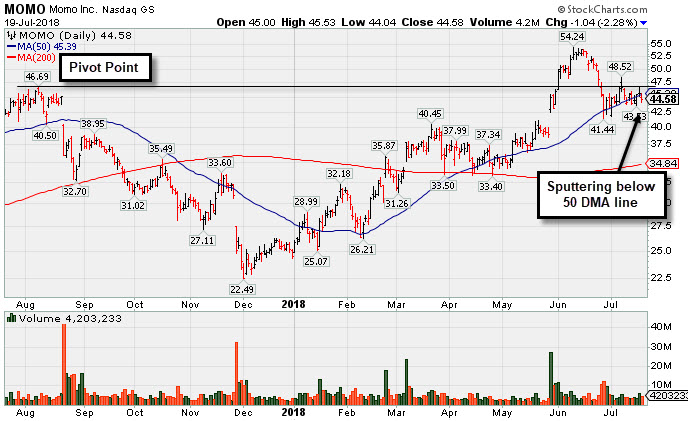
MOMO
-
NASDAQ
Momo Inc Ads Cl A
INTERNET - Content
|
$44.58
|
-1.04
-2.28% |
$45.53
|
4,198,407
82.76% of 50 DAV
50 DAV is 5,073,000
|
$54.24
-17.81%
|
6/1/2018
|
$48.62
|
PP = $46.79
|
|
MB = $49.13
|
Most Recent Note - 7/17/2018 10:59:47 AM
Y - Consolidating near its 50 DMA line ($45.10) which acted as support after a slump below the old high ($46.69 on 8/08/17) into the prior base raised concerns. Subsequent losses below the recent low ($41.11 on 6/27/18) would raise serious concerns and trigger a worrisome technical sell signal.
>>> FEATURED STOCK ARTICLE : Chinese Internet Content Firm Below 50-Day Moving Average - 7/19/2018 |
View all notes |
Set NEW NOTE alert |
Company Profile |
SEC
News |
Chart |
Request a new note
C
A
S
I |
NOVT
-
NASDAQ
Novanta Inc
Elec-Scientific/Msrng
|
$67.35
|
+0.35
0.52% |
$67.55
|
72,413
37.13% of 50 DAV
50 DAV is 195,000
|
$68.00
-0.96%
|
7/12/2018
|
$65.90
|
PP = $68.10
|
|
MB = $71.51
|
Most Recent Note - 7/19/2018 3:52:24 PM
Y - Still perched within close striking distance of its 52-week high. Subsequent volume-driven gains above the pivot point may trigger a new (or add-on) technical buy signal. The 50 DMA line ($64.28) and recent low ($59.25) define important near-term support.
>>> FEATURED STOCK ARTICLE : Gain Challenged 52-Week High and New Pivot Point - 7/12/2018 |
View all notes |
Set NEW NOTE alert |
Company Profile |
SEC
News |
Chart |
Request a new note
C
A
S
I |
Symbol/Exchange
Company Name
Industry Group |
PRICE |
CHANGE
(%Change) |
Day High |
Volume
(% DAV)
(% 50 day avg vol) |
52 Wk Hi
% From Hi |
Featured
Date |
Price
Featured |
Pivot Featured |
|
Max Buy |
BZUN
-
NASDAQ
Baozun Inc Cl A Ads
Computer Sftwr-Enterprse
|
$61.79
|
-0.39
-0.63% |
$62.62
|
1,140,021
45.20% of 50 DAV
50 DAV is 2,522,000
|
$67.41
-8.34%
|
5/15/2018
|
$45.38
|
PP = $52.43
|
|
MB = $55.05
|
Most Recent Note - 7/19/2018 3:44:18 PM
G - It has not formed a sound base. Its 50 DMA line ($58) defines near-term support above the recent low ($51.50 on 6/27/18).
>>> FEATURED STOCK ARTICLE : Found Support Near Prior Highs and 50 Day Moving Average - 7/6/2018 |
View all notes |
Set NEW NOTE alert |
Company Profile |
SEC
News |
Chart |
Request a new note
C
A
S
I |