***Last / Change / Volume data in this table is the closing quote data***
Symbol/Exchange
Company Name
Industry Group |
PRICE |
CHANGE
(%Change) |
Day High |
Volume
(% DAV)
(% 50 day avg vol) |
52 Wk Hi
% From Hi |
Featured
Date |
Price
Featured |
Pivot Featured |
|
Max Buy |
OSBC
-
NASDAQ
Old Second Bancorp Inc
BANKING - Regional - Midwest Banks
|
$14.75
|
-0.10
-0.67% |
$14.95
|
36,436
43.17% of 50 DAV
50 DAV is 84,400
|
$15.60
-5.45%
|
5/21/2018
|
$15.50
|
PP = $15.10
|
|
MB = $15.86
|
Most Recent Note - 7/16/2018 6:11:21 PM
Y - Rebounded near its 50 DMA line ($14.91). Its prior low ($14) and 200 DMA line define the next important support level. Its Relative Strength Rating has slumped to 72, below the 80+ minimum guideline for buy candidates.
>>> FEATURED STOCK ARTICLE : Consolidating Above 50-Day Moving Average - 7/9/2018 |
View all notes |
Set NEW NOTE alert |
Company Profile |
SEC
News |
Chart |
Request a new note
C
A
S
I |
PFBC
-
NASDAQ
Preferred Bank Los Angls
BANKING - Regional - Pacific Banks
|
$63.72
|
-1.30
-2.00% |
$65.22
|
228,546
125.64% of 50 DAV
50 DAV is 181,900
|
$69.48
-8.29%
|
5/18/2018
|
$62.91
|
PP = $67.75
|
|
MB = $71.14
|
Most Recent Note - 7/16/2018 12:12:03 PM
Y - Stalled after spiking to a new all-time high, and with today's 5th loss it is sputtering below its 50 DMA line ($64.95). Recent low ($61.14) defines near-term support where more damaging losses would raise serious concerns. Relative Strength Rating is now 65, remaining below the 80+ minimum guideline for buy candidates, however it is only -7% off its all-time high.
>>> FEATURED STOCK ARTICLE : Volume-Driven Gains Hit New All-Time High - 7/3/2018 |
View all notes |
Set NEW NOTE alert |
Company Profile |
SEC
News |
Chart |
Request a new note
C
A
S
I |
SIVB
-
NASDAQ
S V B Financial Group
BANKING - Regional - Pacific Banks
|
$308.19
|
+5.80
1.92% |
$310.10
|
477,569
101.39% of 50 DAV
50 DAV is 471,000
|
$329.65
-6.51%
|
3/12/2018
|
$267.79
|
PP = $263.19
|
|
MB = $276.35
|
 Most Recent Note - 7/17/2018 5:27:38 PM
G - A rebound above the 50 DMA line ($311.73) still is needed for its outlook to improve. The recent low ($284.42 on 7/02/18) defines the next important near-term support to watch on pullbacks.
>>> FEATURED STOCK ARTICLE : Still Sputtering Below 50-Day Moving Average - 7/10/2018 |
View all notes |
Set NEW NOTE alert |
Company Profile |
SEC
News |
Chart |
Request a new note
C
A
S
I |
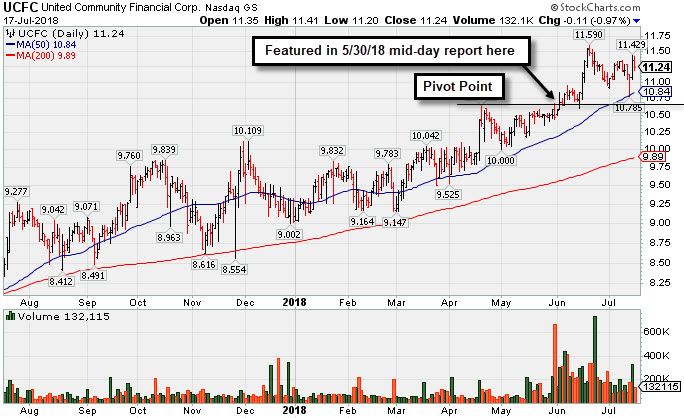
UCFC
-
NASDAQ
United Community Finl Cp
BANKING - Savings and Loans
|
$11.24
|
-0.11
-0.97% |
$11.41
|
131,178
66.93% of 50 DAV
50 DAV is 196,000
|
$11.59
-3.02%
|
5/30/2018
|
$10.50
|
PP = $10.80
|
|
MB = $11.34
|
Most Recent Note - 7/16/2018 12:14:26 PM
Y - Posting a solid gain today with higher volume. Recently consolidating above the prior high ($10.70 on 4/19/18) and above its 50 DMA line ($10.82) defining near-term support to watch.
>>> FEATURED STOCK ARTICLE : Consolidating Above 50-Day Average and Prior Highs - 7/17/2018 |
View all notes |
Set NEW NOTE alert |
Company Profile |
SEC
News |
Chart |
Request a new note
C
A
S
I |
EPAM
-
NYSE
Epam Systems Inc
COMPUTER SOFTWARE and SERVICES - Information Technology Service
|
$133.78
|
+1.52
1.15% |
$133.92
|
311,355
64.20% of 50 DAV
50 DAV is 485,000
|
$134.78
-0.74%
|
7/5/2018
|
$123.70
|
PP = $131.85
|
|
MB = $138.44
|
Most Recent Note - 7/12/2018 4:10:28 PM
Y - Hit a new high today with a big gain backed by above average volume. Gains above the pivot point must have at least +40% above average volume to trigger a proper new (or add-on) technical buy signal. Consolidating near its 50 DMA line ($124.13). Damaging losses below the recent low ($118.34 on 6/25/18) would raise serious concerns.
>>> FEATURED STOCK ARTICLE : Sputtering Below 50-Day Average After Negating Prior Breakout - 6/27/2018 |
View all notes |
Set NEW NOTE alert |
Company Profile |
SEC
News |
Chart |
Request a new note
C
A
S
I |
Symbol/Exchange
Company Name
Industry Group |
PRICE |
CHANGE
(%Change) |
Day High |
Volume
(% DAV)
(% 50 day avg vol) |
52 Wk Hi
% From Hi |
Featured
Date |
Price
Featured |
Pivot Featured |
|
Max Buy |
FLT
-
NYSE
Fleetcor Technologies
DIVERSIFIED SERVICES - Business/Management Services
|
$216.22
|
+0.04
0.02% |
$217.13
|
1,336,007
105.11% of 50 DAV
50 DAV is 1,271,000
|
$222.92
-3.01%
|
6/18/2018
|
$219.31
|
PP = $213.84
|
|
MB = $224.53
|
Most Recent Note - 7/12/2018 4:15:09 PM
Y - Perched within close striking distance of its 52-week high and volume totals have been cooling. Found support above its 50 DMA line ($207.89) during the recent consolidation.
>>> FEATURED STOCK ARTICLE : Breakaway Gap With Heavy Volume - 6/18/2018 |
View all notes |
Set NEW NOTE alert |
Company Profile |
SEC
News |
Chart |
Request a new note
C
A
S
I |
MA
-
NYSE
Mastercard Inc Cl A
Finance-CrdtCard/PmtPr
|
$206.37
|
+2.29
1.12% |
$206.70
|
2,843,092
92.34% of 50 DAV
50 DAV is 3,079,000
|
$209.19
-1.35%
|
7/11/2018
|
$203.84
|
PP = $204.10
|
|
MB = $214.31
|
Most Recent Note - 7/11/2018 6:55:54 PM
Y - Color code is changed to yellow with new pivot point cited based on the 6/07/18 high plus 10 cents. Subsequent gains above the pivot point backed by at least +40% above average volume may trigger a new (or add-on) technical buy signal. Finished at a new all-time high close with today's 5th consecutive gain backed by below average volume. Its 50 DMA line ($195) and recent low ($193.16 on 6/27/18) define important near-term support to watch on pullbacks.
>>> FEATURED STOCK ARTICLE : Extended From Prior Base and Perched at All-Time High - 6/20/2018 |
View all notes |
Set NEW NOTE alert |
Company Profile |
SEC
News |
Chart |
Request a new note
C
A
S
I |
V
-
NYSE
Visa Inc Cl A
Finance-CrdtCard/PmtPr
|
$139.64
|
+1.18
0.85% |
$139.91
|
5,399,605
76.67% of 50 DAV
50 DAV is 7,043,000
|
$140.03
-0.28%
|
4/26/2018
|
$126.68
|
PP = $126.98
|
|
MB = $133.33
|
Most Recent Note - 7/16/2018 6:16:15 PM
G - Quietly holding its ground perched at its all-time high following a spurt of volume-driven gains. Found support above its 50 DMA line ($133) and above prior highs in the $126 area.
>>> FEATURED STOCK ARTICLE : Encountered Distributional Pressure at All-Time High - 6/11/2018 |
View all notes |
Set NEW NOTE alert |
Company Profile |
SEC
News |
Chart |
Request a new note
C
A
S
I |
BRKS
-
NASDAQ
Brooks Automation
ELECTRONICS - Semiconductor Equipment and Mate
|
$32.42
|
+0.27
0.84% |
$32.59
|
572,183
80.14% of 50 DAV
50 DAV is 714,000
|
$36.45
-11.06%
|
6/15/2018
|
$35.44
|
PP = $34.87
|
|
MB = $36.61
|
Most Recent Note - 7/11/2018 12:36:54 PM
Y - Pulling back on higher volume today after wedging toward the prior high with gains backed by light volume. Stalled after featured in the 6/15/18 mid-day report, yet found support well above its 50 DMA line ($31.82) during the recent consolidation.
>>> FEATURED STOCK ARTICLE : Volume Was Heavy Behind Big Breakout Gain - 6/15/2018 |
View all notes |
Set NEW NOTE alert |
Company Profile |
SEC
News |
Chart |
Request a new note
C
A
S
I |
ENV
-
NYSE
Envestnet Inc
FINANCIAL SERVICES - Diversified Investments
|
$58.55
|
+0.05
0.09% |
$59.05
|
199,935
54.33% of 50 DAV
50 DAV is 368,000
|
$60.28
-2.86%
|
6/15/2018
|
$57.85
|
PP = $60.37
|
|
MB = $63.39
|
Most Recent Note - 7/13/2018 5:18:03 PM
Y - Still consolidating above its 50 DMA line ($56.39) and perched within close striking distance of its pivot point. Subsequent volume-driven gains for new highs may trigger a technical buy signal. The recent low ($53.75 on 6/28/18) and 200 DMA line define important near-term support.
>>> FEATURED STOCK ARTICLE : Gain With Above Average Volume Challenged Prior High - 6/19/2018 |
View all notes |
Set NEW NOTE alert |
Company Profile |
SEC
News |
Chart |
Request a new note
C
A
S
I |
Symbol/Exchange
Company Name
Industry Group |
PRICE |
CHANGE
(%Change) |
Day High |
Volume
(% DAV)
(% 50 day avg vol) |
52 Wk Hi
% From Hi |
Featured
Date |
Price
Featured |
Pivot Featured |
|
Max Buy |
TPL
-
NYSE
Texas Pacific Land Trust
Real Estate Dvlpmt/Ops
|
$779.86
|
-9.47
-1.20% |
$788.60
|
7,110
37.42% of 50 DAV
50 DAV is 19,000
|
$816.28
-4.46%
|
7/5/2018
|
$714.90
|
PP = $739.99
|
|
MB = $776.99
|
Most Recent Note - 7/12/2018 12:29:14 PM
G - Color code is changed to green after rallying above its "max buy" level for yet another new all-time high with today's 6th consecutive gain. Gains this week above the new pivot point based on its 6/04/18 high plus 10 cents triggered a technical buy signal. Its 50 DMA line ($690) and prior lows define important near-term support to watch on pullbacks.
>>> FEATURED STOCK ARTICLE : Negative Reversal on Higher Volume After Hitting New All-Time High - 6/4/2018 |
View all notes |
Set NEW NOTE alert |
Company Profile |
SEC
News |
Chart |
Request a new note
C
A
S
I |
STMP
-
NASDAQ
Stamps.com Inc
Retail-Internet
|
$274.70
|
+5.20
1.93% |
$275.85
|
105,483
37.01% of 50 DAV
50 DAV is 285,000
|
$285.75
-3.87%
|
5/4/2018
|
$234.15
|
PP = $233.23
|
|
MB = $244.89
|
Most Recent Note - 7/12/2018 4:19:46 PM
G - Has not formed a sound base, yet it found support at its 50 DMA line ($256.56). Below that important short-term average prior highs in the $233 area define support to watch on pullbacks.
>>> FEATURED STOCK ARTICLE : Big Loss on Heavy Volume Tests 50-Day Moving Average - 6/21/2018 |
View all notes |
Set NEW NOTE alert |
Company Profile |
SEC
News |
Chart |
Request a new note
C
A
S
I |
CHDN
-
NASDAQ
Churchill Downs Inc
LEISURE - Gaming Activities
|
$304.60
|
+0.95
0.31% |
$306.00
|
22,338
23.51% of 50 DAV
50 DAV is 95,000
|
$314.60
-3.18%
|
6/20/2018
|
$285.80
|
PP = $314.70
|
|
MB = $330.44
|
Most Recent Note - 7/16/2018 6:12:19 PM
Y - Still quietly consolidating above support at its 50 DMA line ($298.50). The prior high ($285.70 on 4/26/18) defines the next important support. A new pivot point was cited based on its 5/16/18 high plus 10 cents. Subsequent volume-driven gains for a new high are needed to trigger a new (or add-on) technical buy signal.
>>> FEATURED STOCK ARTICLE : Consolidating Near 50-Day Moving Average - 6/29/2018 |
View all notes |
Set NEW NOTE alert |
Company Profile |
SEC
News |
Chart |
Request a new note
C
A
S
I |
HTHT
-
NASDAQ
Huazhu Group Ads
LEISURE - Lodging
|
$40.51
|
+0.49
1.22% |
$42.00
|
1,109,604
47.81% of 50 DAV
50 DAV is 2,321,000
|
$49.60
-18.33%
|
5/15/2018
|
$34.52
|
PP = $41.57
|
|
MB = $43.65
|
Most Recent Note - 7/16/2018 6:09:28 PM
G - Still sputtering below its 50 DMA line ($43.41) yet finding support near prior highs in the $40-41 area. A rebound above the 50 DMA line is needed for its outlook to improve.
>>> FEATURED STOCK ARTICLE : At Prior High and Slumping Below 50-Day Average After 4:1 Split - 7/2/2018 |
View all notes |
Set NEW NOTE alert |
Company Profile |
SEC
News |
Chart |
Request a new note
C
A
S
I |
NFLX
-
NASDAQ
Netflix Inc
SPECIALTY RETAIL - Music and Video Stores
|
$379.48
|
-21.00
-5.24% |
$385.00
|
58,274,685
606.59% of 50 DAV
50 DAV is 9,607,000
|
$423.21
-10.33%
|
5/24/2018
|
$348.85
|
PP = $338.92
|
|
MB = $355.87
|
Most Recent Note - 7/17/2018 12:09:14 PM
G - Recovered from early lows near the prior high ($338.82 on 4/18/18) after violating its 50 DMA line ($370.59) with a damaging gap down triggering a technical sell signal. Reported very strong earnings and sales increases for the Jun '18 quarter, however, subscriber growth was below consensus estimates.
>>> FEATURED STOCK ARTICLE : Extended From Base and Pulling Back From All-Time High - 7/13/2018 |
View all notes |
Set NEW NOTE alert |
Company Profile |
SEC
News |
Chart |
Request a new note
C
A
S
I |
Symbol/Exchange
Company Name
Industry Group |
PRICE |
CHANGE
(%Change) |
Day High |
Volume
(% DAV)
(% 50 day avg vol) |
52 Wk Hi
% From Hi |
Featured
Date |
Price
Featured |
Pivot Featured |
|
Max Buy |
DPZ
-
NYSE
Dominos Pizza Inc
Retail-Restaurants
|
$282.04
|
+2.85
1.02% |
$282.90
|
844,543
153.83% of 50 DAV
50 DAV is 549,000
|
$293.81
-4.01%
|
5/21/2018
|
$248.13
|
PP = $255.10
|
|
MB = $267.86
|
Most Recent Note - 7/16/2018 6:13:47 PM
G - Has a new CEO effective 7/02/18. Consolidating above its 50 DMA line ($266.30) which defines near-term support to watch above the prior high ($255 on 4/26/18).
>>> FEATURED STOCK ARTICLE : New High With Gain Backed by Above Average Volume - 6/5/2018 |
View all notes |
Set NEW NOTE alert |
Company Profile |
SEC
News |
Chart |
Request a new note
C
A
S
I |
FIVE
-
NASDAQ
Five Below Inc
Retail-DiscountandVariety
|
$102.24
|
-1.19
-1.15% |
$103.90
|
806,469
60.05% of 50 DAV
50 DAV is 1,343,000
|
$103.99
-1.68%
|
7/6/2018
|
$98.90
|
PP = $104.09
|
|
MB = $109.29
|
Most Recent Note - 7/13/2018 5:19:46 PM
Y - Still stubbornly holding its ground near its all-time high. New pivot point was recently cited base on its 6/13/18 high plus 10 cents. Volume totals have still been cooling. Subsequent volume-driven gains for new highs may trigger a new (or add-on) technical buy signal. Reported earnings +133% on +27% sales revenues for the Apr '18 quarter.
>>> FEATURED STOCK ARTICLE : Hovering Near Record High After Big Gap Up and Volume-Driven Gain - 6/25/2018 |
View all notes |
Set NEW NOTE alert |
Company Profile |
SEC
News |
Chart |
Request a new note
C
A
S
I |
NOW
-
NYSE
Servicenow Inc
Computer Sftwr-Enterprse
|
$191.20
|
+2.12
1.12% |
$191.67
|
1,334,989
80.42% of 50 DAV
50 DAV is 1,660,000
|
$194.81
-1.85%
|
5/8/2018
|
$174.63
|
PP = $176.66
|
|
MB = $185.49
|
Most Recent Note - 7/12/2018 4:24:27 PM
G - Color code is changed to green after rallying above the "max buy" level and hitting new all-time highs with above average volume behind today's 6th consecutive gain. The recent low ($167) defines important near-term support.
>>> FEATURED STOCK ARTICLE : Recent Slump Below 50-Day Average Hurt Outlook - 6/26/2018 |
View all notes |
Set NEW NOTE alert |
Company Profile |
SEC
News |
Chart |
Request a new note
C
A
S
I |
NVEE
-
NASDAQ
N V 5 Global Inc
Comml Svcs-Consulting
|
$72.90
|
+0.80
1.11% |
$73.20
|
33,014
49.27% of 50 DAV
50 DAV is 67,000
|
$74.53
-2.19%
|
6/15/2018
|
$7,070.00
|
PP = $72.00
|
|
MB = $75.60
|
Most Recent Note - 7/12/2018 4:16:34 PM
Y - Quietly hovering in a tight range perched near its all-time high. Confirming gains above the pivot point backed by at least +40% above average volume may trigger a technical buy signal. Its 50 DMA line ($65.08) defines near-term support above the prior low ($56.65 on 5/15/18).
>>> FEATURED STOCK ARTICLE : Holding its Ground in Tight Range Near All-Time High - 6/28/2018 |
View all notes |
Set NEW NOTE alert |
Company Profile |
SEC
News |
Chart |
Request a new note
C
A
S
I |
PANW
-
NYSE
Palo Alto Networks
Computer Sftwr-Security
|
$216.58
|
+2.22
1.04% |
$217.10
|
724,276
52.79% of 50 DAV
50 DAV is 1,372,000
|
$219.38
-1.28%
|
6/12/2018
|
$206.55
|
PP = $214.69
|
|
MB = $225.42
|
Most Recent Note - 7/17/2018 11:02:30 AM
Y - Hovering near its all-time high with volume totals cooling. Its 50 DMA line ($207) and prior low ($199.22 on 6/28/18) defines the next important support level.
>>> FEATURED STOCK ARTICLE : New High Close After 2 Consecutive Volume Driven Gains - 6/13/2018 |
View all notes |
Set NEW NOTE alert |
Company Profile |
SEC
News |
Chart |
Request a new note
C
A
S
I |
Symbol/Exchange
Company Name
Industry Group |
PRICE |
CHANGE
(%Change) |
Day High |
Volume
(% DAV)
(% 50 day avg vol) |
52 Wk Hi
% From Hi |
Featured
Date |
Price
Featured |
Pivot Featured |
|
Max Buy |
QLYS
-
NASDAQ
Qualys Inc
Computer Sftwr-Security
|
$94.70
|
+1.95
2.10% |
$95.15
|
275,125
83.88% of 50 DAV
50 DAV is 328,000
|
$97.75
-3.12%
|
4/17/2018
|
$82.85
|
PP = $79.50
|
|
MB = $83.48
|
Most Recent Note - 7/16/2018 6:18:12 PM
G - Perched near its 52-week high. Its 50 DMA line ($83.67) defines near-term support to watch on pullbacks. See the latest FSU analysis for more details and a new annotated graph.
>>> FEATURED STOCK ARTICLE : Computer Software-Security Firm Hovering Near All-Time High - 7/16/2018 |
View all notes |
Set NEW NOTE alert |
Company Profile |
SEC
News |
Chart |
Request a new note
C
A
S
I |
SPLK
-
NASDAQ
Splunk Inc
Computer Sftwr-Database
|
$107.25
|
+1.05
0.99% |
$107.90
|
1,197,223
61.65% of 50 DAV
50 DAV is 1,942,000
|
$121.64
-11.83%
|
5/8/2018
|
$113.14
|
PP = $112.76
|
|
MB = $118.40
|
Most Recent Note - 7/12/2018 4:22:23 PM
G - Posted a solid gain today with higher volume. Recent low ($95.10 on 6/28/18) defines near-term support above its 200 DMA line ($92.39). A rebound above the 50 DMA line (110.43) still is needed for its outlook to improve.
>>> FEATURED STOCK ARTICLE : Consolidating Near High Following Latest Financial Report - 5/31/2018 |
View all notes |
Set NEW NOTE alert |
Company Profile |
SEC
News |
Chart |
Request a new note
C
A
S
I |
SUPN
-
NASDAQ
Supernus Pharmaceuticals
Medical-Biomed/Biotech
|
$53.55
|
+0.85
1.61% |
$53.75
|
469,173
54.75% of 50 DAV
50 DAV is 857,000
|
$61.25
-12.57%
|
6/20/2018
|
$58.05
|
PP = $59.15
|
|
MB = $62.11
|
Most Recent Note - 7/16/2018 6:07:49 PM
G - Still sputtering below its 50 DMA line ($54.63), while a rebound above the 50 DMA line is needed for its outlook to improve. Deterioration below the recent low ($49.75 on 7/09/18) would raise more serious concerns.
>>> FEATURED STOCK ARTICLE : Extended From Prior Base After Spiking Higher - 6/6/2018 |
View all notes |
Set NEW NOTE alert |
Company Profile |
SEC
News |
Chart |
Request a new note
C
A
S
I |
GRUB
-
NYSE
Grubhub Inc
INTERNET - Content
|
$113.91
|
+3.73
3.39% |
$114.85
|
1,192,781
75.78% of 50 DAV
50 DAV is 1,574,000
|
$120.07
-5.13%
|
5/30/2018
|
$107.56
|
PP = $105.68
|
|
MB = $110.96
|
Most Recent Note - 7/16/2018 6:14:43 PM
Y - Quietly consolidating above its 50 DMA line ($106.80). Recent lows in the $101 area define the next important near-term support to watch.
>>> FEATURED STOCK ARTICLE : Gain With +25% Above Average Volume for Best Ever Close - 6/12/2018 |
View all notes |
Set NEW NOTE alert |
Company Profile |
SEC
News |
Chart |
Request a new note
C
A
S
I |
HQY
-
NASDAQ
Healthequity Inc
COMPUTER SOFTWARE and SERVICES - Healthcare Information Service
|
$81.40
|
+1.22
1.52% |
$81.45
|
297,859
55.67% of 50 DAV
50 DAV is 535,000
|
$82.04
-0.78%
|
5/2/2018
|
$66.31
|
PP = $68.85
|
|
MB = $72.29
|
Most Recent Note - 7/13/2018 5:36:57 PM
G - It has not formed a sound base of sufficient length and has been consolidating above its 50 DMA line ($76.39) with volume totals cooling. Subsequent losses leading to a violation would raise greater concerns and trigger a technical sell signal.
>>> FEATURED STOCK ARTICLE : Pullback After Volume-Driven Gains For New Highs - 6/7/2018 |
View all notes |
Set NEW NOTE alert |
Company Profile |
SEC
News |
Chart |
Request a new note
C
A
S
I |
Symbol/Exchange
Company Name
Industry Group |
PRICE |
CHANGE
(%Change) |
Day High |
Volume
(% DAV)
(% 50 day avg vol) |
52 Wk Hi
% From Hi |
Featured
Date |
Price
Featured |
Pivot Featured |
|
Max Buy |
LOB
-
NASDAQ
Live Oak Bancshares Inc
Banks-Southeast
|
$31.60
|
-0.15
-0.47% |
$31.85
|
125,527
92.30% of 50 DAV
50 DAV is 136,000
|
$32.60
-3.07%
|
5/21/2018
|
$29.35
|
PP = $30.15
|
|
MB = $31.66
|
Most Recent Note - 7/11/2018 6:46:37 PM
G - Consolidating near its "max buy" level after a streak of 7 consecutive gains. Near term support to watch is at its 50 DMA line ($30). See the latest FSU analysis for more details and a new annotated graph.
>>> FEATURED STOCK ARTICLE : Bank Making Gradual Progress After Support Found at 50-Day Average - 7/11/2018 |
View all notes |
Set NEW NOTE alert |
Company Profile |
SEC
News |
Chart |
Request a new note
C
A
S
I |
PYPL
-
NASDAQ
Paypal Holdings Inc
Finance-CrdtCard/PmtPr
|
$88.58
|
+0.81
0.92% |
$88.72
|
5,032,082
69.86% of 50 DAV
50 DAV is 7,203,000
|
$89.19
-0.68%
|
5/18/2018
|
$81.63
|
PP = $80.89
|
|
MB = $84.93
|
Most Recent Note - 7/12/2018 4:25:36 PM
Y - Hit a new all-time high with today's big gain backed by near average volume. Found support at its 50 DMA line ($82.08). Disciplined investors will note that since featured on 5/18/18 it has not posted confirming gains above the pivot point backed by at least +40% above average volume to confirm a proper technical buy signal.
>>> FEATURED STOCK ARTICLE : Gains Have Lacked Volume While Approaching All-Time High - 6/8/2018 |
View all notes |
Set NEW NOTE alert |
Company Profile |
SEC
News |
Chart |
Request a new note
C
A
S
I |
OLLI
-
NASDAQ
Ollie's Bargain Outlet
Retail-DiscountandVariety
|
$74.45
|
+1.90
2.62% |
$75.03
|
443,656
50.19% of 50 DAV
50 DAV is 884,000
|
$77.50
-3.94%
|
7/12/2018
|
$74.43
|
PP = $77.60
|
|
MB = $81.48
|
Most Recent Note - 7/12/2018 4:18:59 PM
Y - Color code is changed to yellow with new pivot point cited based on its 6/06/18 high plus 10 cents. Subsequent volume driven gains for new highs may trigger a new (or add-on) technical buy signal. Its 50 DMA line ($71.20) defines important near-term support to watch.
>>> FEATURED STOCK ARTICLE : Found Recent Support at 50-Day Moving Average Line - 7/5/2018 |
View all notes |
Set NEW NOTE alert |
Company Profile |
SEC
News |
Chart |
Request a new note
C
A
S
I |
MOMO
-
NASDAQ
Momo Inc Ads Cl A
INTERNET - Content
|
$45.44
|
+1.06
2.38% |
$45.49
|
3,260,944
64.91% of 50 DAV
50 DAV is 5,024,000
|
$54.24
-16.22%
|
6/1/2018
|
$48.62
|
PP = $46.79
|
|
MB = $49.13
|
Most Recent Note - 7/17/2018 10:59:47 AM
Y - Consolidating near its 50 DMA line ($45.10) which acted as support after a slump below the old high ($46.69 on 8/08/17) into the prior base raised concerns. Subsequent losses below the recent low ($41.11 on 6/27/18) would raise serious concerns and trigger a worrisome technical sell signal.
>>> FEATURED STOCK ARTICLE : Volume-Driven Gain for New All-Time High - 6/1/2018 |
View all notes |
Set NEW NOTE alert |
Company Profile |
SEC
News |
Chart |
Request a new note
C
A
S
I |
NOVT
-
NASDAQ
Novanta Inc
Elec-Scientific/Msrng
|
$65.85
|
+0.70
1.07% |
$66.00
|
121,607
61.11% of 50 DAV
50 DAV is 199,000
|
$68.00
-3.16%
|
7/12/2018
|
$65.90
|
PP = $68.10
|
|
MB = $71.51
|
Most Recent Note - 7/12/2018 5:12:02 PM
Y - Color code was changed to yellow with new pivot point cited based on its 6/06/18 high plus 10 cents. Perched within close striking distance of its 52-week high. Subsequent volume-driven gains above the pivot point may trigger a new (or add-on) technical buy signal. The 50 DMA line ($63.62) and recent low ($59.25) define important near-term support. See the latest FSU analysis for more details and a new annotated graph.
>>> FEATURED STOCK ARTICLE : Gain Challenged 52-Week High and New Pivot Point - 7/12/2018 |
View all notes |
Set NEW NOTE alert |
Company Profile |
SEC
News |
Chart |
Request a new note
C
A
S
I |
Symbol/Exchange
Company Name
Industry Group |
PRICE |
CHANGE
(%Change) |
Day High |
Volume
(% DAV)
(% 50 day avg vol) |
52 Wk Hi
% From Hi |
Featured
Date |
Price
Featured |
Pivot Featured |
|
Max Buy |
BZUN
-
NASDAQ
Baozun Inc Cl A Ads
Computer Sftwr-Enterprse
|
$62.03
|
-0.09
-0.14% |
$62.48
|
1,517,856
59.55% of 50 DAV
50 DAV is 2,549,000
|
$67.41
-7.98%
|
5/15/2018
|
$45.38
|
PP = $52.43
|
|
MB = $55.05
|
Most Recent Note - 7/12/2018 12:40:18 PM
G - Rebounding toward its 52-week high with a big gain today. Found support near prior highs in the $52 area while consolidating near its 50 DMA line ($56.58). The recent low ($51.50 on 6/27/18) defines important near-term support.
>>> FEATURED STOCK ARTICLE : Found Support Near Prior Highs and 50 Day Moving Average - 7/6/2018 |
View all notes |
Set NEW NOTE alert |
Company Profile |
SEC
News |
Chart |
Request a new note
C
A
S
I |