You are not logged in.
This means you
CAN ONLY VIEW reports that were published prior to Thursday, March 20, 2025.
You
MUST UPGRADE YOUR MEMBERSHIP if you want to see any current reports.
AFTER MARKET UPDATE - MONDAY, APRIL 24TH, 2023
Previous After Market Report Next After Market Report >>>
|
|
|
|
DOW |
+66.44 |
33,875.40 |
+0.20% |
|
Volume |
751,914,745 |
-18% |
|
Volume |
4,905,495,100 |
+2% |
|
NASDAQ |
-35.25 |
12,037.20 |
-0.29% |
|
Advancers |
1,579 |
55% |
|
Advancers |
1,804 |
40% |
|
S&P 500 |
+3.52 |
4,137.04 |
+0.09% |
|
Decliners |
1,313 |
45% |
|
Decliners |
2,652 |
60% |
|
Russell 2000 |
-2.63 |
1,788.87 |
-0.15% |
|
52 Wk Highs |
52 |
|
|
52 Wk Highs |
80 |
|
|
S&P 600 |
-0.09 |
1,160.02 |
-0.01% |
|
52 Wk Lows |
37 |
|
|
52 Wk Lows |
211 |
|
|
 |
Mixed and Indecisive Market Action Continues
Kenneth J. Gruneisen - Passed the CAN SLIM® Master's Exam
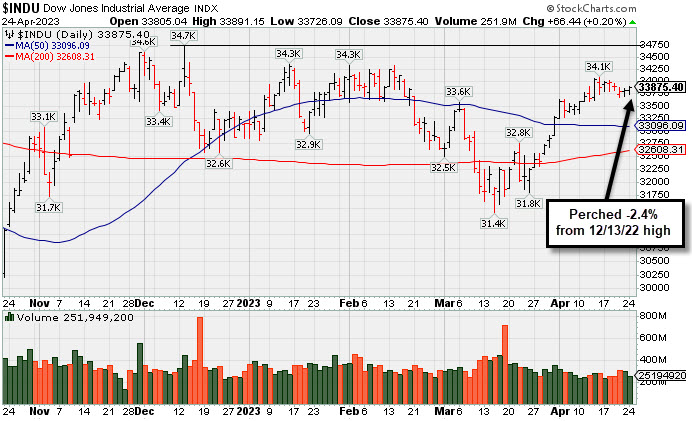
The Dow added 66 points (0.2%), while the Nasdaq Composite declined 0.3%. The S&P 500 increased 0.1%. Volume totals reported were mixed, lighter than the prior session on the NYSE and higher on the Nasdaq exchange. Advancers led decliners by a narrow margin on the NYSE but decliners led advancers by a 3-2 margin on the Nasdaq exchange. There were 18 high-ranked companies from the Leaders List that hit a new 52-week high and were listed on the BreakOuts Page, versus the total of 24 on the prior session. New 52-week highs outnumbered new 52-week lows on the NYSE but new lows still solidly outnumbered new highs on the Nasdaq exchange.The major indices are in a confirmed uptrend (M criteria). Appropriate new buying efforts may be considered under the fact-based investment system.
PICTURED: The Dow Jones Industrial Average is perched -2.4% off its December 13, 2022 high.
Six of 11 sectors finished in positive territory as U.S. equities finished mixed Monday. Mixed earnings reports came from some major financial institutions. There are several Big Tech earnings due tomorrow. In earnings news today, First Republic Bank (FRC +12.20%) rose despite the fact it reported deposits declined 40% to $104.5 billion after sharp deposit outflows troubled the already weakening bank. Elsewhere, Credit Suisse Group AG (CS +2.11%) reported one of the biggest-ever quarterly bank profits after nearly collapsing a month ago. The company announced a $13.9 billion in earnings due to the incurred gains from the bailout plus a write down of $17 billion in debt that counted towards the quarter’s revenue results.
On the data front, March’s Chicago Federal Reserve (Fed) National Activity Index remained unchanged at a 0.19 decline. Meanwhile, April’s Dallas Fed Manufacturing Activity plummeted more than expected to negative 23.4 from March’s 15.7 negative reading. Treasuries strengthened, with the yield on the 10-year note declining five basis points (0.05%) to 3.51%, while the 30-year bond yield dropped five basis points (0.05%) to 3.72%. The yield on the two-year note declined four basis points (0.04%) to 4.14%. In commodities, West Texas Intermediate (WTI) crude gained 1.2% to $78.77/barrel amid increased optimism over Chinese demand. Investor sentiment rose after Chinese customs data showed a record volume of oil imports in March following an uptick in travel bookings for Chinese residents after years of lockdown.
|
 Kenneth J. Gruneisen started out as a licensed stockbroker in August 1987, a couple of months prior to the historic stock market crash that took the Dow Jones Industrial Average down -22.6% in a single day. He has published daily fact-based fundamental and technical analysis on high-ranked stocks online for two decades. Through FACTBASEDINVESTING.COM, Kenneth provides educational articles, news, market commentary, and other information regarding proven investment systems that work in good times and bad.
Comments contained in the body of this report are technical opinions only and are not necessarily those of Gruneisen Growth Corp. The material herein has been obtained from sources believed to be reliable and accurate, however, its accuracy and completeness cannot be guaranteed. Our firm, employees, and customers may effect transactions, including transactions contrary to any recommendation herein, or have positions in the securities mentioned herein or options with respect thereto. Any recommendation contained in this report may not be suitable for all investors and it is not to be deemed an offer or solicitation on our part with respect to the purchase or sale of any securities. |
|
 |
Commodity-Linked Groups Rose as Other Groups Sputtered
Kenneth J. Gruneisen - Passed the CAN SLIM® Master's Exam
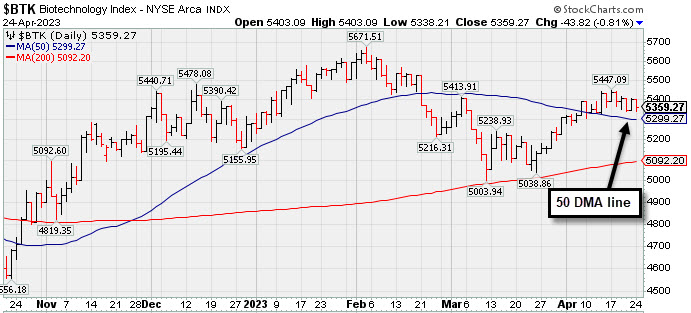
The Bank Index ($BKX -0.43%), Broker/Dealer Index ($XBD -0.35%), and Retail Index ($RLX -0.18%) each ended slightly lower on Monday. The tech sector also had a negative bias as the Biotech Index ($BTK -0.81%) and Semiconductor Index ($SOX -0.46%) both lost ground while the Networking Index ($NWX +0.13%) eked out a small gain. Meanwhile, commodity-linked groups had a positive bias as the Oil Services Index ($OSX +2.42%) and Integrated Oil Index ($XOI +1.47%) both outpaced the Gold & Silver Index ($XAU +0.56%).
PICTURED: The Biotech Index ($BTK -0.81%) pulled back on Monday. It is consolidating above its 50-day moving average (DMA) line. It rebounded impressively from its March low after finding support at its 200 DMA line.
| Oil Services |
$OSX |
81.45 |
+1.92 |
+2.42% |
-2.88% |
| Integrated Oil |
$XOI |
1,779.53 |
+25.84 |
+1.47% |
-0.43% |
| Semiconductor |
$SOX |
3,007.51 |
-13.93 |
-0.46% |
+18.77% |
| Networking |
$NWX |
777.94 |
+1.01 |
+0.13% |
-0.69% |
| Broker/Dealer |
$XBD |
460.44 |
-1.63 |
-0.35% |
+2.52% |
| Retail |
$RLX |
3,073.28 |
-5.48 |
-0.18% |
+11.59% |
| Gold & Silver |
$XAU |
134.97 |
+0.75 |
+0.56% |
+11.67% |
| Bank |
$BKX |
82.54 |
-0.36 |
-0.43% |
-18.15% |
| Biotech |
$BTK |
5,359.27 |
-43.82 |
-0.81% |
+1.48% |
|
|
|
 |
Sputtered While Perched in Striking Distance of 52-Week HIgh
Kenneth J. Gruneisen - Passed the CAN SLIM® Master's Exam
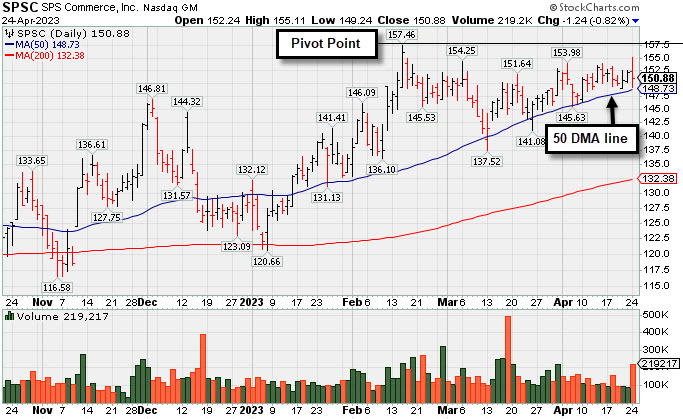
SPS Commerce (SPSC -$1.24 or -0.82% to $150.88) was highlighted in yellow with new pivot point cited based on its 2/15/23 high plus 10 cents. Subsequent gains above the pivot point backed by at least +40% above average volume may trigger a technical buy signal. It has been consolidating above its 50-day moving average (DMA) line ($148.72) in an orderly fashion in recent weeks.
SPSC reported Dec '22 quarterly earnings +37% on +19% sales revenues versus the year-ago period. Three of the 4 latest quarterly comparisons were above the +25% minimum earnings guideline (C criteria). Annual earnings (A criteria) history has been strong and it has an Earnings Per Share Rating of 98.
SPSC is -4.2% off its 52-week high and -13.5% off its all-time high. Its current Relative Strength Rating of 90 is above the 80+ minimum guideline for buy candidates. It hails from the Computer Software - Spec Enterprise group which is currently ranked 31st on the 197 Industry Groups list (L criteria).
The number of top-rated funds owning its shares rose from 562 in Sep '22 to 598 in Mar '23, a reassuring sign concerning the I criteria. Its current Up/Down Volume Ratio of 1.1 is an unbiased indication its shares have been under slight accumulation over the past 50 days. It has a Timeliness Rating of A and Sponsorship Rating of B. The small supply of 36.3 million shares outstanding (S criteria) can contribute to greater price volatility in the even of institutional buying or selling. A 2:1 split impacted share price on 8/23/19. Charts courtesy of www.stockcharts.com
 |
|
|
Color Codes Explained :
Y - Better candidates highlighted by our
staff of experts.
G - Previously featured
in past reports as yellow but may no longer be buyable under the
guidelines.
***Last / Change / Volume data in this table is the closing quote data***
Symbol/Exchange
Company Name
Industry Group |
PRICE |
CHANGE
(%Change) |
Day High |
Volume
(% DAV)
(% 50 day avg vol) |
52 Wk Hi
% From Hi |
Featured
Date |
Price
Featured |
Pivot Featured |
|
Max Buy |
 GPK
-
NYSE
GPK
-
NYSE
Graphic Packaging
CONSUMER NON-DURABLES - Packaging and Containers
|
$24.62
|
+0.20
0.82% |
$24.68
|
3,050,329
105.11% of 50 DAV
50 DAV is 2,902,000
|
$25.62
-3.90%
|
10/25/2022
|
$22.75
|
PP = $24.17
|
|
MB = $25.38
|
Most Recent Note - 4/21/2023 5:29:35 PM
Y - Pulled back for a 3rd consecutive loss today testing its 50 DMA line ($24.29) which defines important near-term support to watch. It remains perched just -4.7% below its all-time high. Recent gains lacked great volume conviction. I
>>> FEATURED STOCK ARTICLE : Quietly Consolidating Just Below "Max Buy" Level - 4/10/2023 |
View all notes |
Set NEW NOTE alert |
Company Profile |
SEC
News |
Chart |
Request a new note
C
A
S
I |
STRL
-
NASDAQ
Sterling Infrastructure
MATERIALS and; CONSTRUCTION - Heavy Construction
|
$37.38
|
+0.28
0.75% |
$37.85
|
184,080
75.44% of 50 DAV
50 DAV is 244,000
|
$42.00
-11.00%
|
12/14/2022
|
$32.41
|
PP = $33.72
|
|
MB = $35.41
|
Most Recent Note - 4/21/2023 5:32:05 PM
G - Met resistance at its 50 DMA line this week following a noted streak of 6 consecutive gains with below-average volume. A rebound above the 50 DMA line ($37.76) is needed for its outlook to improve.
>>> FEATURED STOCK ARTICLE : Volume-Driven 50-Day Moving Average Violation Triggered Sell Signal - 4/5/2023 |
View all notes |
Set NEW NOTE alert |
Company Profile |
SEC
News |
Chart |
Request a new note
C
A
S
I |
PERI
-
NASDAQ
Perion Network
Comml Svcs-Advertising
|
$36.09
|
-2.29
-5.97% |
$37.36
|
1,574,479
213.63% of 50 DAV
50 DAV is 737,000
|
$42.75
-15.58%
|
1/25/2023
|
$31.79
|
PP = $33.19
|
|
MB = $34.85
|
 Most Recent Note - 4/24/2023 6:51:39 PM
G - Violated its 50 DMA line ($36.58) with a damaging volume-driven loss today triggering a technical sell signal. Only a prompt rebound above the 50 DMA line would help its outlook improve.
>>> FEATURED STOCK ARTICLE : Perion Pulls Back Toward 50-Day Moving Average Line - 4/20/2023 |
View all notes |
Set NEW NOTE alert |
Company Profile |
SEC
News |
Chart |
Request a new note
C
A
S
I |
ALGM
-
NASDAQ
Allegro MicroSystems
Elec-Semiconductor Mfg
|
$41.13
|
-0.53
-1.27% |
$42.07
|
1,663,356
118.90% of 50 DAV
50 DAV is 1,399,000
|
$48.72
-15.58%
|
1/31/2023
|
$37.80
|
PP = $38.38
|
|
MB = $40.30
|
Most Recent Note - 4/20/2023 12:16:04 PM
G - Gapped down today for a more damaging volume-driven loss undercutting prior lows and raising greater concerns after the 50 DMA violation on 4/17/23 triggered a noted technical sell signal. Only a prompt rebound above the 50 DMA line ($44.90) would help its outlook improve.
>>> FEATURED STOCK ARTICLE : Consolidating Near 50 DMA Line After Recent Rally - 4/11/2023 |
View all notes |
Set NEW NOTE alert |
Company Profile |
SEC
News |
Chart |
Request a new note
C
A
S
I |
FIX
-
NYSE
Comfort Systems USA
MATERIALS and CONSTRUCTION - General Contractors
|
$134.01
|
-2.18
-1.60% |
$137.77
|
208,591
72.18% of 50 DAV
50 DAV is 289,000
|
$152.13
-11.91%
|
2/23/2023
|
$136.52
|
PP = $128.78
|
|
MB = $135.22
|
Most Recent Note - 4/21/2023 5:27:20 PM
Y - Pulled back today with above-average volume and closed just below its 50 DMA line ($136.68) after recent gains helped its outlook improve. Fundamentals remain strong. It has not formed a sound base and faces resistance due to overhead supply up to the $152 level. See the latest FSU analysis for more details and a new annotated graph.
>>> FEATURED STOCK ARTICLE : Consolidating Near 50-Day Moving Average and -10.5% off High - 4/21/2023 |
View all notes |
Set NEW NOTE alert |
Company Profile |
SEC
News |
Chart |
Request a new note
C
A
S
I |
Symbol/Exchange
Company Name
Industry Group |
PRICE |
CHANGE
(%Change) |
Day High |
Volume
(% DAV)
(% 50 day avg vol) |
52 Wk Hi
% From Hi |
Featured
Date |
Price
Featured |
Pivot Featured |
|
Max Buy |
KOF
-
NYSE
Coca-Cola Femsa ADR
FOOD and BEVERAGE - Beverages - Soft Drinks
|
$84.68
|
+1.62
1.95% |
$84.75
|
146,742
80.19% of 50 DAV
50 DAV is 183,000
|
$84.68
0.00%
|
3/7/2023
|
$76.63
|
PP = $77.11
|
|
MB = $80.97
|
Most Recent Note - 4/24/2023 6:54:20 PM
G - Hit a new all-time high with today's quiet gain, getting more extended from the prior base. On pullbacks, prior highs in the $79-$77 area define initial support to watch along with its 50 DMA line ($77.33).
>>> FEATURED STOCK ARTICLE : Streak of 11 Straight Gains into New High Territory - 4/12/2023 |
View all notes |
Set NEW NOTE alert |
Company Profile |
SEC
News |
Chart |
Request a new note
C
A
S
I |
ANET
-
NYSE
Arista Networks
Computer-Networking
|
$156.56
|
+0.69
0.44% |
$156.85
|
2,281,291
89.08% of 50 DAV
50 DAV is 2,561,000
|
$171.44
-8.68%
|
4/24/2023
|
$156.56
|
PP = $171.54
|
|
MB = $180.12
|
Most Recent Note - 4/24/2023 7:03:28 PM
Y - Color code is changed to yellow with new pivot point cited based on its 3/23/23 high plus 10 cents. Subsequent gains above the pivot point backed by at least +40% above average volume may trigger a new (or add-on) technical buy signal. Currently consolidating in an orderly fashion above its 50 DMA line ($153.16) which defines important support to watch above prior highs in the $148-145 area.
>>> FEATURED STOCK ARTICLE : Near High With Volume Cooling Following Volume-Driven Gains - 4/17/2023 |
View all notes |
Set NEW NOTE alert |
Company Profile |
SEC
News |
Chart |
Request a new note
C
A
S
I |
CLH
-
NYSE
Clean Harbors
Pollution Control
|
$144.27
|
+0.35
0.24% |
$145.71
|
250,069
58.16% of 50 DAV
50 DAV is 430,000
|
$146.05
-1.22%
|
3/10/2023
|
$136.89
|
PP = $136.74
|
|
MB = $143.58
|
Most Recent Note - 4/24/2023 7:06:52 PM
G - Posted a small gain today with below-average volume matching its best-ever close. Recently wedging up above its "max buy" level with gains backed by lackluster volume, not action considered indicative of fresh institutional buying demand. Found prompt support near its 50 DMA line ($136.49) during recent consolidations. Fundamentals remain strong.
>>> FEATURED STOCK ARTICLE : Wedged to a New High Close Above "Max Buy" Level - 4/19/2023 |
View all notes |
Set NEW NOTE alert |
Company Profile |
SEC
News |
Chart |
Request a new note
C
A
S
I |
MTRN
-
NYSE
Materion
METALS and MINING - Industrial Metals and Minerals
|
$111.69
|
+1.44
1.31% |
$112.01
|
51,617
40.64% of 50 DAV
50 DAV is 127,000
|
$119.75
-6.73%
|
4/18/2023
|
$114.52
|
PP = $118.30
|
|
MB = $124.22
|
Most Recent Note - 4/20/2023 4:17:25 PM
Y - Still sputtering after highlighted in yellow with pivot point cited based on its 3/03/23 high plus 10 cents in the 4/18/23 mid-day report. Hit a new all-time high with an early gain, but encountered distributional pressure. Subsequent gains and a strong close above the pivot point backed by at least +40% above average volume may trigger a proper technical buy signal. Reported earnings +33% on +9% sales revenues for the Dec '22 quarter versus the year-ago period. Three of the past 4 quarterly comparisons were above the +25% minimum earnings guideline (C criteria). A downturn in its FY '20 annual earnings history (A criteria) has been followed by much stronger '21 and '22 results.
>>> FEATURED STOCK ARTICLE : Encountered Distributional Pressure When Poised for Breakout - 4/18/2023 |
View all notes |
Set NEW NOTE alert |
Company Profile |
SEC
News |
Chart |
Request a new note
C
A
S
I |
SPSC
-
NASDAQ
SPS Commerce
COMPUTER SOFTWARE and SERVICES - Application Software
|
$150.88
|
-1.24
-0.82% |
$155.11
|
219,217
139.63% of 50 DAV
50 DAV is 157,000
|
$157.46
-4.18%
|
4/24/2023
|
$150.01
|
PP = $157.56
|
|
MB = $165.44
|
Most Recent Note - 4/24/2023 6:00:38 PM
Y - Sputtered today after highlighted in yellow with new pivot point cited based on its 2/15/23 high plus 10 cents in the earlier mid-day report. Subsequent gains above the pivot point backed by at least +40% above average volume may trigger a technical buy signal. Consolidating above its 50 DMA line ($148.72) in an orderly fashion in recent weeks. Reported Dec '22 quarterly earnings +37% on +19% sales revenues versus the year-ago period. Three of the 4 latest quarterly comparisons were above the +25% minimum earnings guideline (C criteria). Annual earnings (A criteria) history has been strong. See the latest FSU analysis for more details and a new annotated graph.
>>> FEATURED STOCK ARTICLE : Sputtered While Perched in Striking Distance of 52-Week HIgh - 4/24/2023 |
View all notes |
Set NEW NOTE alert |
Company Profile |
SEC
News |
Chart |
Request a new note
C
A
S
I |
Symbol/Exchange
Company Name
Industry Group |
PRICE |
CHANGE
(%Change) |
Day High |
Volume
(% DAV)
(% 50 day avg vol) |
52 Wk Hi
% From Hi |
Featured
Date |
Price
Featured |
Pivot Featured |
|
Max Buy |
|
|
|
THESE ARE NOT BUY RECOMMENDATIONS!
Comments contained in the body of this report are technical
opinions only. The material herein has been obtained
from sources believed to be reliable and accurate, however,
its accuracy and completeness cannot be guaranteed.
This site is not an investment advisor, hence it does
not endorse or recommend any securities or other investments.
Any recommendation contained in this report may not
be suitable for all investors and it is not to be deemed
an offer or solicitation on our part with respect to
the purchase or sale of any securities. All trademarks,
service marks and trade names appearing in this report
are the property of their respective owners, and are
likewise used for identification purposes only.
This report is a service available
only to active Paid Premium Members.
You may opt-out of receiving report notifications
at any time. Questions or comments may be submitted
by writing to Premium Membership Services 665 S.E. 10 Street, Suite 201 Deerfield Beach, FL 33441-5634 or by calling 1-800-965-8307
or 954-785-1121.
|
|
|