You are not logged in.
This means you
CAN ONLY VIEW reports that were published prior to Thursday, March 20, 2025.
You
MUST UPGRADE YOUR MEMBERSHIP if you want to see any current reports.
AFTER MARKET UPDATE - THURSDAY, APRIL 22ND, 2021
Previous After Market Report Next After Market Report >>>
|
|
|
|
DOW |
-321.41 |
33,815.90 |
-0.94% |
|
Volume |
866,068,170 |
+5% |
|
Volume |
4,364,206,600 |
+10% |
|
NASDAQ |
-132.57 |
13,817.65 |
-0.95% |
|
Advancers |
1,276 |
39% |
|
Advancers |
2,007 |
49% |
|
S&P 500 |
-38.44 |
4,134.98 |
-0.92% |
|
Decliners |
1,971 |
61% |
|
Decliners |
2,054 |
51% |
|
Russell 2000 |
-7.01 |
2,232.61 |
-0.31% |
|
52 Wk Highs |
247 |
|
|
52 Wk Highs |
131 |
|
|
S&P 600 |
-6.43 |
1,325.84 |
-0.48% |
|
52 Wk Lows |
14 |
|
|
52 Wk Lows |
28 |
|
|
 |
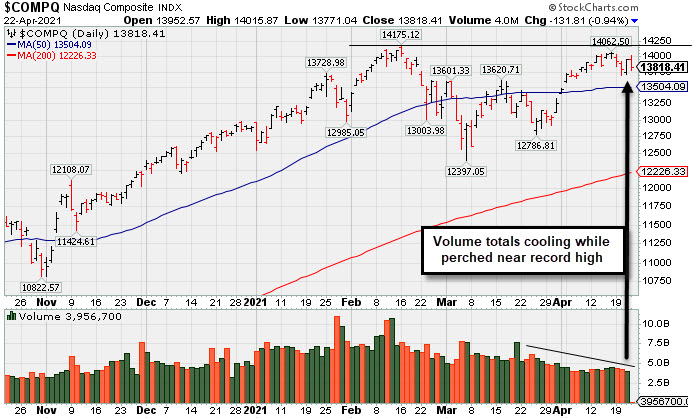
Major Indices Encounter Distributional Pressure
Kenneth J. Gruneisen - Passed the CAN SLIM® Master's Exam
The Dow slumped 321 points, while the S&P 500 and Nasdaq Composite each declined 0.9%. The small-cap Russell 2000 ended flat, reversing earlier gains of more than 1%. Ahead of the report, the major averages were narrowly mixed amid another wave of corporate earnings results and the first substantial day of economic data this week. The volume totals reported were higher than the prior session on the NYSE and on the Nasdaq exchange, action indicative of distributional pressure. Breadth was negative as decliners led advancers by a 3-2 margin on the NYSE while the mix was near even on the Nasdaq exchange. There were 38 high-ranked companies from the Leaders List that hit new 52-week highs and were listed on the BreakOuts Page, doubling the total of 19 on the prior session. New 52-week highs totals expanded and outnumbered shrinking new 52-week lows on both the NYSE and the Nasdaq exchange. The major indices (M criteria) are in a confirmed uptrend. Investors are reminded to always make buying and selling decisions on case-by-case basis under the strict criteria and rules of the fact-based investment system.
PICTURED: The Nasdaq Composite Index has seen volume totals cooling while perched near its record high.
U.S. equities experienced their worst day since March on Thursday as investors assessed news that President Biden is considering nearly doubling the capital gains tax on Americans making over $1 million annually. On the data front, initial jobless claims came in at 547,000 the week ending April 17, easing more than anticipated to a new pandemic low. Separately, existing home sales declined 3.7% in March to the lowest point since August. Treasuries modestly strengthened, with the yield on the 10-year note down one basis point to 1.54%. In commodities, WTI crude rose 0.5% to $61.64/barrel, snapping a two-day losing streak despite rising COVID-19 cases in Asia pressuring demand prospects.
All 11 S&P 500 sectors finished in negative territory, with Materials and Energy lagging. Technology and Consumer Discretionary stocks also underperformed, with analysts citing profit taking for today’s weakness ahead of corporate confessions from key companies in both sectors next week. Still, earnings results provided a bright spot in today’s session, with Equifax (EFX +14.94%) gapped up to a new record high following a boost to its annual forecast and unveiling plans to repurchase over $100 million of stock. AT&T (T +4.15%) rose after topping analyst projections for new wireless customers. Meanwhile, Southwest Airlines (LUV -1.56%) fell despite reporting a smaller-than-expected loss. |
 Kenneth J. Gruneisen started out as a licensed stockbroker in August 1987, a couple of months prior to the historic stock market crash that took the Dow Jones Industrial Average down -22.6% in a single day. He has published daily fact-based fundamental and technical analysis on high-ranked stocks online for two decades. Through FACTBASEDINVESTING.COM, Kenneth provides educational articles, news, market commentary, and other information regarding proven investment systems that work in good times and bad.
Comments contained in the body of this report are technical opinions only and are not necessarily those of Gruneisen Growth Corp. The material herein has been obtained from sources believed to be reliable and accurate, however, its accuracy and completeness cannot be guaranteed. Our firm, employees, and customers may effect transactions, including transactions contrary to any recommendation herein, or have positions in the securities mentioned herein or options with respect thereto. Any recommendation contained in this report may not be suitable for all investors and it is not to be deemed an offer or solicitation on our part with respect to the purchase or sale of any securities. |
|
 |
Financial, Retail, Tech, and Commodity-Linked Groups Fell
Kenneth J. Gruneisen - Passed the CAN SLIM® Master's Exam
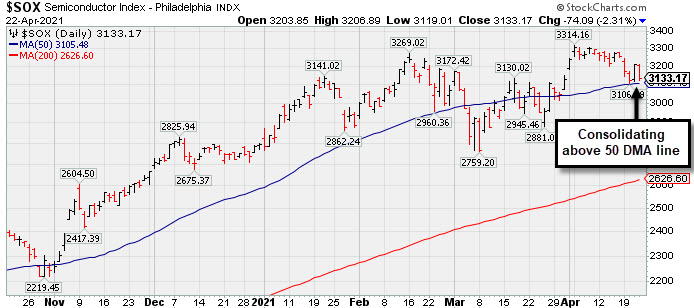
The Broker/Dealer Index ($XBD -1.68%) and Bank Index ($BKX -1.49%) lost ground along with the Retail Index ($RLX -1.14%), all weighing on the major averages. The Semiconductor Index ($SOX -2.34%) led the tech sector lower while the Networking Index ($NWX -1.15%) suffered a smaller loss and the Biotech Index ($BTK -0.15%) finished nearly unchanged. Commodity-linked groups lost ground as the Gold & Silver Index ($XAU -2.12%) outpaced the Integrated Oil Index ($XOI -1.51%) and Oil Services Index ($OSX -0.49%) to the downside.
PICTURED: The Semiconductor Index ($SOX -2.34%) is consolidating above its 50-day moving average (DMA) line.
| Oil Services |
$OSX |
49.84 |
-0.24 |
-0.49% |
+12.43% |
| Integrated Oil |
$XOI |
967.70 |
-14.87 |
-1.51% |
+22.11% |
| Semiconductor |
$SOX |
3,132.08 |
-75.18 |
-2.34% |
+12.04% |
| Networking |
$NWX |
791.56 |
-9.19 |
-1.15% |
+10.38% |
| Broker/Dealer |
$XBD |
448.16 |
-7.68 |
-1.68% |
+18.69% |
| Retail |
$RLX |
3,871.04 |
-44.53 |
-1.14% |
+8.64% |
| Gold & Silver |
$XAU |
148.55 |
-3.21 |
-2.12% |
+3.03% |
| Bank |
$BKX |
119.59 |
-1.81 |
-1.49% |
+22.14% |
| Biotech |
$BTK |
5,606.15 |
-8.63 |
-0.15% |
-2.32% |
|
|
|
 |
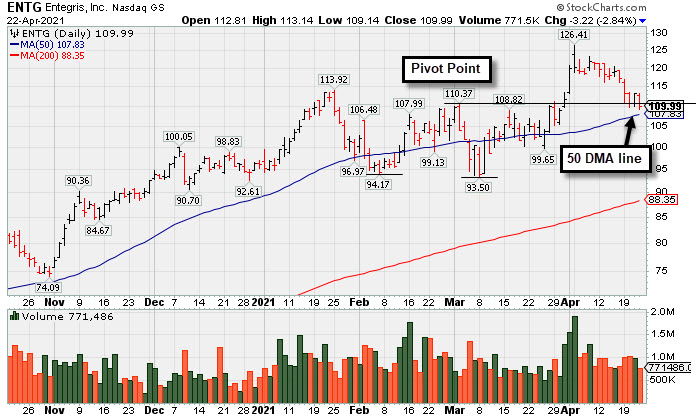
Negated Recent Breakout and Sputtering Near Prior High
Kenneth J. Gruneisen - Passed the CAN SLIM® Master's Exam
Entegris Inc (ENTG -$3.22 or -2.84% to $109.99) is sputtering below its pivot point and near the prior high in the $110 area which defines the important near-term support to watch above its 50-day moving average (DMA) line ($107.83). More damaging losses would raise greater concerns and trigger technical sell signals.
ENTG finished strong after highlighted in yellow in the 4/01/21 mid day report (read here) with pivot point cited based on its 3/02/21 high after a 9-week "double bottom" base. It rallied for a new all-time high (N criteria) when last shown in this FSU section that evening with an annotated graph under the headline, "Strong Breakout Action With +67% Above Average Volume".
The company hails from the ELECTRONICS - Semiconductor Equipment and Materials industry group which is currently ranked 14th on the 197 Industry Groups list (L criteria). It has a 95 Earnings Per Share rating and favorable fundamentals were previously noted in the 2/16/21 mid-day report - "Reported earnings +29% on +21% sales revenues for the Dec '20 quarter versus the year-ago period, its 3rd strong quarter backed with an improving sales revenues growth rate, helping it better match the +25% minimum guideline (C criteria). Annual earnings (A criteria) growth has been strong and steady after a downturn in FY '12."
There are 134.9 million shares outstanding (S criteria). The number of top-rated funds owning its shares rose from 617 in Mar '20 to 762 in Mar '21, a reassuring sign concerning the I criteria. It has a Timeliness Rating of B and Sponsorship Rating of B.
|
|
|
Color Codes Explained :
Y - Better candidates highlighted by our
staff of experts.
G - Previously featured
in past reports as yellow but may no longer be buyable under the
guidelines.
***Last / Change / Volume data in this table is the closing quote data***
Symbol/Exchange
Company Name
Industry Group |
PRICE |
CHANGE
(%Change) |
Day High |
Volume
(% DAV)
(% 50 day avg vol) |
52 Wk Hi
% From Hi |
Featured
Date |
Price
Featured |
Pivot Featured |
|
Max Buy |
 CRL
-
NYSE
CRL
-
NYSE
Charles River Labs Intl
DRUGS - Biotechnology
|
$327.70
|
+3.68
1.14% |
$331.16
|
367,308
113.02% of 50 DAV
50 DAV is 325,000
|
$327.72
-0.01%
|
12/17/2020
|
$247.06
|
PP = $257.98
|
|
MB = $270.88
|
Most Recent Note - 4/20/2021 5:32:31 PM
G - There was a "negative reversal" today after hitting new all-time highs with 3 consecutive gains. Its 50 DMA line ($290) acted as support throughout its ongoing ascent. Its Relative Strength Rating is 83, above the 80+ minimum guideline for buy candidates. Dec '20 quarterly earnings rose +19% on +14% sales revenues versus the year ago period, below the +25% minimum earnings guideline (C criteria), raising fundamental concerns.
>>> FEATURED STOCK ARTICLE : Perched at Record High After Rally From 50-Day Moving Average - 4/9/2021 |
View all notes |
Set NEW NOTE alert |
Company Profile |
SEC
News |
Chart |
Request a new note
C
A
S
I |
BRKS
-
NASDAQ
Brooks Automation
ELECTRONICS - Semiconductor Equipment and Mate
|
$99.10
|
+1.71
1.76% |
$100.58
|
723,820
101.23% of 50 DAV
50 DAV is 715,000
|
$104.40
-5.08%
|
4/5/2021
|
$99.31
|
PP = $91.88
|
|
MB = $96.47
|
Most Recent Note - 4/21/2021 6:00:34 PM
G - Color code is changed to green after today's gain and rebound back above its "max buy" level. Prior highs in the $91 area define initial support to watch above its 50 DMA line ($87).
>>> FEATURED STOCK ARTICLE : High Ranked Semiconductor Equipment Firm Powered Higher - 4/7/2021 |
View all notes |
Set NEW NOTE alert |
Company Profile |
SEC
News |
Chart |
Request a new note
C
A
S
I |
ENTG
-
NASDAQ
Entegris Inc
ELECTRONICS - Semiconductor Equipment and Mate
|
$109.99
|
-3.22
-2.84% |
$113.14
|
765,595
80.00% of 50 DAV
50 DAV is 957,000
|
$126.41
-12.99%
|
4/1/2021
|
$118.42
|
PP = $110.37
|
|
MB = $115.89
|
 Most Recent Note - 4/22/2021 5:13:40 PM
Y - Sputtering near the prior high in the $110 area which defines support to watch above its 50 DMA line ($107.83). More damaging losses would raise concerns and trigger technical sell signals. See the latest FSU analysis for more details and a new annotated graph.
>>> FEATURED STOCK ARTICLE : Negated Recent Breakout and Sputtering Near Prior High - 4/22/2021 |
View all notes |
Set NEW NOTE alert |
Company Profile |
SEC
News |
Chart |
Request a new note
C
A
S
I |
OPY
-
NYSE
Oppenheimer Holdings Inc
FINANCIAL SERVICES - Investment Brokerage - Regiona
|
$45.05
|
-0.39
-0.86% |
$46.18
|
110,648
92.98% of 50 DAV
50 DAV is 119,000
|
$45.80
-1.64%
|
2/25/2021
|
$38.95
|
PP = $38.11
|
|
MB = $40.02
|
Most Recent Note - 4/20/2021 5:30:52 PM
G - There was a "negative reversal" for a loss today after 7 consecutive small gains into new new 52-week high territory. It is extended from any sound base. Its 50 DMA line ($40.55) and prior low define near-term support to watch on pullbacks. See the latest FSU analysis for more details and a new annotated graph.
>>> FEATURED STOCK ARTICLE : Negative Reversal After 7 Consecutive Gains - 4/20/2021 |
View all notes |
Set NEW NOTE alert |
Company Profile |
SEC
News |
Chart |
Request a new note
C
A
S
I |
LAD
-
NYSE
Lithia Motors Inc Cl A
SPECIALTY RETAIL - Auto Dealerships
|
$382.20
|
-1.95
-0.51% |
$398.68
|
300,474
100.83% of 50 DAV
50 DAV is 298,000
|
$417.98
-8.56%
|
4/21/2021
|
$377.00
|
PP = $418.08
|
|
MB = $438.98
|
Most Recent Note - 4/21/2021 5:55:20 PM
Y - Finished strong today after highlighted in yellow in the earlier mid-day report with a pivot point cited based on its 3/17/21 high plus 10 cents. Today's volume-driven gain helped it close back above its 50 DMA line ($384) which has acted as support during its ongoing ascent. Subsequent gains above the pivot point backed by at least +40% above average volume may trigger a technical buy signal. Completed a new Public Offering on 9/30/20. Reported earnings +193% on +55% sales revenues for the Mar '21 quarter versus the year ago period, its 3rd consecutive quarterly earnings increases above the +25% minimum (C criteria) guideline with sequential quarters showing acceleration in its sales revenues growth rate. This Medford, Oregon-based Retail/Wholesale - Automobile firm's annual earnings history (A criteria) has been strong and steady after a dramatic downturn in FY '07 and '08 earnings. See the latest FSU analysis for more details and a new annotated graph.
>>> FEATURED STOCK ARTICLE : Building a Base With Rebound Above 50-Day Moving Average - 4/21/2021 |
View all notes |
Set NEW NOTE alert |
Company Profile |
SEC
News |
Chart |
Request a new note
C
A
S
I |
Symbol/Exchange
Company Name
Industry Group |
PRICE |
CHANGE
(%Change) |
Day High |
Volume
(% DAV)
(% 50 day avg vol) |
52 Wk Hi
% From Hi |
Featured
Date |
Price
Featured |
Pivot Featured |
|
Max Buy |
EDUC
-
NASDAQ
Educational Development
WHOLESALE - Basic Materials Wholesale
|
$17.23
|
+0.00
0.00% |
$17.53
|
9,051
31.21% of 50 DAV
50 DAV is 29,000
|
$20.00
-13.85%
|
3/10/2021
|
$17.89
|
PP = $20.10
|
|
MB = $21.11
|
Most Recent Note - 4/21/2021 5:56:20 PM
Y - Volume totals are cooling while still consolidating above its 50 DMA line ($17.02) which defines important near-term support. Met stubborn resistance in the $19-20 area. Subsequent gains above the pivot point backed by at least +40% above average volume are needed to trigger a proper technical buy signal.
>>> FEATURED STOCK ARTICLE : Finding Support During Consolidation Above 50-Day Moving Average - 4/16/2021 |
View all notes |
Set NEW NOTE alert |
Company Profile |
SEC
News |
Chart |
Request a new note
C
A
S
I |
SMPL
-
NASDAQ
Simply Good Foods Co
Food-Confectionery
|
$33.94
|
+0.09
0.27% |
$34.65
|
604,164
85.70% of 50 DAV
50 DAV is 705,000
|
$35.25
-3.72%
|
12/28/2020
|
$30.40
|
PP = $31.44
|
|
MB = $33.01
|
Most Recent Note - 4/21/2021 6:05:43 PM
G - Posted a quiet gain today, still perched within close striking distance of its 52-week and all-time high with volume totals cooling. Reported Feb '21 quarterly earnings +9% on +2% sales revenues versus the year ago period, below the +25% minimum earnings guideline (C criteria), raising fundamental concerns. Found prompt support near its 50 DMA line ($31) but its current Relative Strength Rating is 78, below the 80+ minimum guideline for buy candidates.
>>> FEATURED STOCK ARTICLE : Perched Near High But Fundamental Concerns Were Raised - 4/14/2021 |
View all notes |
Set NEW NOTE alert |
Company Profile |
SEC
News |
Chart |
Request a new note
C
A
S
I |
IBP
-
NYSE
Installed Building Prod
DIVERSIFIED SERVICES - Business/Management Services
|
$128.55
|
-1.44
-1.11% |
$132.09
|
237,986
110.18% of 50 DAV
50 DAV is 216,000
|
$133.23
-3.51%
|
4/19/2021
|
$131.15
|
PP = $130.21
|
|
MB = $136.72
|
Most Recent Note - 4/20/2021 5:41:46 PM
Y - Pulled back with above average volume today breaking a streak of 8 consecutive gains. Highlighted in yellow in the 4/19/21 mid-day report with new pivot point cited based on its 2/12/21 high plus 10 cents. Subsequent gains and a strong close above its pivot point backed by at least +40% above average volume may trigger a proper technical buy signal. Reported earnings +34% on +10% sales revenues for the Dec '20 quarter versus the year-ago period. Three of the past 4 consecutive quarterly comparisons were above the +25% minimum earnings guideline (C criteria). Annual earnings (A criteria) history has been strong. See the latest FSU analysis for more details and an annotated graph.
>>> FEATURED STOCK ARTICLE : Steady Streak of Gains Into New High Territory - 4/19/2021 |
View all notes |
Set NEW NOTE alert |
Company Profile |
SEC
News |
Chart |
Request a new note
C
A
S
I |
QRVO
-
NASDAQ
"Qorvo, Inc"
ELECTRONICS - Semiconductor - Integrated Cir
|
$187.05
|
-2.16
-1.14% |
$191.70
|
818,073
67.01% of 50 DAV
50 DAV is 1,220,900
|
$199.94
-6.45%
|
4/1/2021
|
$190.48
|
PP = $191.92
|
|
MB = $201.52
|
Most Recent Note - 4/21/2021 6:03:57 PM
Y - Managed a "positive reversal" today with higher (but below average) volume after undercutting the prior high ($191) and nearly testing its 50 DMA line ($179.67). Stalled after recently wedging up to new highs from a noted 9-week base.
>>> FEATURED STOCK ARTICLE : Hit Another New High With Even Less Volume Conviction - 4/5/2021 |
View all notes |
Set NEW NOTE alert |
Company Profile |
SEC
News |
Chart |
Request a new note
C
A
S
I |
YETI
-
NYSE
Yeti Holdings Inc
Leisure-Products
|
$85.84
|
-0.01
-0.01% |
$88.88
|
1,491,327
105.02% of 50 DAV
50 DAV is 1,420,000
|
$87.72
-2.14%
|
4/6/2021
|
$76.95
|
PP = $79.42
|
|
MB = $83.39
|
Most Recent Note - 4/21/2021 5:58:37 PM
G - Posted a solid gain on lighter volume today. Perched near its all-time high and slightly extended from the latest base. Prior highs in the $80 area define initial support to watch on pullbacks.
>>> FEATURED STOCK ARTICLE : YETI Perched Within Striking Distance of High - 4/7/2021 |
View all notes |
Set NEW NOTE alert |
Company Profile |
SEC
News |
Chart |
Request a new note
C
A
S
I |
Symbol/Exchange
Company Name
Industry Group |
PRICE |
CHANGE
(%Change) |
Day High |
Volume
(% DAV)
(% 50 day avg vol) |
52 Wk Hi
% From Hi |
Featured
Date |
Price
Featured |
Pivot Featured |
|
Max Buy |
DT
-
NYSE
Dynatrace Inc
Computer Sftwr-Enterprse
|
$51.15
|
+0.35
0.69% |
$52.18
|
841,842
39.66% of 50 DAV
50 DAV is 2,122,700
|
$56.94
-10.17%
|
2/4/2021
|
$51.39
|
PP = $48.95
|
|
MB = $51.40
|
Most Recent Note - 4/20/2021 5:36:57 PM
G - Violated its 50 DMA line ($51.52) with today's 3rd consecutive loss on light volume, retreating from near its 52-week high. Only a prompt rebound would help its outlook improve. Recent lows in the $45 area define important near-term support to watch on pullbacks. Its Relative Strength Rating is 66, below the 80+ minimum guideline for buy candidates. Fundamentals remain strong after it reported Dec '20 earnings +70% on +28% sales revenues versus the year ago period.
>>> FEATURED STOCK ARTICLE : Gap Up Rebounding Further Above 50-Day Moving Average - 4/8/2021 |
View all notes |
Set NEW NOTE alert |
Company Profile |
SEC
News |
Chart |
Request a new note
C
A
S
I |
MRBK
-
NASDAQ
Meridian Corp
Banks-Northeast
|
$25.01
|
+0.42
1.71% |
$25.39
|
33,023
91.73% of 50 DAV
50 DAV is 36,000
|
$27.96
-10.55%
|
2/22/2021
|
$25.58
|
PP = $26.10
|
|
MB = $27.41
|
Most Recent Note - 4/20/2021 5:44:59 PM
G - Color code is changed to green after slumping below its 50 DMA line ($25.38) encountering distributional pressure. Undercut the prior low ($24.13 on 3/25/21) by one cent yet recovered from the session low. More damaging losses may trigger technical sell signals. Its Relative Strength Rating is 81, just above the 80+ minimum guideline.
>>> FEATURED STOCK ARTICLE : Encountering Distributional Pressure - 4/12/2021 |
View all notes |
Set NEW NOTE alert |
Company Profile |
SEC
News |
Chart |
Request a new note
C
A
S
I |
|
|
|
THESE ARE NOT BUY RECOMMENDATIONS!
Comments contained in the body of this report are technical
opinions only. The material herein has been obtained
from sources believed to be reliable and accurate, however,
its accuracy and completeness cannot be guaranteed.
This site is not an investment advisor, hence it does
not endorse or recommend any securities or other investments.
Any recommendation contained in this report may not
be suitable for all investors and it is not to be deemed
an offer or solicitation on our part with respect to
the purchase or sale of any securities. All trademarks,
service marks and trade names appearing in this report
are the property of their respective owners, and are
likewise used for identification purposes only.
This report is a service available
only to active Paid Premium Members.
You may opt-out of receiving report notifications
at any time. Questions or comments may be submitted
by writing to Premium Membership Services 665 S.E. 10 Street, Suite 201 Deerfield Beach, FL 33441-5634 or by calling 1-800-965-8307
or 954-785-1121.
|
|
|