You are not logged in.
This means you
CAN ONLY VIEW reports that were published prior to Thursday, March 20, 2025.
You
MUST UPGRADE YOUR MEMBERSHIP if you want to see any current reports.
AFTER MARKET UPDATE - WEDNESDAY, APRIL 14TH, 2021
Previous After Market Report Next After Market Report >>>
|
|
|
|
DOW |
+53.62 |
33,730.89 |
+0.16% |
|
Volume |
861,049,292 |
+8% |
|
Volume |
4,073,682,700 |
-3% |
|
NASDAQ |
-144.80 |
13,851.30 |
-1.03% |
|
Advancers |
1,900 |
59% |
|
Advancers |
2,258 |
56% |
|
S&P 500 |
-16.93 |
4,124.66 |
-0.41% |
|
Decliners |
1,321 |
41% |
|
Decliners |
1,804 |
44% |
|
Russell 2000 |
+18.79 |
2,247.72 |
+0.84% |
|
52 Wk Highs |
292 |
|
|
52 Wk Highs |
199 |
|
|
S&P 600 |
+12.61 |
1,339.36 |
+0.95% |
|
52 Wk Lows |
19 |
|
|
52 Wk Lows |
37 |
|
|
 |
Weak Finish for Major Indices
Kenneth J. Gruneisen - Passed the CAN SLIM® Master's Exam
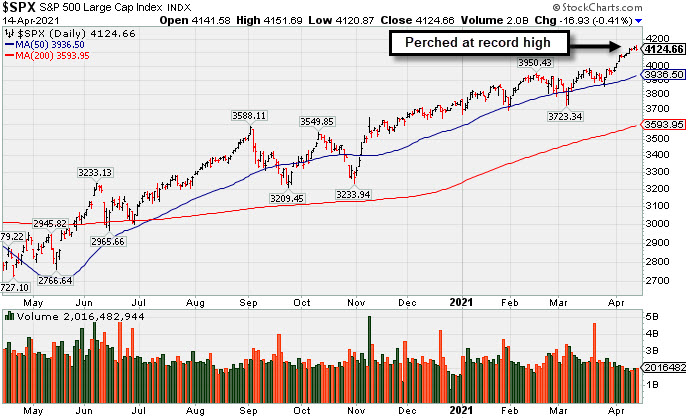
The Dow gained 53 points, paring an earlier jump of more than 200 points. Weakness in Tech shares led the S&P 500 0.4% lower, erasing an early session advance. Both benchmarks had notched new record levels during intraday trading. The Nasdaq Composite fell 1%. The volume totals were mixed, higher than the prior session on the NYSE, and lighter on the Nasdaq exchange. Advancers led decliners by a 3-2 margin on the NYSE and by 11-9 on the Nasdaq exchange. There were 38 high-ranked companies from the Leaders List that hit new 52-week highs and were listed on the BreakOuts Page, versus the total of 46 on the prior session. New 52-week highs totals expanded and solidly outnumbered new 52-week lows on the NYSE on the Nasdaq exchange. The major indices (M criteria) are in a confirmed uptrend. Investors are reminded to always make buying and selling decisions on case-by-case basis under the strict criteria and rules of the fact-based investment system.
PICTURED: The S&P 500 Index is perched near its record high.
U.S. stocks finished mixed on Wednesday as investors digested profit tallies from some of Wall Street's biggest banks. Six of 11 S&P 500 sectors closed in negative territory, with Tech and Consumer Discretionary shedding more than 1%. Energy outperformed amid a jump in oil prices. WTI crude climbed 4.6% to $62.95/barrel after official government data showed the weekly drawdown in U.S. crude stockpiles was more than twice consensus projections. Financials also bucked the downtrend. Goldman Sachs (GS +2.34%) rose after easily surpassing analyst expectations with record first-quarter net profits and revenues. JPMorgan Chase & Co (JPM -1.87%) fell after CEO Jamie Dimon noted loan demand remains a challenge following a top and bottom line beat.
Treasuries declined, with the yield on the 10-year note yield up one basis point to 1.63%. On the data front, import prices jumped 6.9% year-over-year in March, the largest annual increase since January 2012. In central bank news, Federal Reserve Chair Jerome Powell echoed recent comments surrounding momentum behind the U.S. economic recovery, with the main downside risk being another wave of COVID-19 infections. The Fed chief also reiterated outcome-based guidance, noting that tapering bond purchases would likely precede any rate hike. Meanwhile, the Fed’s Beige Book upgraded the characterization of economic acceleration to “moderate” from “modest” amid an increase in consumer spending. |
 Kenneth J. Gruneisen started out as a licensed stockbroker in August 1987, a couple of months prior to the historic stock market crash that took the Dow Jones Industrial Average down -22.6% in a single day. He has published daily fact-based fundamental and technical analysis on high-ranked stocks online for two decades. Through FACTBASEDINVESTING.COM, Kenneth provides educational articles, news, market commentary, and other information regarding proven investment systems that work in good times and bad.
Comments contained in the body of this report are technical opinions only and are not necessarily those of Gruneisen Growth Corp. The material herein has been obtained from sources believed to be reliable and accurate, however, its accuracy and completeness cannot be guaranteed. Our firm, employees, and customers may effect transactions, including transactions contrary to any recommendation herein, or have positions in the securities mentioned herein or options with respect thereto. Any recommendation contained in this report may not be suitable for all investors and it is not to be deemed an offer or solicitation on our part with respect to the purchase or sale of any securities. |
|
 |
Financial, Biotech, and Energy-Linked Groups Rose
Kenneth J. Gruneisen - Passed the CAN SLIM® Master's Exam
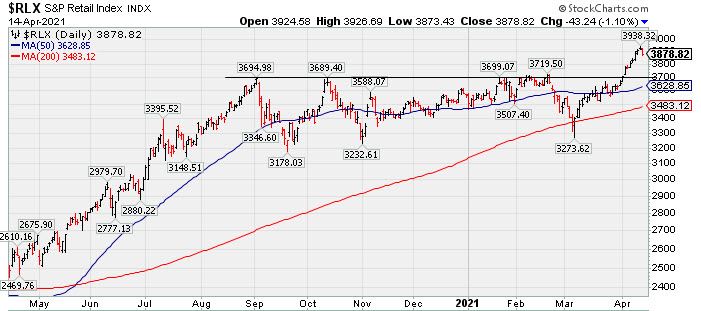
The Bank Index ($BKX +1.40%) and Broker/Dealer Index ($XBD +1.20%) both posted gains but the Retail Index ($RLX -1.10%) created a drag on the major indices. The tech sector was mixed as the Biotech Index ($BTK +0.99%) rose while the Semiconductor Index ($SOX -1.14%) and Networking Index ($NWX -0.42%) both lost ground. Energy-linked groups had a positive bias as the Oil Services Index ($OSX +5.67%) and Integrated Oil Index ($XOI +3.19%) posted standout gains, meanwhile, the Gold & Silver Index ($XAU -0.62%) edged lower.
PICTURED: The Retail Index ($RLX -1.10%) pulled back from its record high following 5 consecutive gains.
| Oil Services |
$OSX |
53.66 |
+2.88 |
+5.67% |
+21.05% |
| Integrated Oil |
$XOI |
1,019.80 |
+31.51 |
+3.19% |
+28.68% |
| Semiconductor |
$SOX |
3,215.57 |
-37.13 |
-1.14% |
+15.03% |
| Networking |
$NWX |
806.90 |
-3.37 |
-0.42% |
+12.52% |
| Broker/Dealer |
$XBD |
460.67 |
+5.45 |
+1.20% |
+22.00% |
| Retail |
$RLX |
3,878.82 |
-43.24 |
-1.10% |
+8.86% |
| Gold & Silver |
$XAU |
142.13 |
-0.88 |
-0.62% |
-1.43% |
| Bank |
$BKX |
123.70 |
+1.71 |
+1.40% |
+26.34% |
| Biotech |
$BTK |
5,484.56 |
+53.76 |
+0.99% |
-4.43% |
|
|
|
 |
Perched Near High But Fundamental Concerns Were Raised
Kenneth J. Gruneisen - Passed the CAN SLIM® Master's Exam
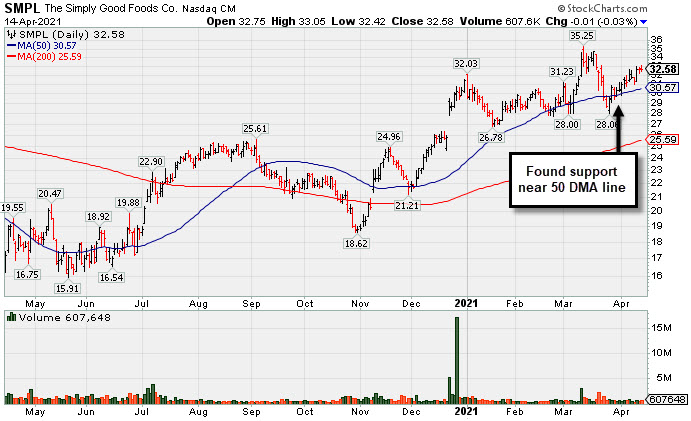
Simply Good Foods Co (SMPL -$0.01 or -0.03% to $32.58) is perched within striking distance of its 52-week high. Recently it reported Feb '21 quarterly earnings +9% on +2% sales revenues versus the year ago period, below the +25% minimum earnings guideline (C criteria), raising fundamental concerns. The prior 4 quarterly comparisons were above the +25% minimum earnings guideline (C criteria). Its annual earnings history (A criteria) has been strong.
SMPL found prompt support near its 50-day moving average (DMA) line ($30.57) but its current Relative Strength Rating is 73, below the 80+ minimum guideline for buy candidates. It showed resilience after last shown in this FSU section on 3/24/21 with an annotated graph included under the headline, "Violation of 50-Day Moving Average Triggered Technical Sell Signal". It was first highlighted in yellow with pivot point cited based on its 9/09/19 high plus 10 cents in the 12/28/20 mid-day report (read here).
SMPL completed a new Pubic Offering on 10/09/19. The company has a Timeliness Rating of B and Sponsorship Rating of C. The number of top-rated funds owning its shares fell from 442 in Dec '19 to 360 in Dec '20. However, its current Up/Down Volume Ratio of 1.2 is an unbiased indication its shares have been under slight accumulation over the past 50 days.
Some leadership has been provided by other companies in the Food/Beverage Sector, however, the Food-Confectionery industry group has a Group Relative Strength Rating of 11 (D-) which is a concern regarding the L criteria. There are only 5 companies listed in the group.
|
|
|
Color Codes Explained :
Y - Better candidates highlighted by our
staff of experts.
G - Previously featured
in past reports as yellow but may no longer be buyable under the
guidelines.
***Last / Change / Volume data in this table is the closing quote data***
Symbol/Exchange
Company Name
Industry Group |
PRICE |
CHANGE
(%Change) |
Day High |
Volume
(% DAV)
(% 50 day avg vol) |
52 Wk Hi
% From Hi |
Featured
Date |
Price
Featured |
Pivot Featured |
|
Max Buy |
 FBC
-
NYSE
FBC
-
NYSE
Flagstar Bancorp Inc
BANKING - Savings and Loans
|
$44.36
|
+0.26
0.59% |
$44.92
|
355,470
58.50% of 50 DAV
50 DAV is 607,600
|
$51.58
-14.00%
|
3/4/2021
|
$47.26
|
PP = $48.02
|
|
MB = $50.42
|
Most Recent Note - 4/13/2021 5:42:02 PM
G - Still sputtering just below its 50 DMA line ($45.63) which has acted as resistance in recent weeks. Near-term support to watch is prior lows. Relative Strength Rating is 75, below the 80+ minimum guideline. See the latest FSU analysis for more details and a new annotated graph.
>>> FEATURED STOCK ARTICLE : 50-Day Moving Average Line Acted as Resistance - 4/13/2021 |
View all notes |
Set NEW NOTE alert |
Company Profile |
SEC
News |
Chart |
Request a new note
C
A
S
I |
CRL
-
NYSE
Charles River Labs Intl
DRUGS - Biotechnology
|
$309.17
|
-0.65
-0.21% |
$313.88
|
180,329
56.00% of 50 DAV
50 DAV is 322,000
|
$309.99
-0.26%
|
12/17/2020
|
$247.06
|
PP = $257.98
|
|
MB = $270.88
|
Most Recent Note - 4/9/2021 5:35:26 PM
G - Posted a quiet gain today for a best-ever close, its 7th gain in 8 sessions. Its 50 DMA line ($284) acted as support throughout its ongoing ascent. Its Relative Strength Rating is 77, below the 80+ minimum guideline for buy candidates. Dec '20 quarterly earnings rose +19% on +14% sales revenues versus the year ago period, below the +25% minimum earnings guideline (C criteria), raising fundamental concerns. See the latest FSU analysis for more details and a new annotated graph.
>>> FEATURED STOCK ARTICLE : Perched at Record High After Rally From 50-Day Moving Average - 4/9/2021 |
View all notes |
Set NEW NOTE alert |
Company Profile |
SEC
News |
Chart |
Request a new note
C
A
S
I |
BRKS
-
NASDAQ
Brooks Automation
ELECTRONICS - Semiconductor Equipment and Mate
|
$96.30
|
-0.44
-0.45% |
$97.66
|
596,746
84.41% of 50 DAV
50 DAV is 707,000
|
$101.63
-5.24%
|
4/5/2021
|
$99.31
|
PP = $91.88
|
|
MB = $96.47
|
Most Recent Note - 4/9/2021 5:38:09 PM
Y - Color code is changed to yellow after quietly consolidating back below its "max buy" level. Prior highs in the $91 area define initial support to watch above its 50 DMA line ($84)
>>> FEATURED STOCK ARTICLE : High Ranked Semiconductor Equipment Firm Powered Higher - 4/7/2021 |
View all notes |
Set NEW NOTE alert |
Company Profile |
SEC
News |
Chart |
Request a new note
C
A
S
I |
ENTG
-
NASDAQ
Entegris Inc
ELECTRONICS - Semiconductor Equipment and Mate
|
$118.00
|
-0.31
-0.26% |
$119.95
|
777,795
80.27% of 50 DAV
50 DAV is 969,000
|
$126.41
-6.65%
|
4/1/2021
|
$118.42
|
PP = $110.37
|
|
MB = $115.89
|
Most Recent Note - 4/13/2021 5:46:21 PM
G - Still hovering near its all-time high and stubbornly holding its ground following a noted spurt of volume-driven gains. Prior highs in the $114-110 area define near-term support to watch on pullbacks.
>>> FEATURED STOCK ARTICLE : Strong Breakout Action With +67% Above Average Volume - 4/1/2021 |
View all notes |
Set NEW NOTE alert |
Company Profile |
SEC
News |
Chart |
Request a new note
C
A
S
I |
OPY
-
NYSE
Oppenheimer Holdings Inc
FINANCIAL SERVICES - Investment Brokerage - Regiona
|
$44.10
|
+0.32
0.73% |
$44.95
|
105,011
82.04% of 50 DAV
50 DAV is 128,000
|
$44.38
-0.63%
|
2/25/2021
|
$38.95
|
PP = $38.11
|
|
MB = $40.02
|
Most Recent Note - 4/12/2021 5:42:42 PM
G - Posted a 2nd consecutive gain with light volume, approaching its prior high. Its 50 DMA line ($39.59) and prior low define near-term support to watch.
>>> FEATURED STOCK ARTICLE : Oppenheimer Consolidating Near Max Buy Level - 3/31/2021 |
View all notes |
Set NEW NOTE alert |
Company Profile |
SEC
News |
Chart |
Request a new note
C
A
S
I |
Symbol/Exchange
Company Name
Industry Group |
PRICE |
CHANGE
(%Change) |
Day High |
Volume
(% DAV)
(% 50 day avg vol) |
52 Wk Hi
% From Hi |
Featured
Date |
Price
Featured |
Pivot Featured |
|
Max Buy |
EDUC
-
NASDAQ
Educational Development
WHOLESALE - Basic Materials Wholesale
|
$17.27
|
-0.21
-1.20% |
$17.78
|
28,130
87.91% of 50 DAV
50 DAV is 32,000
|
$20.00
-13.65%
|
3/10/2021
|
$17.89
|
PP = $20.10
|
|
MB = $21.11
|
Most Recent Note - 4/9/2021 5:39:46 PM
Y - Still consolidating above its 50 DMA line ($16.57) which defines important near-term support. Met stubborn resistance in the $19-20 area. Subsequent gains above the pivot point backed by at least +40% above average volume are needed to trigger a proper technical buy signal.
>>> FEATURED STOCK ARTICLE : Consolidating Above 50 DMA Line Perched Near High - 3/30/2021 |
View all notes |
Set NEW NOTE alert |
Company Profile |
SEC
News |
Chart |
Request a new note
C
A
S
I |
SMPL
-
NASDAQ
Simply Good Foods Co
Food-Confectionery
|
$32.58
|
-0.01
-0.03% |
$33.05
|
400,359
56.66% of 50 DAV
50 DAV is 706,600
|
$35.25
-7.57%
|
12/28/2020
|
$30.40
|
PP = $31.44
|
|
MB = $33.01
|
 Most Recent Note - 4/14/2021 5:15:55 PM
G - Showed resilience and remains perched near prior highs. Reported Feb '21 quarterly earnings +9% on +2% sales revenues versus the year ago period, below the +25% minimum earnings guideline (C criteria), raising fundamental concerns. Found prompt support near its 50 DMA line ($30.57) but its current Relative Strength Rating is 73, below the 80+ minimum guideline for buy candidates. See the latest FSU analysis for more details and a new annotated graph.
>>> FEATURED STOCK ARTICLE : Perched Near High But Fundamental Concerns Were Raised - 4/14/2021 |
View all notes |
Set NEW NOTE alert |
Company Profile |
SEC
News |
Chart |
Request a new note
C
A
S
I |
QRVO
-
NASDAQ
Qorvo Inc
ELECTRONICS - Semiconductor - Integrated Cir
|
$189.85
|
-2.57
-1.34% |
$194.69
|
658,203
45.71% of 50 DAV
50 DAV is 1,440,000
|
$199.94
-5.05%
|
4/1/2021
|
$190.48
|
PP = $191.92
|
|
MB = $201.52
|
Most Recent Note - 4/12/2021 5:44:22 PM
Y - Posted a small gain today with lighter volume. Perched near its all-time high, it recently wedging up from any orderly 9-week base. Prior highs in the $191-185 area define initial support to watch on pullbacks. See the latest FSU analysis for more details and an annotated graph.
>>> FEATURED STOCK ARTICLE : Hit Another New High With Even Less Volume Conviction - 4/5/2021 |
View all notes |
Set NEW NOTE alert |
Company Profile |
SEC
News |
Chart |
Request a new note
C
A
S
I |
YETI
-
NYSE
Yeti Holdings Inc
Leisure-Products
|
$83.57
|
+0.88
1.06% |
$85.02
|
1,149,871
83.87% of 50 DAV
50 DAV is 1,371,000
|
$85.39
-2.13%
|
4/6/2021
|
$76.95
|
PP = $79.42
|
|
MB = $83.39
|
Most Recent Note - 4/12/2021 1:05:34 PM
Y - Hitting a new all-time high with heavier volume behind today's 5th consecutive gain. A new pivot point was cited based on its 2/10/21 high while working on a "double bottom" base. Gains above the pivot point triggered a new (or add-on) technical buy signal.
>>> FEATURED STOCK ARTICLE : YETI Perched Within Striking Distance of High - 4/7/2021 |
View all notes |
Set NEW NOTE alert |
Company Profile |
SEC
News |
Chart |
Request a new note
C
A
S
I |
DT
-
NYSE
Dynatrace Inc
Computer Sftwr-Enterprse
|
$54.14
|
-0.40
-0.73% |
$56.14
|
1,314,925
53.34% of 50 DAV
50 DAV is 2,465,300
|
$56.94
-4.92%
|
2/4/2021
|
$51.39
|
PP = $48.95
|
|
MB = $51.40
|
Most Recent Note - 4/13/2021 5:45:24 PM
G - Posted a 4th consecutive gain today with lighter volume while rising further above its 50 DMA line ($51.12) toward prior highs and little resistance remains due to overhead supply. Recent lows in the $45 area define important near-term support to watch on pullbacks. Its Relative Strength Rating is 76 is still below the 80+ minimum guideline for buy candidates. Fundamentals remain strong after it reported Dec '20 earnings +70% on +28% sales revenues versus the year ago period.
>>> FEATURED STOCK ARTICLE : Gap Up Rebounding Further Above 50-Day Moving Average - 4/8/2021 |
View all notes |
Set NEW NOTE alert |
Company Profile |
SEC
News |
Chart |
Request a new note
C
A
S
I |
Symbol/Exchange
Company Name
Industry Group |
PRICE |
CHANGE
(%Change) |
Day High |
Volume
(% DAV)
(% 50 day avg vol) |
52 Wk Hi
% From Hi |
Featured
Date |
Price
Featured |
Pivot Featured |
|
Max Buy |
MRBK
-
NASDAQ
Meridian Corp
Banks-Northeast
|
$25.55
|
+0.22
0.87% |
$25.79
|
14,841
40.11% of 50 DAV
50 DAV is 37,000
|
$27.96
-8.62%
|
2/22/2021
|
$25.58
|
PP = $26.10
|
|
MB = $27.41
|
Most Recent Note - 4/12/2021 5:40:44 PM
Y - Encountered distributional pressure today. Volume totals had been below average in recent weeks while hovering in a tight range within close striking distance of its all-time high. Its 50 DMA line ($24.84) and prior low ($24.13 on 3/25/21) define important near-term support to watch where violations may trigger technical sell signals. Its Relative Strength Rating is 78, just below the 80+ minimum guideline. See the latest FSU analysis for more details and a new annotated graph.
>>> FEATURED STOCK ARTICLE : Encountering Distributional Pressure - 4/12/2021 |
View all notes |
Set NEW NOTE alert |
Company Profile |
SEC
News |
Chart |
Request a new note
C
A
S
I |
|
|
|
THESE ARE NOT BUY RECOMMENDATIONS!
Comments contained in the body of this report are technical
opinions only. The material herein has been obtained
from sources believed to be reliable and accurate, however,
its accuracy and completeness cannot be guaranteed.
This site is not an investment advisor, hence it does
not endorse or recommend any securities or other investments.
Any recommendation contained in this report may not
be suitable for all investors and it is not to be deemed
an offer or solicitation on our part with respect to
the purchase or sale of any securities. All trademarks,
service marks and trade names appearing in this report
are the property of their respective owners, and are
likewise used for identification purposes only.
This report is a service available
only to active Paid Premium Members.
You may opt-out of receiving report notifications
at any time. Questions or comments may be submitted
by writing to Premium Membership Services 665 S.E. 10 Street, Suite 201 Deerfield Beach, FL 33441-5634 or by calling 1-800-965-8307
or 954-785-1121.
|
|
|