You are not logged in.
This means you
CAN ONLY VIEW reports that were published prior to Friday, March 28, 2025.
You
MUST UPGRADE YOUR MEMBERSHIP if you want to see any current reports.
AFTER MARKET UPDATE - THURSDAY, APRIL 13TH, 2017
Previous After Market Report Next After Market Report >>>
|
|
|
|
DOW |
-138.61 |
20,453.25 |
-0.67% |
|
Volume |
912,060,380 |
+2% |
|
Volume |
1,455,315,050 |
-4% |
|
NASDAQ |
-31.01 |
5,805.15 |
-0.53% |
|
Advancers |
811 |
28% |
|
Advancers |
875 |
31% |
|
S&P 500 |
-15.98 |
2,328.95 |
-0.68% |
|
Decliners |
2,077 |
72% |
|
Decliners |
1,947 |
69% |
|
Russell 2000 |
-13.95 |
1,345.24 |
-1.03% |
|
52 Wk Highs |
53 |
|
|
52 Wk Highs |
41 |
|
|
S&P 600 |
-9.61 |
815.62 |
-1.16% |
|
52 Wk Lows |
26 |
|
|
52 Wk Lows |
52 |
|
|
 |
Major Indices Closed Below Respective 50-Day Moving Averages
Kenneth J. Gruneisen - Passed the CAN SLIM® Master's Exam
For the week, the Dow was down 1%, the S&P 500 lost 1.1%, and the Nasdaq fell 1.2%. An afternoon slump ahead of the long holiday weekend led the 3 major averages to erase early gains and close beneath their respective 50-day moving average lines. US markets will be closed in observation of Good Friday. Thursday's volume totals reported were mixed, higher than the prior session total on the NYSE and lighter on the Nasdaq exchange. Breadth was negative as decliners led advancers by 5-2 on the NYSE and 2-1 on the Nasdaq exchange. There were 8 high-ranked companies from the Leaders List that made new 52-week highs and were listed on the BreakOuts Page, versus the total of 7 on the prior session. New 52-week highs totals still outnumbered new 52-week lows on the NYSE, but new lows outnumbered new highs on the Nasdaq exchange.
PICTURED: The Nasdaq Composite Index closed Thursday's session below its 50-day moving average (DMA) line. Subsequent losses leading to a violation of the recent low would raise greater concerns regarding the market rally's health.
Leadership thinned with respect to the number of high-ranked stocks hitting new highs as the major averages' (M criteria) uptrend recently came under pressure. New buying efforts should only be made in candidates with superior fundamental and technical characteristics. The Featured Stocks Page lists noteworthy high-ranked leaders.
Stocks finished lower on Thursday. The Dow was down 138 points to 20453. The S&P 500 lost 15 points to 2328 and the Nasdaq Composite fell 31 points to 5805.
The major averages declined amid news on the geopolitical front and the beginning of first-quarter earnings season. Equities moved lower Thursday after the United States dropped the largest non-nuclear bomb on a cave complex in Afghanistan. On the domestic front, a gauge of inflation showed that producer prices slipped 0.1% last month. Separately, the University of Michigan preliminary report on consumer sentiment came in at 98, above analyst estimates.
All 11 sectors in the S&P 500 ended in negative territory. Energy shares underperformed with Weatherford International (WFT -4.3%) down. Health Care stocks declined with Abbot Labs (ABT -1.9%) falling after receiving an FDA warning letter regarding defibrillators. Financials extended their weekly loss despite this morning’s optimistic profit tallies. JP Morgan fell 1.2% to $84.40 even though the investment bank reported better-than-expected quarterly results. Citigroup (C -0.8%) edged lower despite fixed-income trading revenue climbing 19% year-over-year. In the consumer space, HanesBrands (HBI +0.7%) inched higher after reaffirming full-year earnings guidance.
Treasuries finished mixed with the benchmark 10-year note up 1/32 to yield 2.24%. In commodities, NYMEX WTI crude lost 0.1% to $53.04/barrel. In FOREX, the Dollar Index fell 0.2% after President Trump stated on Wednesday that the currency was getting “too strong.” |
 Kenneth J. Gruneisen started out as a licensed stockbroker in August 1987, a couple of months prior to the historic stock market crash that took the Dow Jones Industrial Average down -22.6% in a single day. He has published daily fact-based fundamental and technical analysis on high-ranked stocks online for two decades. Through FACTBASEDINVESTING.COM, Kenneth provides educational articles, news, market commentary, and other information regarding proven investment systems that work in good times and bad.
Comments contained in the body of this report are technical opinions only and are not necessarily those of Gruneisen Growth Corp. The material herein has been obtained from sources believed to be reliable and accurate, however, its accuracy and completeness cannot be guaranteed. Our firm, employees, and customers may effect transactions, including transactions contrary to any recommendation herein, or have positions in the securities mentioned herein or options with respect thereto. Any recommendation contained in this report may not be suitable for all investors and it is not to be deemed an offer or solicitation on our part with respect to the purchase or sale of any securities. |
|
 |
Biotech Index Posted Standout Gain on Widely Negative Session
Kenneth J. Gruneisen - Passed the CAN SLIM® Master's Exam
The Biotechnology Index ($BTK +1.36%) posted a solid gain on Thursday while the Gold & Silver Index ($XAU -0.03%) finished flat. The Retail Index ($RLX -0.82%), Bank Index ($BKX -1.43%) and the Broker/Dealer Index ($XBD -0.85%) unanimously fell, weighing on the major indices. The tech sector saw modest losses from the Semiconductor Index ($SOX -0.68%) and the Networking Index ($NWX -0.45%). The Oil Services Index ($OSX -2.51%) outpaced the Integrated Oil Index ($XOI -1.70%) as energy-related shares also finished to the downside. Charts courtesy www.stockcharts.com
 PICTURED: The Networking Index ($NWX -0.45%) has been slumping below its 50-day moving average (DMA) line toward its January low.
| Oil Services |
$OSX |
164.32 |
-4.23 |
-2.51% |
-10.59% |
| Integrated Oil |
$XOI |
1,170.83 |
-20.24 |
-1.70% |
-7.66% |
| Semiconductor |
$SOX |
960.01 |
-6.54 |
-0.68% |
+5.91% |
| Networking |
$NWX |
438.49 |
-2.00 |
-0.45% |
-1.70% |
| Broker/Dealer |
$XBD |
203.91 |
-1.75 |
-0.85% |
-0.67% |
| Retail |
$RLX |
1,431.26 |
-11.79 |
-0.82% |
+6.57% |
| Gold & Silver |
$XAU |
89.40 |
-0.03 |
-0.03% |
+13.37% |
| Bank |
$BKX |
88.02 |
-1.28 |
-1.43% |
-4.11% |
| Biotech |
$BTK |
3,525.55 |
+47.24 |
+1.36% |
+14.65% |
|
|
|
 |
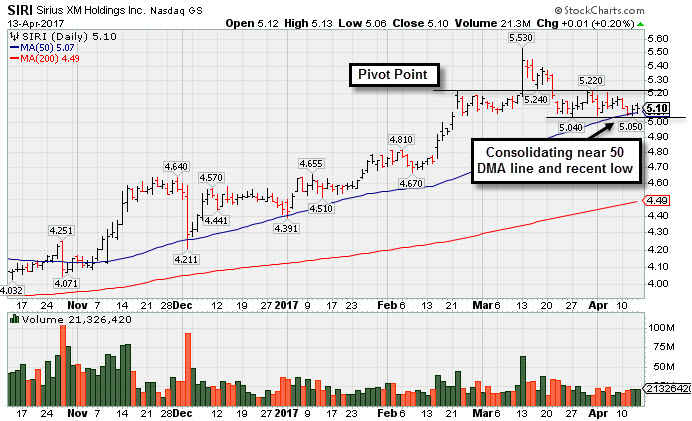
Consolidating Above Near-Term Support Level
Kenneth J. Gruneisen - Passed the CAN SLIM® Master's Exam
Sirius X M Holdings Inc (SIRI +$0.01 or +0.20% to $5.10) has been consolidating just above its 50-day moving average (DMA) line ($5.07) and recent low ($5.04 on 3/27/17). More damaging losses would raise greater concerns. Disciplined investors always limit losses by selling any stock that falls more than -7% from their purchase price.
SIRI stalled following its last appearance in this FSU section on 3/13/17 with an annotated graph under the headline "Breakout From Advanced Base Pattern Backed By Very Heavy Volume". It was highlighted in yellow with new pivot point cited based on its 2/12/16 high plus 10 cents in the earlier mid-day report (read here). It hit new multi-year highs (N criteria) with a big gain backed by nearly 3 times its average volume, well above the minimum of +40% above average volume needed to trigger a proper technical buy signal.
The Telecom Services - Cable /Satellite firm has an 89 Composite Rating. Its earnings increases have been above the +25% minimum guideline (C criteria) in 3 of the past 4 quarterly comparisons through Dec '16 while sales revenues growth was in the +9-11% range. Its annual earnings history (A criteria) has been improving since a downturn in FY '13.
It has a large supply of 4.71 billion shares outstanding. The number of top-ranted funds owning its shares rose from 628 in Mar '16 to 658 in Dec '16, a reassuring sign concerning the I criteria.
|
|
|
Color Codes Explained :
Y - Better candidates highlighted by our
staff of experts.
G - Previously featured
in past reports as yellow but may no longer be buyable under the
guidelines.
***Last / Change / Volume data in this table is the closing quote data***
Symbol/Exchange
Company Name
Industry Group |
PRICE |
CHANGE
(%Change) |
Day High |
Volume
(% DAV)
(% 50 day avg vol) |
52 Wk Hi
% From Hi |
Featured
Date |
Price
Featured |
Pivot Featured |
|
Max Buy |
SBCF
-
NASDAQ
Seacoast Banking Corp Fl
BANKING - Regional - Mid-Atlantic Banks
|
$23.02
|
-0.48
-2.04% |
$23.44
|
282,479
63.48% of 50 DAV
50 DAV is 445,000
|
$25.13
-8.40%
|
2/13/2017
|
$24.84
|
PP = $23.10
|
|
MB = $24.26
|
 Most Recent Note - 4/13/2017 5:02:59 PM
G - Loss today undercut its 50 DMA line ($23.52) raising concerns and its color code is changed to green. Subsequent deterioration below the recent low ($21.89 on 3/22/17) would raise more serious concerns and trigger a worrisome technical sell signal.
>>> FEATURED STOCK ARTICLE : Rebound After Slump Below 50-Day Average Into Prior Base - 3/28/2017 |
View all notes |
Set NEW NOTE alert |
Company Profile |
SEC
News |
Chart |
Request a new note
C
A
S
I |
CSFL
-
NASDAQ
Centerstate Banks Inc
Banks-Southeast
|
$23.74
|
-0.67
-2.74% |
$24.40
|
139,577
47.96% of 50 DAV
50 DAV is 291,000
|
$26.94
-11.87%
|
3/13/2017
|
$25.54
|
PP = $26.40
|
|
MB = $27.72
|
Most Recent Note - 4/13/2017 5:05:04 PM
G - Slumped further below its 50 DMA line ($25.08) and near its recent low ($23.70 on 3/27/17). More damaging losses would raise even greater concerns.
>>> FEATURED STOCK ARTICLE : Gain Backed By Volume For Best Ever Close - 3/15/2017 |
View all notes |
Set NEW NOTE alert |
Company Profile |
SEC
News |
Chart |
Request a new note
C
A
S
I |
NSP
-
NYSE
Insperity Inc
Comml Svcs-Outsourcing
|
$85.30
|
-0.40
-0.47% |
$86.85
|
78,830
49.58% of 50 DAV
50 DAV is 159,000
|
$90.55
-5.80%
|
2/14/2017
|
$84.30
|
PP = $82.28
|
|
MB = $86.39
|
Most Recent Note - 4/13/2017 5:00:48 PM
Y - Consolidating in an orderly fashion above near-term support at its 50 DMA line ($84.03). Old highs the $82 area define the next important support level to watch.
>>> FEATURED STOCK ARTICLE : Ordinary Pullback From Highs With Lighter Volume - 3/22/2017 |
View all notes |
Set NEW NOTE alert |
Company Profile |
SEC
News |
Chart |
Request a new note
C
A
S
I |
HTHT
-
NASDAQ
China Lodging Group Ads
LEISURE - Lodging
|
$58.90
|
-0.31
-0.52% |
$60.25
|
160,024
109.61% of 50 DAV
50 DAV is 146,000
|
$64.32
-8.43%
|
9/29/2016
|
$46.12
|
PP = $47.82
|
|
MB = $50.21
|
Most Recent Note - 4/12/2017 12:31:40 PM
G - Holding its ground today near its 50 DMA line ($58.77) after a volume-driven loss raised concerns and triggered a technical sell signal on the prior session. The 2 latest quarterly comparisons (Sep and Dec '16) were below the +25% minimum earnings guideline (C criteria), and its waning sales revenues growth rate was also noted recently as a fundamental concern.
>>> FEATURED STOCK ARTICLE : Bullish Action Led to +54% Rally Since First Featured - 3/17/2017 |
View all notes |
Set NEW NOTE alert |
Company Profile |
SEC
News |
Chart |
Request a new note
C
A
S
I |
SIRI
-
NASDAQ
Sirius X M Holdings Inc
MEDIA - Broadcasting - Radio
|
$5.10
|
+0.01
0.20% |
$5.13
|
21,682,986
93.00% of 50 DAV
50 DAV is 23,314,000
|
$5.53
-7.78%
|
3/13/2017
|
$5.48
|
PP = $5.32
|
|
MB = $5.59
|
Most Recent Note - 4/13/2017 4:57:56 PM
Y - Consolidating just above its 50 DMA line ($5.07) and recent low ($5.04 on 3/27/17). More damaging losses would raise greater concerns. Disciplined investors always limit losses by selling any stock that falls more than -7% from their purchase price. See the latest FSU analysis for more details and a new annotated graph.
>>> FEATURED STOCK ARTICLE : Consolidating Above Near-Term Support Level - 4/13/2017 |
View all notes |
Set NEW NOTE alert |
Company Profile |
SEC
News |
Chart |
Request a new note
C
A
S
I |
Symbol/Exchange
Company Name
Industry Group |
PRICE |
CHANGE
(%Change) |
Day High |
Volume
(% DAV)
(% 50 day avg vol) |
52 Wk Hi
% From Hi |
Featured
Date |
Price
Featured |
Pivot Featured |
|
Max Buy |
BEAT
-
NASDAQ
BioTelemetry Inc
Medical-Services
|
$30.45
|
-0.20
-0.65% |
$30.88
|
224,398
53.68% of 50 DAV
50 DAV is 418,000
|
$31.70
-3.94%
|
2/14/2017
|
$25.10
|
PP = $24.55
|
|
MB = $25.78
|
Most Recent Note - 4/11/2017 12:11:26 PM
G - Gapped up on the prior session hitting new highs on M&A news. Disciplined investors avoid chasing extended stocks. During recent consolidations it found support well above its 50 DMA line and above prior highs in the $24 area.
>>> FEATURED STOCK ARTICLE : Perched Near High, Extended From Prior Base - 4/3/2017 |
View all notes |
Set NEW NOTE alert |
Company Profile |
SEC
News |
Chart |
Request a new note
C
A
S
I |
ULTA
-
NASDAQ
Ulta Beauty Inc
SPECIALTY RETAIL - Specialty Retail, Other
|
$282.68
|
-1.10
-0.39% |
$285.83
|
329,303
49.97% of 50 DAV
50 DAV is 659,000
|
$289.27
-2.28%
|
3/6/2017
|
$274.96
|
PP = $278.73
|
|
MB = $292.67
|
Most Recent Note - 4/7/2017 5:25:31 PM
Y - Still consolidating near its all-time high with volume totals cooling. Prior highs in the $278 area define support along with its 50 DMA line. Subsequent losses leading to violations would raise concerns and trigger technical sell signals. See the latest FSU analysis for more details and a new annotated graph.
>>> FEATURED STOCK ARTICLE : Volume Totals Cooling Following Technical Breakout - 4/7/2017 |
View all notes |
Set NEW NOTE alert |
Company Profile |
SEC
News |
Chart |
Request a new note
C
A
S
I |
ESNT
-
NYSE
Essent Group Ltd
Finance-MrtgandRel Svc
|
$36.82
|
-0.97
-2.57% |
$37.73
|
548,132
77.42% of 50 DAV
50 DAV is 708,000
|
$38.53
-4.44%
|
4/4/2017
|
$36.38
|
PP = $36.81
|
|
MB = $38.65
|
Most Recent Note - 4/13/2017 5:08:14 PM
Y - Pulled back today after touching a new high on the prior session but reversing in the red. Its 50 DMA line ($35.77) and recent lows define important near-term support. Recently rose above the new pivot point cited based on its 3/16/17 high, the middle peak of the "double bottom" base formed over the prior 8 weeks. See the latest FSU analysis for more details and an annotated graph.
>>> FEATURED STOCK ARTICLE : Quiet Volume Behind Gain for New High Close - 4/10/2017 |
View all notes |
Set NEW NOTE alert |
Company Profile |
SEC
News |
Chart |
Request a new note
C
A
S
I |
VEEV
-
NYSE
Veeva Systems Inc Cl A
Computer Sftwr-Medical
|
$50.67
|
+0.19
0.38% |
$51.15
|
804,370
64.45% of 50 DAV
50 DAV is 1,248,000
|
$51.95
-2.46%
|
3/16/2017
|
$49.00
|
PP = $48.05
|
|
MB = $50.45
|
Most Recent Note - 4/10/2017 5:49:20 PM
G - Touched a new all-time high today but reversed into the red for a loss on average volume. Prior highs in the $47-48 area define initial support to watch on pullbacks.
>>> FEATURED STOCK ARTICLE : Breakout Gain for New Highs Backed by Three Times Average Volume - 3/16/2017 |
View all notes |
Set NEW NOTE alert |
Company Profile |
SEC
News |
Chart |
Request a new note
C
A
S
I |
ANET
-
NYSE
Arista Networks Inc
TELECOMMUNICATIONS - Communication Equipment
|
$131.36
|
-0.11
-0.08% |
$133.61
|
321,639
37.10% of 50 DAV
50 DAV is 867,000
|
$135.27
-2.89%
|
3/6/2017
|
$119.43
|
PP = $123.22
|
|
MB = $129.38
|
Most Recent Note - 4/7/2017 5:31:44 PM
G - Pulled back slightly today with light volume, remaining perched near its all-time high, extended from any sound base. Disciplined investors avoid chasing extended stocks.
>>> FEATURED STOCK ARTICLE : Extended From Any Sound Base After a Considerable Rally - 4/5/2017 |
View all notes |
Set NEW NOTE alert |
Company Profile |
SEC
News |
Chart |
Request a new note
C
A
S
I |
Symbol/Exchange
Company Name
Industry Group |
PRICE |
CHANGE
(%Change) |
Day High |
Volume
(% DAV)
(% 50 day avg vol) |
52 Wk Hi
% From Hi |
Featured
Date |
Price
Featured |
Pivot Featured |
|
Max Buy |
IBP
-
NYSE
Installed Building Prod
DIVERSIFIED SERVICES - Business/Management Services
|
$50.60
|
-0.85
-1.65% |
$51.70
|
76,921
49.31% of 50 DAV
50 DAV is 156,000
|
$53.00
-4.53%
|
2/27/2017
|
$44.83
|
PP = $44.40
|
|
MB = $46.62
|
Most Recent Note - 4/7/2017 5:29:50 PM
G - Volume totals have been cooling while hovering in a tight range near its all-time high, extended from its prior base. Its 50 DMA line ($46.80) defines initial support to watch above prior highs in the $44 area.
>>> FEATURED STOCK ARTICLE : Hovering Near All-Time High Following Volume-Driven Gains - 4/4/2017 |
View all notes |
Set NEW NOTE alert |
Company Profile |
SEC
News |
Chart |
Request a new note
C
A
S
I |
INGN
-
NASDAQ
Inogen Inc
HEALTH SERVICES - Medical Instruments and Supplies
|
$75.21
|
-0.81
-1.07% |
$76.68
|
112,785
66.74% of 50 DAV
50 DAV is 169,000
|
$79.94
-5.92%
|
2/27/2017
|
$68.69
|
PP = $69.94
|
|
MB = $73.44
|
Most Recent Note - 4/10/2017 5:52:03 PM
G - Traded light volume today while pulling back from its all-time high. It is extended from its prior base. Its 50 DMA line ($71.69) and prior highs in the $69 area define important near-term support to watch.
>>> FEATURED STOCK ARTICLE : Best Ever Close For High-Ranked Medical Product Maker - 3/31/2017 |
View all notes |
Set NEW NOTE alert |
Company Profile |
SEC
News |
Chart |
Request a new note
C
A
S
I |
PLAY
-
NASDAQ
Dave & Buster's Ent Inc
Retail-Restaurants
|
$59.90
|
+0.27
0.45% |
$60.49
|
441,219
53.81% of 50 DAV
50 DAV is 820,000
|
$63.12
-5.10%
|
2/23/2017
|
$55.41
|
PP = $58.35
|
|
MB = $61.27
|
Most Recent Note - 4/12/2017 5:50:18 PM
G - Holding its ground with lighter volume after volume-driven gains for new all-time highs. Reported earnings +19% on +15% sales revenues for the Jan '17 quarter, below the +25% minimum guideline (C criteria). Its 50 DMA line ($58.14) defines near-term support to watch.
>>> FEATURED STOCK ARTICLE : Retreated From All-Time High Following Earnings Report - 3/29/2017 |
View all notes |
Set NEW NOTE alert |
Company Profile |
SEC
News |
Chart |
Request a new note
C
A
S
I |
OLLI
-
NASDAQ
Ollie's Bargain Outlet
Retail-DiscountandVariety
|
$33.30
|
-0.40
-1.19% |
$34.00
|
352,960
64.53% of 50 DAV
50 DAV is 547,000
|
$35.80
-6.98%
|
3/27/2017
|
$32.80
|
PP = $33.55
|
|
MB = $35.23
|
Most Recent Note - 4/12/2017 5:49:06 PM
Y - Still quietly hovering near its all-time high and near the prior pivot point. Stubbornly holding its ground after reporting earnings +22% on +16% sales revenues for the Jan '17 quarter, below the +25% minimum earnings guideline (C criteria).
>>> FEATURED STOCK ARTICLE : No Resistance Remains and Earnings News is Due - 3/27/2017 |
View all notes |
Set NEW NOTE alert |
Company Profile |
SEC
News |
Chart |
Request a new note
C
A
S
I |
MOMO
-
NASDAQ
Momo Inc Ads Cl A
INTERNET - Content
|
$38.18
|
+0.32
0.85% |
$38.95
|
3,382,736
71.13% of 50 DAV
50 DAV is 4,756,000
|
$39.25
-2.73%
|
3/7/2017
|
$29.71
|
PP = $27.83
|
|
MB = $29.22
|
Most Recent Note - 4/12/2017 12:35:03 PM
G - Hitting yet another new all-time high with today's gain, getting very extended from the previously noted base. Its 50 DMA line ($30) and prior highs in the $28 area define important support to watch on pullbacks.
>>> FEATURED STOCK ARTICLE : Extended From Prior Base and Perched Near High - 4/6/2017 |
View all notes |
Set NEW NOTE alert |
Company Profile |
SEC
News |
Chart |
Request a new note
C
A
S
I |
Symbol/Exchange
Company Name
Industry Group |
PRICE |
CHANGE
(%Change) |
Day High |
Volume
(% DAV)
(% 50 day avg vol) |
52 Wk Hi
% From Hi |
Featured
Date |
Price
Featured |
Pivot Featured |
|
Max Buy |
|
|
|
THESE ARE NOT BUY RECOMMENDATIONS!
Comments contained in the body of this report are technical
opinions only. The material herein has been obtained
from sources believed to be reliable and accurate, however,
its accuracy and completeness cannot be guaranteed.
This site is not an investment advisor, hence it does
not endorse or recommend any securities or other investments.
Any recommendation contained in this report may not
be suitable for all investors and it is not to be deemed
an offer or solicitation on our part with respect to
the purchase or sale of any securities. All trademarks,
service marks and trade names appearing in this report
are the property of their respective owners, and are
likewise used for identification purposes only.
This report is a service available
only to active Paid Premium Members.
You may opt-out of receiving report notifications
at any time. Questions or comments may be submitted
by writing to Premium Membership Services 665 S.E. 10 Street, Suite 201 Deerfield Beach, FL 33441-5634 or by calling 1-800-965-8307
or 954-785-1121.
|
|
|