You are not logged in.
This means you
CAN ONLY VIEW reports that were published prior to Friday, March 21, 2025.
You
MUST UPGRADE YOUR MEMBERSHIP if you want to see any current reports.
AFTER MARKET UPDATE - THURSDAY, FEBRUARY 29TH, 2024
Previous After Market Report Next After Market Report >>>
|
|
|
|
DOW |
+47.37 |
38,996.39 |
+0.12% |
|
Volume |
1,748,173,324 |
+95% |
|
Volume |
6,422,345,300 |
+15% |
|
NASDAQ |
+144.18 |
16,091.92 |
+0.90% |
|
Advancers |
1,893 |
69% |
|
Advancers |
2,562 |
60% |
|
S&P 500 |
+26.51 |
5,096.27 |
+0.52% |
|
Decliners |
831 |
30% |
|
Decliners |
1,713 |
40% |
|
Russell 2000 |
+14.54 |
2,054.84 |
+0.71% |
|
52 Wk Highs |
231 |
|
|
52 Wk Highs |
268 |
|
|
S&P 600 |
+8.31 |
1,305.07 |
+0.64% |
|
52 Wk Lows |
22 |
|
|
52 Wk Lows |
80 |
|
|
 |
Breadth Positive as Major Indices Rose With Greater Leadership
Kenneth J. Gruneisen - Passed the CAN SLIM® Master's Exam
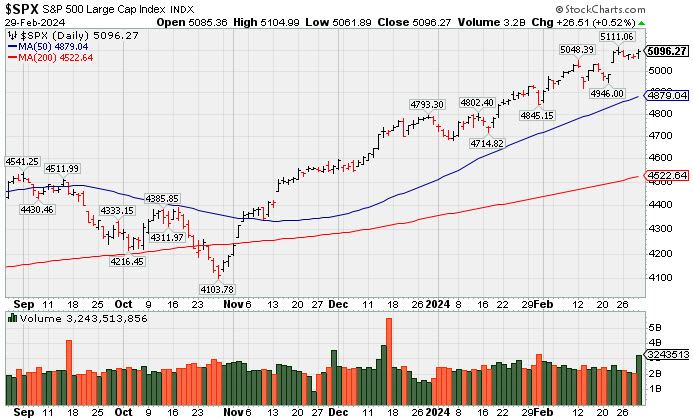
The Nasdaq Composite (+0.9%) closed at a fresh all-time high. The S&P 500 closed with a +0.5% gain. The Dow Jones Industrial Average eked out a +0.1% gain; and the Russell 2000 climbed +0.7%. Volume was reported higher than the prior session totals on the NYSE and on the Nasdaq exchange. Advancers led decliners by more than a 2-1 margin on the NYSE and by about a 3-2 margin on the Nasdaq exchange. There were 117 high-ranked companies from the Leaders List that hit new 52-week highs and were listed on the BreakOuts Page, versus the total of 101 on the prior session. New 52-week highs totals expanded and solidly outnumbered shrinking new 52-week lows totals on the NYSE and on the Nasdaq exchange. The major indices are in a confirmed uptrend (M criteria). New buying efforts should be only made in stocks fitting all key criteria of the fact-based investment system.
PICTURED: The S&P 500 Index is consolidating near its all-time high.
The Personal Income and Spending Report for January didn't contain any surprises. The PCE Price Indexes were in-line with expectations, showing year-over-year disinflation for the PCE Price Index to 2.4% (from 2.6%) and the core-PCE Price Index to 2.8% (from 2.9%).
Nine of the S&P 500 sectors posted gains. The heavily-weighted information technology (+1.3%), communication services (+1.3%), and consumer discretionary (+1.0%) sectors posted the largest gains. Salesforce (CRM +3.0%), higher after reporting earnings, provided a boost to the info tech sector. Meanwhile, the health care (-0.7%) and consumer staples (-0.3%) sectors were alone in the red at the close. An increase in buying activity in the final hour of trading brought gains in the mega cap space. Amazon.com (AMZN +2.08%), Microsoft (MSFT +1.45%), and Meta Platforms (META +1.26%) were among the influential gainers
Treasuries saw the 2-yr note yield fall three basis points to 4.64% and the 10-yr note yield fell two basis points to 4.25%.
|
 Kenneth J. Gruneisen started out as a licensed stockbroker in August 1987, a couple of months prior to the historic stock market crash that took the Dow Jones Industrial Average down -22.6% in a single day. He has published daily fact-based fundamental and technical analysis on high-ranked stocks online for two decades. Through FACTBASEDINVESTING.COM, Kenneth provides educational articles, news, market commentary, and other information regarding proven investment systems that work in good times and bad.
Comments contained in the body of this report are technical opinions only and are not necessarily those of Gruneisen Growth Corp. The material herein has been obtained from sources believed to be reliable and accurate, however, its accuracy and completeness cannot be guaranteed. Our firm, employees, and customers may effect transactions, including transactions contrary to any recommendation herein, or have positions in the securities mentioned herein or options with respect thereto. Any recommendation contained in this report may not be suitable for all investors and it is not to be deemed an offer or solicitation on our part with respect to the purchase or sale of any securities. |
|
 |
Retail, Financial, Semi, and Gold & Silver Indexes Led Gainers
Kenneth J. Gruneisen - Passed the CAN SLIM® Master's Exam
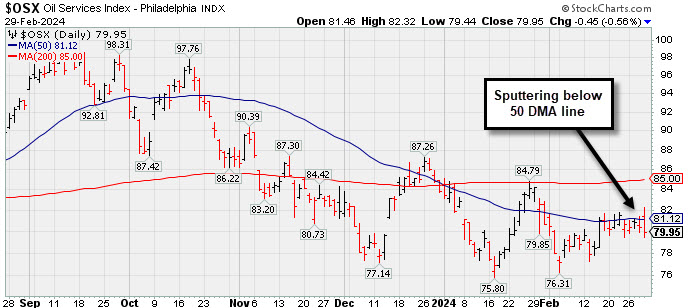
The Retail Index ($RLX +1.29%) ended higher while the Broker/Dealer Index ($XBD +0.20%) and the Bank Index ($BKX +0.83%) posted smaller gains. The tech sector was mixed as the Semiconductor Index ($SOX +2.70%) posted a solid gain but the Networking Index ($NWX -1.75%) and the Biotech Index ($BTK -0.90%) each ended lower. The Gold & Silver Index ($XAU +2.36%) outpaced the Integrated Oil Index ($XOI +0.82%)
![]() PICTURED: The Oil Services Index ($OSX -0.56%) ended slightly lower, and it recently has sputtered below its 50-day moving average (DMA) line.
| Oil Services |
$OSX |
79.95 |
-0.45 |
-0.56% |
-4.69% |
| Integrated Oil |
$XOI |
1,940.09 |
+15.87 |
+0.82% |
+4.17% |
| Semiconductor |
$SOX |
4,726.92 |
+124.32 |
+2.70% |
+13.21% |
| Networking |
$NWX |
803.50 |
-14.30 |
-1.75% |
-3.52% |
| Broker/Dealer |
$XBD |
572.77 |
+1.13 |
+0.20% |
+2.78% |
| Retail |
$RLX |
4,413.86 |
+56.00 |
+1.29% |
+13.50% |
| Gold & Silver |
$XAU |
105.37 |
+2.43 |
+2.36% |
-16.17% |
| Bank |
$BKX |
96.71 |
+0.80 |
+0.83% |
+0.72% |
| Biotech |
$BTK |
5,186.94 |
-47.09 |
-0.90% |
-4.28% |
|
|
|
 |
Hovering Near All-Time High After Streak of Small Gains
Kenneth J. Gruneisen - Passed the CAN SLIM® Master's Exam
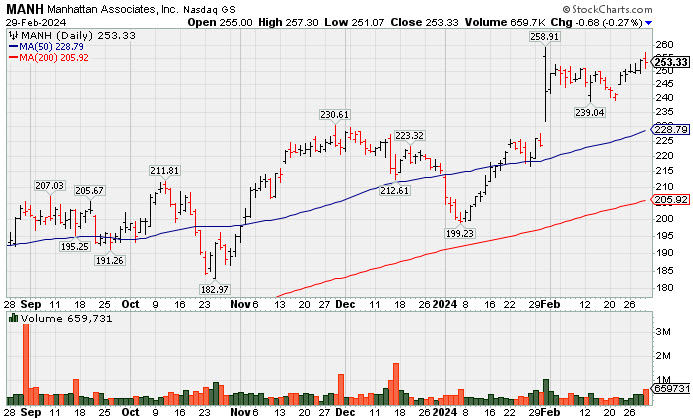
Manhattan Associates Inc (MANH -$0.68 or -0.27% to $253.33) challenged its all-time high today following 5 consecutive small gains. Prior highs in the $230 area and its 50-day moving average (DMA) define near-term support to watch on pullbacks. MANH closed in the middle of its intra-day range after highlighted in yellow with pivot point cited based on its 11/29/23 high plus 10 cents in the 1/31/24 mid-day report (read here). It was shown in greater detail on 1/31/24 with an annotated graph under the headline, "Big Volume Behind Breakout Gain". Earnings increases were above the +25% minimum guideline in the 5 latest quarterly comparisons through Dec '23. Annual earnings growth has been strong. It has a 96 Earnings Per Share (EPS) rating. Its Relative Strength rating is 90. It has a small supply of 61.6 million shares (S criteria) outstanding, which can contribute to volatility in the event of institutional buying or selling. The number of top-rated funds owning its shares rose from 849 in Mar '23 to 1,272 in Dec '23, a reassuring sign concerning the I criteria. Charts courtesy www.stockcharts.com
 |
|
|
Color Codes Explained :
Y - Better candidates highlighted by our
staff of experts.
G - Previously featured
in past reports as yellow but may no longer be buyable under the
guidelines.
***Last / Change / Volume data in this table is the closing quote data***
Symbol/Exchange
Company Name
Industry Group |
PRICE |
CHANGE
(%Change) |
Day High |
Volume
(% DAV)
(% 50 day avg vol) |
52 Wk Hi
% From Hi |
Featured
Date |
Price
Featured |
Pivot Featured |
|
Max Buy |
 ANET
-
NYSE
ANET
-
NYSE
Arista Networks
Computer-Networking
|
$277.54
|
+4.37
1.60% |
$278.17
|
2,353,653
108.41% of 50 DAV
50 DAV is 2,171,000
|
$292.66
-5.17%
|
10/31/2023
|
$188.84
|
PP = $198.80
|
|
MB = $208.74
|
 Most Recent Note - 2/29/2024 12:44:39 PM
G - Volume totals have been cooling while hovering near its all-time high, extended from any sound base. Its 50 DMA line ($256.53) defines important near-term support to watch on pullbacks.
>>> FEATURED STOCK ARTICLE : Pulled Back From All Time High With Gap Down on Prior Session - 2/1/2024 |
View all notes |
Set NEW NOTE alert |
Company Profile |
SEC
News |
Chart |
Request a new note
C
A
S
I |
NVO
-
NYSE
Novo Nordisk ADR
Medical-Ethical Drugs
|
$119.77
|
-1.77
-1.46% |
$120.28
|
5,472,156
119.09% of 50 DAV
50 DAV is 4,595,000
|
$124.87
-4.08%
|
11/2/2023
|
$100.97
|
PP = $104.10
|
|
MB = $109.31
|
Most Recent Note - 2/27/2024 12:25:23 PM
G - Perched near its all-time high, extended from any sound base. Its 50 DMA line ($110.58) defines important near-term support to watch on pullbacks.
>>> FEATURED STOCK ARTICLE : Extended From Any Sound Base After Volume-Driven Gains - 2/8/2024 |
View all notes |
Set NEW NOTE alert |
Company Profile |
SEC
News |
Chart |
Request a new note
C
A
S
I |
AXON
-
NASDAQ
Axon Enterprise
Security/Sfty
|
$307.26
|
-1.96
-0.63% |
$311.04
|
1,501,417
360.05% of 50 DAV
50 DAV is 417,000
|
$318.90
-3.65%
|
11/8/2023
|
$127.84
|
PP = $223.30
|
|
MB = $234.47
|
Most Recent Note - 2/29/2024 12:08:08 PM
G - Pulling back today after getting very extended from any sound base and hitting a new all-time high with a big volume-driven gain on the prior session. Bullish action came after it reported Dec '23 quarterly earnings +60% on +29% sales revenues versus the year-ago period. Volume and volatility often increase near earnings news. Prior highs in the $260-262 area define initial support to watch above its 50-day moving average (DMA) line ($260).
>>> FEATURED STOCK ARTICLE : Reversal at All-Time High After 7 Consecutive Gains - 2/12/2024 |
View all notes |
Set NEW NOTE alert |
Company Profile |
SEC
News |
Chart |
Request a new note
C
A
S
I |
TDG
-
NYSE
TransDigm Group
Aerospace/Defense
|
$1,177.74
|
+5.74
0.49% |
$1,179.26
|
314,606
147.70% of 50 DAV
50 DAV is 213,000
|
$1,207.58
-2.47%
|
12/12/2023
|
$1,000.39
|
PP = $1,013.18
|
|
MB = $1,063.84
|
Most Recent Note - 2/27/2024 11:30:31 AM
G - Pulling back today with below-average volume for a 2nd loss off of its all-time high. Its 50 DMA line ($1,068) defines near-term support to watch.
>>> FEATURED STOCK ARTICLE : Transdigm Perched Near All-Time High - 2/14/2024 |
View all notes |
Set NEW NOTE alert |
Company Profile |
SEC
News |
Chart |
Request a new note
C
A
S
I |
TBBK
-
NASDAQ
The Bancorp
Banks-Northeast
|
$44.72
|
+0.07
0.16% |
$46.24
|
306,555
69.99% of 50 DAV
50 DAV is 438,000
|
$47.11
-5.07%
|
1/22/2024
|
$40.87
|
PP = $42.56
|
|
MB = $44.69
|
Most Recent Note - 2/27/2024 6:19:45 PM
G - Color code was changed to green after wedging above its "max buy" level with today's 3rd consecutive gain backed by below-average volume. Prior highs in the $42 area and its 50 DMA line ($41.28) define near-term support to watch. Fundamentals remain strong. See the latest FSU analysis for more details and a new annotated graph.
>>> FEATURED STOCK ARTICLE : Wedging Above "Max Buy" Level With Gains Lacking Great Volume - 2/27/2024 |
View all notes |
Set NEW NOTE alert |
Company Profile |
SEC
News |
Chart |
Request a new note
C
A
S
I |
Symbol/Exchange
Company Name
Industry Group |
PRICE |
CHANGE
(%Change) |
Day High |
Volume
(% DAV)
(% 50 day avg vol) |
52 Wk Hi
% From Hi |
Featured
Date |
Price
Featured |
Pivot Featured |
|
Max Buy |
LULU
-
NASDAQ
lululemon athletica
Retail-Apparel/Shoes/Acc
|
$466.77
|
+2.63
0.57% |
$469.90
|
1,430,490
118.71% of 50 DAV
50 DAV is 1,205,000
|
$516.39
-9.61%
|
12/8/2023
|
$490.61
|
PP = $485.93
|
|
MB = $510.23
|
Most Recent Note - 2/29/2024 12:45:41 PM
G - Volume totals have been cooling while still lingering below its 50 DMA line ($478) which is now downward sloping and may act as resistance. A rebound above the 50 DMA line is needed to help its outlook improve.
>>> FEATURED STOCK ARTICLE : Violation of 50-Day Moving Average Hurt Outlook - 2/2/2024 |
View all notes |
Set NEW NOTE alert |
Company Profile |
SEC
News |
Chart |
Request a new note
C
A
S
I |
CRWD
-
NASDAQ
CrowdStrike Holdings
Computer Sftwr-Security
|
$323.97
|
+3.03
0.94% |
$328.98
|
3,793,922
117.82% of 50 DAV
50 DAV is 3,220,000
|
$338.45
-4.28%
|
1/2/2024
|
$246.42
|
PP = $261.91
|
|
MB = $275.01
|
Most Recent Note - 2/26/2024 5:08:30 PM
G - Posted a 3rd consecutive volume-driven gain today. Showing strength after testing support near its 50 DMA line ($286.85). Fundamentals remain strong.
>>> FEATURED STOCK ARTICLE : Volume Totals Cooking While Stubbornly Perched at All-Time High - 2/6/2024 |
View all notes |
Set NEW NOTE alert |
Company Profile |
SEC
News |
Chart |
Request a new note
C
A
S
I |
ELF
-
NYSE
e.l.f. Beauty
Cosmetics/Personal Care
|
$208.53
|
+3.78
1.85% |
$209.97
|
1,212,015
82.84% of 50 DAV
50 DAV is 1,463,000
|
$206.60
0.93%
|
1/2/2024
|
$138.23
|
PP = $153.63
|
|
MB = $161.31
|
Most Recent Note - 2/26/2024 5:09:29 PM
G - Posted a 4th consecutive gain today for yet another new all-time high. Reported Dec '23 quarterly earnings +54% on +85% sales revenues versus the year-ago period, continuing its strong earnings track record. Its 50 DMA line ($158) defines important near-term support to watch.
>>> FEATURED STOCK ARTICLE : Peched at All-Time High With Earnings News Due - 2/5/2024 |
View all notes |
Set NEW NOTE alert |
Company Profile |
SEC
News |
Chart |
Request a new note
C
A
S
I |
KOF
-
NYSE
Coca Cola Femsa Sab Ads
Beverages - Non-Alcoholic
|
$97.05
|
+0.38
0.39% |
$98.87
|
332,075
206.00% of 50 DAV
50 DAV is 161,200
|
$104.38
-7.02%
|
1/12/2024
|
$93.38
|
PP = $99.34
|
|
MB = $104.31
|
Most Recent Note - 2/29/2024 12:49:31 PM
Y - Its 50 DMA line ($95.17) defines important near-term support to watch while still sputtering after a noted "negative reversal" on 2/20/24 at its all-time high. Reported Dec '23 quarterly earnings -13% on +24% sales revenues versus the year-ago period, raising fundamental concerns.
>>> FEATURED STOCK ARTICLE : Perched at High With Earnings News Due - 2/21/2024 |
View all notes |
Set NEW NOTE alert |
Company Profile |
SEC
News |
Chart |
Request a new note
C
A
S
I |
PCAR
-
NASDAQ
Paccar
Trucks and Parts-Hvy Duty
|
$110.89
|
-0.48
-0.43% |
$111.71
|
3,659,748
167.96% of 50 DAV
50 DAV is 2,179,000
|
$112.68
-1.59%
|
1/23/2024
|
$100.35
|
PP = $98.57
|
|
MB = $103.50
|
Most Recent Note - 2/26/2024 5:06:25 PM
G - Hit another new all-time high with today's 4th consecutive gain backed by below-average volume, getting more extended from any sound base. Its 50 DMA line ($100) defines near-term support to watch on pullbacks. Fundamentals remain strong. See the latest FSU analysis for more details and a new annotated graph.
>>> FEATURED STOCK ARTICLE : Extended From Any Sound Base After 7 Weekly Gains - 2/26/2024 |
View all notes |
Set NEW NOTE alert |
Company Profile |
SEC
News |
Chart |
Request a new note
C
A
S
I |
Symbol/Exchange
Company Name
Industry Group |
PRICE |
CHANGE
(%Change) |
Day High |
Volume
(% DAV)
(% 50 day avg vol) |
52 Wk Hi
% From Hi |
Featured
Date |
Price
Featured |
Pivot Featured |
|
Max Buy |
HUBB
-
NYSE
Hubbell
Electrical-Power/Equipmt
|
$380.67
|
+9.85
2.66% |
$382.58
|
955,052
248.71% of 50 DAV
50 DAV is 384,000
|
$372.59
2.17%
|
1/30/2024
|
$343.26
|
PP = $336.83
|
|
MB = $353.67
|
Most Recent Note - 2/28/2024 4:56:23 PM
G - Posted a small gain with average volume for another new all-time high, getting more extended from the previously noted base. Prior high ($340) and its 50 DMA line define important support to watch on pullbacks. See the latest FSU analysis for more details and a new annotated graph.
>>> FEATURED STOCK ARTICLE : Inched to New Highs With Average Volume - 2/28/2024 |
View all notes |
Set NEW NOTE alert |
Company Profile |
SEC
News |
Chart |
Request a new note
C
A
S
I |
MANH
-
NASDAQ
Manhattan Associates
Computer Sftwr-Enterprse
|
$253.33
|
-0.68
-0.27% |
$257.30
|
659,731
174.53% of 50 DAV
50 DAV is 378,000
|
$258.91
-2.16%
|
1/31/2024
|
$240.57
|
PP = $230.71
|
|
MB = $242.25
|
Most Recent Note - 2/27/2024 11:27:26 AM
G - Perched near its all-time high with light volume behind today's 4th consecutive small gain. Prior highs in the $230 area define near-term support to watch on pullbacks.
>>> FEATURED STOCK ARTICLE : Hovering Near All-Time High After Streak of Small Gains - 2/29/2024 |
View all notes |
Set NEW NOTE alert |
Company Profile |
SEC
News |
Chart |
Request a new note
C
A
S
I |
TENB
-
NASDAQ
Tenable Holdings
Computer Sftwr-Security
|
$48.10
|
+0.89
1.89% |
$48.47
|
1,160,287
113.28% of 50 DAV
50 DAV is 1,024,300
|
$53.50
-10.09%
|
2/7/2024
|
$49.50
|
PP = $49.87
|
|
MB = $52.36
|
Most Recent Note - 2/27/2024 11:32:02 AM
G - Its Relative Strength rating has slumped to 71, well below the 80+ minimum guideline for buy candidates. Finding support recently above the 50 DMA line ($47.14). Fundamentals remain strong.
>>> FEATURED STOCK ARTICLE : Gap Up Gain Followed Latest Earnings Report - 2/7/2024 |
View all notes |
Set NEW NOTE alert |
Company Profile |
SEC
News |
Chart |
Request a new note
C
A
S
I |
USLM
-
NASDAQ
U.S. Lime & Minerals
Bldg-Cement/Concrt/Ag
|
$253.05
|
-0.45
-0.18% |
$258.40
|
8,535
47.42% of 50 DAV
50 DAV is 18,000
|
$266.88
-5.18%
|
2/9/2024
|
$254.68
|
PP = $265.09
|
|
MB = $278.34
|
Most Recent Note - 2/27/2024 11:28:38 AM
Y - Perched near its all-time high with volume totals cooling. Subsequent gains and a close above the pivot point backed by at least +40% above average volume may trigger a conviciing new technical buy signal. Through Dec '23 its quarterly and annual earnings (C and A criteria) history has been strong, a good match with the fact-based investment system's guidelines. Thinly traded firm has only 5.7 million shares outstanding (S criteria), which can contribute to greater price volatility in the event of institutional buying or selling.
>>> FEATURED STOCK ARTICLE : Strong Finish for Thinly Traded U.S Lime & Minerals - 2/9/2024 |
View all notes |
Set NEW NOTE alert |
Company Profile |
SEC
News |
Chart |
Request a new note
C
A
S
I |
NOW
-
NYSE
ServiceNow
Computer Sftwr-Enterprse
|
$771.34
|
+11.55
1.52% |
$773.32
|
1,485,678
126.98% of 50 DAV
50 DAV is 1,170,000
|
$815.32
-5.39%
|
2/22/2024
|
$771.75
|
PP = $815.32
|
|
MB = $856.09
|
Most Recent Note - 2/29/2024 12:50:59 PM
Y - Still consolidating above its 50 DMA line. A valid secondary buy point exists up to +5% above the latest high after finding support at its 10 WMA line following an earlier breakout. Fundamentals remain strong.
>>> FEATURED STOCK ARTICLE : Found Support With a Solid Gap Up from 10-Week Moving Average - 2/23/2024 |
View all notes |
Set NEW NOTE alert |
Company Profile |
SEC
News |
Chart |
Request a new note
C
A
S
I |
Symbol/Exchange
Company Name
Industry Group |
PRICE |
CHANGE
(%Change) |
Day High |
Volume
(% DAV)
(% 50 day avg vol) |
52 Wk Hi
% From Hi |
Featured
Date |
Price
Featured |
Pivot Featured |
|
Max Buy |
SNPS
-
NASDAQ
Synopsys
Computer Sftwr-Design
|
$572.94
|
+2.66
0.47% |
$579.44
|
993,664
68.53% of 50 DAV
50 DAV is 1,450,000
|
$629.38
-8.97%
|
2/22/2024
|
$600.65
|
PP = $582.85
|
|
MB = $611.99
|
Most Recent Note - 2/29/2024 12:47:29 PM
Y - Volume totals have been cooling while hovering near its all-time high. Encountered distributional pressure after a gap up on 2/22/24 and ended near the session low, closing below the pivot point cited based on its 2/09/24 high after a cup-with-handle base. A strong close above the pivot point is needed to clinch a proper technical buy signal. Found support recently at its 50 DMA line ($536). Reported Jan '24 quarterly earnings +36% on +21% sales revenues versus the year-ago period, its 3rd strong quarter above the +25% minimum earnings guideline (C criteria). Annual earnings growth (A criteria) has been strong and steady.
>>> FEATURED STOCK ARTICLE : Gapped Up for New High But Ended Near Session Low - 2/22/2024 |
View all notes |
Set NEW NOTE alert |
Company Profile |
SEC
News |
Chart |
Request a new note
C
A
S
I |
|
|
|
THESE ARE NOT BUY RECOMMENDATIONS!
Comments contained in the body of this report are technical
opinions only. The material herein has been obtained
from sources believed to be reliable and accurate, however,
its accuracy and completeness cannot be guaranteed.
This site is not an investment advisor, hence it does
not endorse or recommend any securities or other investments.
Any recommendation contained in this report may not
be suitable for all investors and it is not to be deemed
an offer or solicitation on our part with respect to
the purchase or sale of any securities. All trademarks,
service marks and trade names appearing in this report
are the property of their respective owners, and are
likewise used for identification purposes only.
This report is a service available
only to active Paid Premium Members.
You may opt-out of receiving report notifications
at any time. Questions or comments may be submitted
by writing to Premium Membership Services 665 S.E. 10 Street, Suite 201 Deerfield Beach, FL 33441-5634 or by calling 1-800-965-8307
or 954-785-1121.
|
|
|