You are not logged in.
This means you
CAN ONLY VIEW reports that were published prior to Thursday, March 20, 2025.
You
MUST UPGRADE YOUR MEMBERSHIP if you want to see any current reports.
AFTER MARKET UPDATE - FRIDAY, MARCH 1ST, 2024
Previous After Market Report Next After Market Report >>>
|
|
|
|
DOW |
+90.99 |
39,087.38 |
+0.23% |
|
Volume |
1,039,650,461 |
-41% |
|
Volume |
5,472,286,500 |
-15% |
|
NASDAQ |
+183.02 |
16,274.94 |
+1.14% |
|
Advancers |
1,716 |
62% |
|
Advancers |
2,622 |
62% |
|
S&P 500 |
+40.81 |
5,137.08 |
+0.80% |
|
Decliners |
1,034 |
38% |
|
Decliners |
1,639 |
38% |
|
Russell 2000 |
+21.55 |
2,076.39 |
+1.05% |
|
52 Wk Highs |
252 |
|
|
52 Wk Highs |
372 |
|
|
S&P 600 |
+6.01 |
1,311.08 |
+0.46% |
|
52 Wk Lows |
24 |
|
|
52 Wk Lows |
91 |
|
|
 |
Major Indices Rose With Widespread Leadership
Kenneth J. Gruneisen - Passed the CAN SLIM® Master's Exam
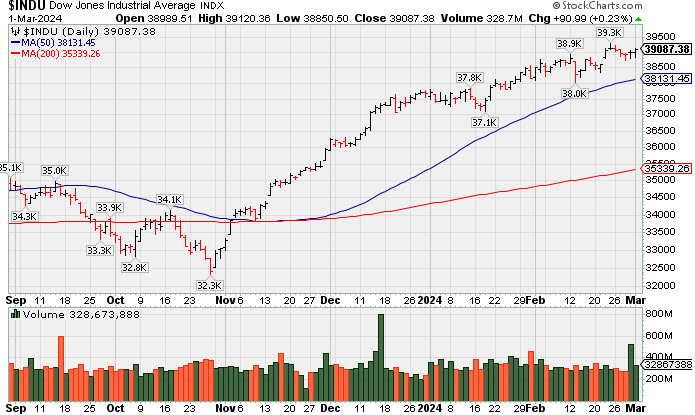
The S&P 500 (+0.8%) and Nasdaq Composite (+1.1%) rose to fresh record closing highs. Volume was reported lighter than the prior session total on the NYSE and on the Nasdaq exchange. Advancers led decliners by more than a 3-2 margin on the NYSE and by a 5-3 margin on the Nasdaq exchange. There were 124 high-ranked companies from the Leaders List that hit new 52-week highs and were listed on the BreakOuts Page, versus the total of 117 on the prior session. New 52-week highs totals expanded and solidly outnumbered new 52-week lows totals on the NYSE and on the Nasdaq exchange. The major indices are in a confirmed uptrend (M criteria). New buying efforts should be only made in stocks fitting all key criteria of the fact-based investment system.
PICTURED: The Dow Jones Industrial Average is consolidating near its all-time high.
The 10-yr note yield settled at 4.18%, seven basis points lower. The 2-yr note yield slid 11 basis points to 4.53%. The February ISM Manufacturing Index showed the contraction in manufacturing activity accelerating and pricing pressures moderating. Other data included a weaker than expected Construction Spending report for January.
Eight of the 11 S&P 500 sectors ended higher. The information technology sector posted a +1.8% gain. NVIDIA (NVDA +4.00%) was a winning standout as it closed above a $2 trillion market cap for the first time. The energy sector (+1.2%) was another top gainer, rising alongside WTI crude oil futures, which settled +2.2% higher at $79.97/bbl. The utilities (-0.7%), financials (-0.2%), and consumer staples (-0.04%) sectors were each lower the close. The underperformance of the financial sector was related to weakness in regional bank shares after New York Community Bancorp (NYCB -25.99%) acknowledged last night that it has identified material weaknesses in the company's internal controls related to internal loan review.
|
 Kenneth J. Gruneisen started out as a licensed stockbroker in August 1987, a couple of months prior to the historic stock market crash that took the Dow Jones Industrial Average down -22.6% in a single day. He has published daily fact-based fundamental and technical analysis on high-ranked stocks online for two decades. Through FACTBASEDINVESTING.COM, Kenneth provides educational articles, news, market commentary, and other information regarding proven investment systems that work in good times and bad.
Comments contained in the body of this report are technical opinions only and are not necessarily those of Gruneisen Growth Corp. The material herein has been obtained from sources believed to be reliable and accurate, however, its accuracy and completeness cannot be guaranteed. Our firm, employees, and customers may effect transactions, including transactions contrary to any recommendation herein, or have positions in the securities mentioned herein or options with respect thereto. Any recommendation contained in this report may not be suitable for all investors and it is not to be deemed an offer or solicitation on our part with respect to the purchase or sale of any securities. |
|
 |
Tech, Retail, and Commodity-Linked Groups Rose
Kenneth J. Gruneisen - Passed the CAN SLIM® Master's Exam
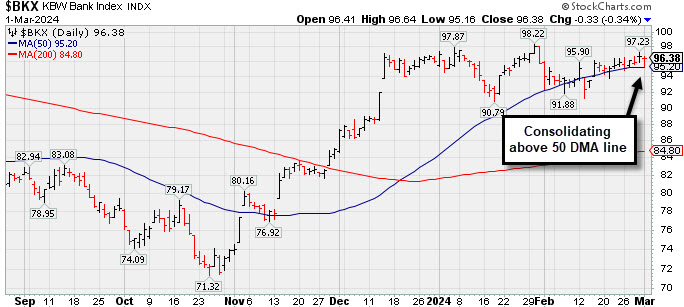
The Retail Index ($RLX +0.73%) and the Broker/Dealer Index ($XBD +0.75%) both posted gains while the Bank Index ($BKX -0.34%) ended slightly lower on Friday. The tech sector had a clearly positive bias as the Semiconductor Index ($SOX +4.29%) outpaced the Networking Index ($NWX +1.89%) and the Biotech Index ($BTK +2.41%). The Gold & Silver Index ($XAU +3.11%), Oil Services Index ($OSX +2.72%) and the Integrated Oil Index ($XOI +1.47%) posted unanimous gains.
![]() PICTURED: The Bank Index ($BKX -0.34%) ended slightly lower, consolidating above its 50-day moving average (DMA) line.
| Oil Services |
$OSX |
82.12 |
+2.18 |
+2.72% |
-2.09% |
| Integrated Oil |
$XOI |
1,968.63 |
+28.54 |
+1.47% |
+5.70% |
| Semiconductor |
$SOX |
4,929.58 |
+202.66 |
+4.29% |
+18.06% |
| Networking |
$NWX |
818.85 |
+15.35 |
+1.91% |
-1.68% |
| Broker/Dealer |
$XBD |
577.16 |
+4.38 |
+0.77% |
+3.56% |
| Retail |
$RLX |
4,446.27 |
+32.41 |
+0.73% |
+14.34% |
| Gold & Silver |
$XAU |
108.65 |
+3.28 |
+3.11% |
-13.56% |
| Bank |
$BKX |
96.38 |
-0.33 |
-0.34% |
+0.37% |
| Biotech |
$BTK |
5,313.63 |
+126.69 |
+2.44% |
-1.94% |
|
|
|
 |
Best Ever Close for Arista Networks
Kenneth J. Gruneisen - Passed the CAN SLIM® Master's Exam
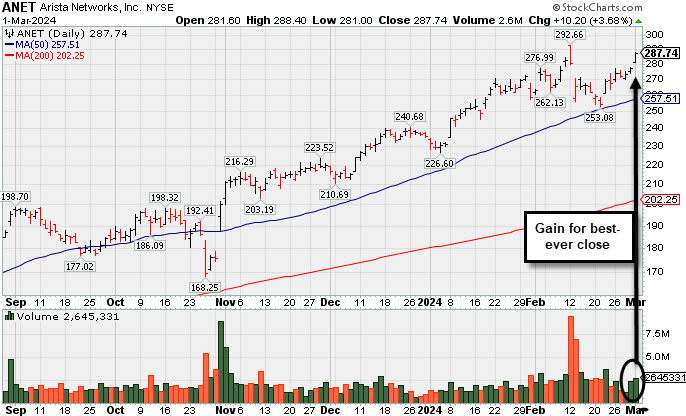
Arista Networks Inc (ANET +$10.20 or +3.68% to $287.74) posted a gain with +23% above average volume today for a best-ever close near its all-time high, very extended from any sound base. Its 50-day moving average (DMA) line ($257.51) defines important near-term support to watch on pullbacks.
ANET finished strong after it was highlighted in yellow and new pivot point cited is based on its prior high plus 10 cents in the 10/31/23 mid-day report (read here). It was last covered in detail in this FSU section on 2/01/24 with an annotated graph under the headline, "Pulled Back From All Time High With Gap Down on Prior Session".
Fundamentals remain strong. ANET currently has a 98 Earnings Per Share Rating. Through the Dec '23 quarter it has shown 8 consecutive quarterly comparisons with strong and steady earnings increases above the +25% minimum guideline (C criteria). Annual earnings (A criteria) had a downturn in FY '20 like many companies during the pandemic.
The number of top-rated funds owning its shares rose from 1,758 in Dec '21 to 2,496 in Dec '23, a reassuring sign concerning the I criteria. Its current Up/Down Volume Ratio of 1.2 is an unbiased indication its shares have been under slight accumulation over the past 50 days. The high-ranked Computer - Networking firm has a Timeliness Rating of A and a Sponsorship Rating of C. Its small supply of 253.2 million shares (S criteria) in the public float may contribute to greater volatility in the event of institutional buying or selling.
|
|
|
Color Codes Explained :
Y - Better candidates highlighted by our
staff of experts.
G - Previously featured
in past reports as yellow but may no longer be buyable under the
guidelines.
***Last / Change / Volume data in this table is the closing quote data***
Symbol/Exchange
Company Name
Industry Group |
PRICE |
CHANGE
(%Change) |
Day High |
Volume
(% DAV)
(% 50 day avg vol) |
52 Wk Hi
% From Hi |
Featured
Date |
Price
Featured |
Pivot Featured |
|
Max Buy |
 ANET
-
NYSE
ANET
-
NYSE
Arista Networks
Computer-Networking
|
$287.74
|
+10.20
3.68% |
$288.40
|
2,645,326
122.41% of 50 DAV
50 DAV is 2,161,000
|
$292.66
-1.68%
|
10/31/2023
|
$188.84
|
PP = $198.80
|
|
MB = $208.74
|
 Most Recent Note - 3/1/2024 4:51:52 PM
G - Posted a gain with +23% above average volume for a best-ever close, very extended from any sound base. Its 50 DMA line ($257.51) defines important near-term support to watch on pullbacks. See the latest FSU analysis for more details and a new annotated graph.
>>> FEATURED STOCK ARTICLE : Best Ever Close for Arista Networks - 3/1/2024 |
View all notes |
Set NEW NOTE alert |
Company Profile |
SEC
News |
Chart |
Request a new note
C
A
S
I |
NVO
-
NYSE
Novo Nordisk ADR
Medical-Ethical Drugs
|
$124.23
|
+4.46
3.72% |
$124.43
|
5,429,616
118.04% of 50 DAV
50 DAV is 4,600,000
|
$124.87
-0.51%
|
3/1/2024
|
$124.23
|
PP = $124.97
|
|
MB = $131.22
|
Most Recent Note - 3/1/2024 4:55:59 PM
Y - Gapped up today and posted a solid gain rising near its all-time high. Color code is changed to yellow after forming an advanced "3-weeks tight" base. Its 50 DMA line ($112) defines important near-term support to watch on pullbacks.
>>> FEATURED STOCK ARTICLE : Extended From Any Sound Base After Volume-Driven Gains - 2/8/2024 |
View all notes |
Set NEW NOTE alert |
Company Profile |
SEC
News |
Chart |
Request a new note
C
A
S
I |
AXON
-
NASDAQ
Axon Enterprise
Security/Sfty
|
$314.25
|
+6.88
2.24% |
$314.49
|
886,817
205.76% of 50 DAV
50 DAV is 431,000
|
$318.90
-1.46%
|
11/8/2023
|
$127.84
|
PP = $223.30
|
|
MB = $234.47
|
Most Recent Note - 3/1/2024 12:21:05 PM
G - Very extended from any sound base after hitting a new all-time high with a big volume-driven gain on 2/28/24. Bullish action came after it reported Dec '23 quarterly earnings +60% on +29% sales revenues versus the year-ago period. Volume and volatility often increase near earnings news. Prior highs in the $260-262 area define initial support to watch along with its 50-day moving average (DMA) line ($261).
>>> FEATURED STOCK ARTICLE : Reversal at All-Time High After 7 Consecutive Gains - 2/12/2024 |
View all notes |
Set NEW NOTE alert |
Company Profile |
SEC
News |
Chart |
Request a new note
C
A
S
I |
TDG
-
NYSE
TransDigm Group
Aerospace/Defense
|
$1,183.27
|
+5.53
0.47% |
$1,188.00
|
195,768
93.22% of 50 DAV
50 DAV is 210,000
|
$1,207.58
-2.01%
|
12/12/2023
|
$1,000.39
|
PP = $1,013.18
|
|
MB = $1,063.84
|
Most Recent Note - 2/27/2024 11:30:31 AM
G - Pulling back today with below-average volume for a 2nd loss off of its all-time high. Its 50 DMA line ($1,068) defines near-term support to watch.
>>> FEATURED STOCK ARTICLE : Transdigm Perched Near All-Time High - 2/14/2024 |
View all notes |
Set NEW NOTE alert |
Company Profile |
SEC
News |
Chart |
Request a new note
C
A
S
I |
TBBK
-
NASDAQ
The Bancorp
Banks-Northeast
|
$44.11
|
-0.53
-1.19% |
$44.52
|
286,559
67.90% of 50 DAV
50 DAV is 422,000
|
$47.11
-6.37%
|
1/22/2024
|
$40.87
|
PP = $42.56
|
|
MB = $44.69
|
Most Recent Note - 2/27/2024 6:19:45 PM
G - Color code was changed to green after wedging above its "max buy" level with today's 3rd consecutive gain backed by below-average volume. Prior highs in the $42 area and its 50 DMA line ($41.28) define near-term support to watch. Fundamentals remain strong. See the latest FSU analysis for more details and a new annotated graph.
>>> FEATURED STOCK ARTICLE : Wedging Above "Max Buy" Level With Gains Lacking Great Volume - 2/27/2024 |
View all notes |
Set NEW NOTE alert |
Company Profile |
SEC
News |
Chart |
Request a new note
C
A
S
I |
Symbol/Exchange
Company Name
Industry Group |
PRICE |
CHANGE
(%Change) |
Day High |
Volume
(% DAV)
(% 50 day avg vol) |
52 Wk Hi
% From Hi |
Featured
Date |
Price
Featured |
Pivot Featured |
|
Max Buy |
LULU
-
NASDAQ
lululemon athletica
Retail-Apparel/Shoes/Acc
|
$458.36
|
-8.73
-1.87% |
$464.57
|
1,288,940
109.23% of 50 DAV
50 DAV is 1,180,000
|
$516.39
-11.24%
|
12/8/2023
|
$490.61
|
PP = $485.93
|
|
MB = $510.23
|
Most Recent Note - 2/29/2024 12:45:41 PM
G - Volume totals have been cooling while still lingering below its 50 DMA line ($478) which is now downward sloping and may act as resistance. A rebound above the 50 DMA line is needed to help its outlook improve.
>>> FEATURED STOCK ARTICLE : Violation of 50-Day Moving Average Hurt Outlook - 2/2/2024 |
View all notes |
Set NEW NOTE alert |
Company Profile |
SEC
News |
Chart |
Request a new note
C
A
S
I |
CRWD
-
NASDAQ
CrowdStrike Holdings
Computer Sftwr-Security
|
$314.41
|
-9.74
-3.00% |
$319.72
|
5,796,740
182.52% of 50 DAV
50 DAV is 3,176,000
|
$338.45
-7.10%
|
1/2/2024
|
$246.42
|
PP = $261.91
|
|
MB = $275.01
|
Most Recent Note - 3/1/2024 12:25:18 PM
G - Perched within striking distance of its all-time high, showing resilience after testing support near its 50 DMA line ($292) last week. Fundamentals remain strong.
>>> FEATURED STOCK ARTICLE : Volume Totals Cooking While Stubbornly Perched at All-Time High - 2/6/2024 |
View all notes |
Set NEW NOTE alert |
Company Profile |
SEC
News |
Chart |
Request a new note
C
A
S
I |
ELF
-
NYSE
e.l.f. Beauty
Cosmetics/Personal Care
|
$217.40
|
+8.87
4.25% |
$217.71
|
1,304,073
89.50% of 50 DAV
50 DAV is 1,457,000
|
$209.97
3.54%
|
1/2/2024
|
$138.23
|
PP = $153.63
|
|
MB = $161.31
|
Most Recent Note - 3/1/2024 4:53:14 PM
G - Posted an 8th consecutive gain today for yet another new all-time high. Reported Dec '23 quarterly earnings +54% on +85% sales revenues versus the year-ago period, continuing its strong earnings track record. Its 50 DMA line ($163.47) defines important near-term support to watch.
>>> FEATURED STOCK ARTICLE : Peched at All-Time High With Earnings News Due - 2/5/2024 |
View all notes |
Set NEW NOTE alert |
Company Profile |
SEC
News |
Chart |
Request a new note
C
A
S
I |
KOF
-
NYSE
Coca Cola Femsa Sab Ads
Beverages - Non-Alcoholic
|
$96.96
|
-0.09
-0.09% |
$97.98
|
131,723
80.91% of 50 DAV
50 DAV is 162,800
|
$104.38
-7.11%
|
1/12/2024
|
$93.38
|
PP = $99.34
|
|
MB = $104.31
|
Most Recent Note - 2/29/2024 12:49:31 PM
Y - Its 50 DMA line ($95.17) defines important near-term support to watch while still sputtering after a noted "negative reversal" on 2/20/24 at its all-time high. Reported Dec '23 quarterly earnings -13% on +24% sales revenues versus the year-ago period, raising fundamental concerns.
>>> FEATURED STOCK ARTICLE : Perched at High With Earnings News Due - 2/21/2024 |
View all notes |
Set NEW NOTE alert |
Company Profile |
SEC
News |
Chart |
Request a new note
C
A
S
I |
PCAR
-
NASDAQ
Paccar
Trucks and Parts-Hvy Duty
|
$113.19
|
+2.30
2.07% |
$113.35
|
2,189,197
102.88% of 50 DAV
50 DAV is 2,128,000
|
$112.68
0.45%
|
1/23/2024
|
$100.35
|
PP = $98.57
|
|
MB = $103.50
|
Most Recent Note - 3/1/2024 4:56:57 PM
G - Hit another new all-time high with today's gain backed by average volume, getting more extended from any sound base. Its 50 DMA line ($101.55) defines near-term support to watch on pullbacks. Fundamentals remain strong.
>>> FEATURED STOCK ARTICLE : Extended From Any Sound Base After 7 Weekly Gains - 2/26/2024 |
View all notes |
Set NEW NOTE alert |
Company Profile |
SEC
News |
Chart |
Request a new note
C
A
S
I |
Symbol/Exchange
Company Name
Industry Group |
PRICE |
CHANGE
(%Change) |
Day High |
Volume
(% DAV)
(% 50 day avg vol) |
52 Wk Hi
% From Hi |
Featured
Date |
Price
Featured |
Pivot Featured |
|
Max Buy |
HUBB
-
NYSE
Hubbell
Electrical-Power/Equipmt
|
$384.77
|
+4.10
1.08% |
$385.35
|
395,900
101.77% of 50 DAV
50 DAV is 389,000
|
$382.58
0.57%
|
1/30/2024
|
$343.26
|
PP = $336.83
|
|
MB = $353.67
|
Most Recent Note - 2/28/2024 4:56:23 PM
G - Posted a small gain with average volume for another new all-time high, getting more extended from the previously noted base. Prior high ($340) and its 50 DMA line define important support to watch on pullbacks. See the latest FSU analysis for more details and a new annotated graph.
>>> FEATURED STOCK ARTICLE : Inched to New Highs With Average Volume - 2/28/2024 |
View all notes |
Set NEW NOTE alert |
Company Profile |
SEC
News |
Chart |
Request a new note
C
A
S
I |
MANH
-
NASDAQ
Manhattan Associates
Computer Sftwr-Enterprse
|
$256.75
|
+3.42
1.35% |
$256.77
|
271,116
75.73% of 50 DAV
50 DAV is 358,000
|
$258.91
-0.83%
|
1/31/2024
|
$240.57
|
PP = $230.71
|
|
MB = $242.25
|
Most Recent Note - 2/27/2024 11:27:26 AM
G - Perched near its all-time high with light volume behind today's 4th consecutive small gain. Prior highs in the $230 area define near-term support to watch on pullbacks.
>>> FEATURED STOCK ARTICLE : Hovering Near All-Time High After Streak of Small Gains - 2/29/2024 |
View all notes |
Set NEW NOTE alert |
Company Profile |
SEC
News |
Chart |
Request a new note
C
A
S
I |
TENB
-
NASDAQ
Tenable Holdings
Computer Sftwr-Security
|
$48.10
|
-0.06
-0.12% |
$48.41
|
777,816
78.88% of 50 DAV
50 DAV is 986,100
|
$53.50
-10.09%
|
2/7/2024
|
$49.50
|
PP = $49.87
|
|
MB = $52.36
|
Most Recent Note - 2/27/2024 11:32:02 AM
G - Its Relative Strength rating has slumped to 71, well below the 80+ minimum guideline for buy candidates. Finding support recently above the 50 DMA line ($47.14). Fundamentals remain strong.
>>> FEATURED STOCK ARTICLE : Gap Up Gain Followed Latest Earnings Report - 2/7/2024 |
View all notes |
Set NEW NOTE alert |
Company Profile |
SEC
News |
Chart |
Request a new note
C
A
S
I |
USLM
-
NASDAQ
U.S. Lime & Minerals
Bldg-Cement/Concrt/Ag
|
$253.89
|
-1.09
-0.43% |
$258.87
|
11,698
64.99% of 50 DAV
50 DAV is 18,000
|
$266.88
-4.87%
|
2/9/2024
|
$254.68
|
PP = $265.09
|
|
MB = $278.34
|
Most Recent Note - 2/27/2024 11:28:38 AM
Y - Perched near its all-time high with volume totals cooling. Subsequent gains and a close above the pivot point backed by at least +40% above average volume may trigger a conviciing new technical buy signal. Through Dec '23 its quarterly and annual earnings (C and A criteria) history has been strong, a good match with the fact-based investment system's guidelines. Thinly traded firm has only 5.7 million shares outstanding (S criteria), which can contribute to greater price volatility in the event of institutional buying or selling.
>>> FEATURED STOCK ARTICLE : Strong Finish for Thinly Traded U.S Lime & Minerals - 2/9/2024 |
View all notes |
Set NEW NOTE alert |
Company Profile |
SEC
News |
Chart |
Request a new note
C
A
S
I |
NOW
-
NYSE
ServiceNow
Computer Sftwr-Enterprse
|
$773.63
|
+2.29
0.30% |
$778.30
|
877,818
75.94% of 50 DAV
50 DAV is 1,156,000
|
$815.32
-5.11%
|
2/22/2024
|
$771.75
|
PP = $815.32
|
|
MB = $856.09
|
Most Recent Note - 2/29/2024 12:50:59 PM
Y - Still consolidating above its 50 DMA line. A valid secondary buy point exists up to +5% above the latest high after finding support at its 10 WMA line following an earlier breakout. Fundamentals remain strong.
>>> FEATURED STOCK ARTICLE : Found Support With a Solid Gap Up from 10-Week Moving Average - 2/23/2024 |
View all notes |
Set NEW NOTE alert |
Company Profile |
SEC
News |
Chart |
Request a new note
C
A
S
I |
Symbol/Exchange
Company Name
Industry Group |
PRICE |
CHANGE
(%Change) |
Day High |
Volume
(% DAV)
(% 50 day avg vol) |
52 Wk Hi
% From Hi |
Featured
Date |
Price
Featured |
Pivot Featured |
|
Max Buy |
SNPS
-
NASDAQ
Synopsys
Computer Sftwr-Design
|
$591.35
|
+17.62
3.07% |
$592.90
|
954,562
67.18% of 50 DAV
50 DAV is 1,421,000
|
$629.38
-6.04%
|
2/22/2024
|
$600.65
|
PP = $582.85
|
|
MB = $611.99
|
Most Recent Note - 3/1/2024 4:58:45 PM
Y - Posted a gain today with below-average volume for a best-ever close. A strong volume-driven gain and close above the pivot point is needed to clinch a proper technical buy signal. Found support recently at its 50 DMA line ($538). Reported Jan '24 quarterly earnings +36% on +21% sales revenues versus the year-ago period, its 3rd strong quarter above the +25% minimum earnings guideline (C criteria). Annual earnings growth (A criteria) has been strong and steady.
>>> FEATURED STOCK ARTICLE : Gapped Up for New High But Ended Near Session Low - 2/22/2024 |
View all notes |
Set NEW NOTE alert |
Company Profile |
SEC
News |
Chart |
Request a new note
C
A
S
I |
|
|
|
THESE ARE NOT BUY RECOMMENDATIONS!
Comments contained in the body of this report are technical
opinions only. The material herein has been obtained
from sources believed to be reliable and accurate, however,
its accuracy and completeness cannot be guaranteed.
This site is not an investment advisor, hence it does
not endorse or recommend any securities or other investments.
Any recommendation contained in this report may not
be suitable for all investors and it is not to be deemed
an offer or solicitation on our part with respect to
the purchase or sale of any securities. All trademarks,
service marks and trade names appearing in this report
are the property of their respective owners, and are
likewise used for identification purposes only.
This report is a service available
only to active Paid Premium Members.
You may opt-out of receiving report notifications
at any time. Questions or comments may be submitted
by writing to Premium Membership Services 665 S.E. 10 Street, Suite 201 Deerfield Beach, FL 33441-5634 or by calling 1-800-965-8307
or 954-785-1121.
|
|
|