You are not logged in.
This means you
CAN ONLY VIEW reports that were published prior to Tuesday, March 25, 2025.
You
MUST UPGRADE YOUR MEMBERSHIP if you want to see any current reports.
AFTER MARKET UPDATE - TUESDAY, JANUARY 2ND, 2024
Previous After Market Report Next After Market Report >>>
|
|
|
|
DOW |
+25.50 |
37,715.04 |
+0.07% |
|
Volume |
921,279,951 |
+6% |
|
Volume |
5,855,687,400 |
+6% |
|
NASDAQ |
-245.41 |
14,765.94 |
-1.63% |
|
Advancers |
1,313 |
47% |
|
Advancers |
1,891 |
44% |
|
S&P 500 |
-27.00 |
4,742.83 |
-0.57% |
|
Decliners |
1,478 |
53% |
|
Decliners |
2,416 |
56% |
|
Russell 2000 |
-14.28 |
2,012.80 |
-0.70% |
|
52 Wk Highs |
44 |
|
|
52 Wk Highs |
106 |
|
|
S&P 600 |
-7.42 |
1,310.84 |
-0.56% |
|
52 Wk Lows |
10 |
|
|
52 Wk Lows |
64 |
|
|
 |
Indices Were Mixed With Nasdaq Composite Leading Retreat
Kenneth J. Gruneisen - Passed the CAN SLIM® Master's Exam
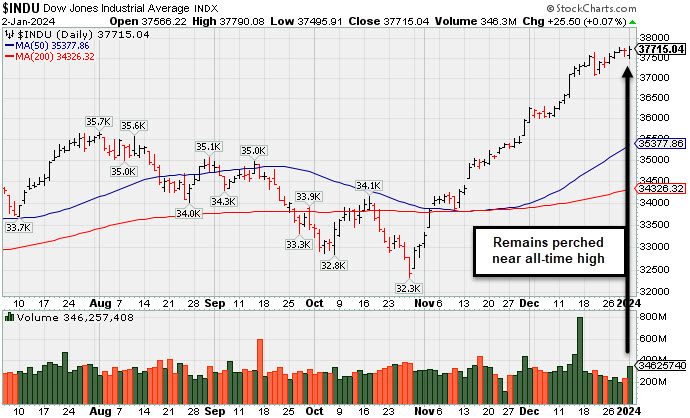
The market-cap weighted S&P 500 fell -0.6% while the Invesco S&P 500 Equal Weight ETF (RSP) closed just above Friday's closing level. The Dow Jones Industrial Average eked out a small gain while the Nasdaq Composite Index was a standout decliner falling -1.65%. Volume was reported higher than the prior session totals on the NYSE and on the Nasdaq exchange. Decliners led advancers by a narrow margin on the NYSE and by about a 4-3 margin on the Nasdaq exchange. There were only 14 high-ranked companies from the Leaders List that hit new 52-week highs and were listed on the BreakOuts Page, versus the total of 38 on the prior session. New 52-week highs totals still outnumbered new 52-week lows totals on the NYSE and on the Nasdaq exchange. The major indices are in a confirmed uptrend (M criteria). New buying efforts should be only made in stocks fitting all key criteria of the fact-based investment system.
PICTURED: The Dow Jones Industrial Average is perched near its all-time high. Apple (AAPL -3.58%) was an influential loser following a Barclays analyst downgrade. That and other profit-taking activity in the mega cap stocks weighed over the broader market following nine-straight weeks of gains to close out 2023. The only three S&P 500 sectors to register declines in 2023 saw some of the largest gains to start 2024. The utilities sector, which fell -10.2% last year managed a +1.4% gain. The energy sector, which declined -4.8% in 2023, climbed +1.2%. The consumer staples sector, which fell -2.2% last year, closed with a +1.2% gain. The health care sector was another top performer with a +1.8% gain versus last year's +0.3% gain.
Information technology (-2.6%), consumer discretionary (-0.9%), communication services (-0.9%) sectors, and the industrial sector (-1.0%) was another decliner.
The 2-yr note yield rose eight basis points to 4.33% and the 10-yr note yield rose seven basis points to 3.95%.
|
 Kenneth J. Gruneisen started out as a licensed stockbroker in August 1987, a couple of months prior to the historic stock market crash that took the Dow Jones Industrial Average down -22.6% in a single day. He has published daily fact-based fundamental and technical analysis on high-ranked stocks online for two decades. Through FACTBASEDINVESTING.COM, Kenneth provides educational articles, news, market commentary, and other information regarding proven investment systems that work in good times and bad.
Comments contained in the body of this report are technical opinions only and are not necessarily those of Gruneisen Growth Corp. The material herein has been obtained from sources believed to be reliable and accurate, however, its accuracy and completeness cannot be guaranteed. Our firm, employees, and customers may effect transactions, including transactions contrary to any recommendation herein, or have positions in the securities mentioned herein or options with respect thereto. Any recommendation contained in this report may not be suitable for all investors and it is not to be deemed an offer or solicitation on our part with respect to the purchase or sale of any securities. |
|
 |
Semiconductor Index Led Group Decliners
Kenneth J. Gruneisen - Passed the CAN SLIM® Master's Exam
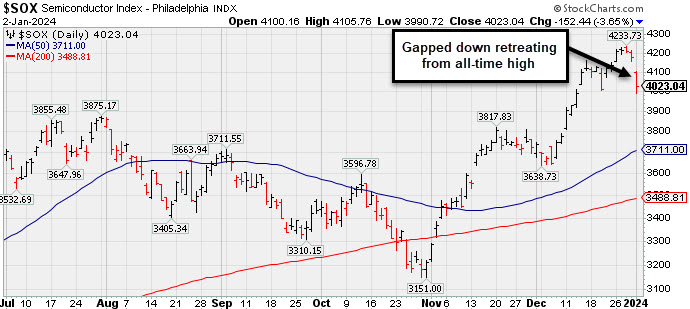
The Bank Index ($BKX +0.94%) rose while the Broker/Dealer Index ($XBD -0.63%) and the Retail Index ($RLX -1.05%) bothj finished with losses. The Semiconductor Index ($SOX -3.65%) led the tech sector lower while the Networking Index ($NWX -0.81%) posted a smaller loss, meanwhile the Biotech Index ($BTK +1.43%) posted a gain. The Gold & Silver Index ($XAU -1.68%) and the Oil Services Index ($OSX -0.49%) each lost ground while the Integrated Oil Index ($XOI +0.90%) posted a small gain.
PICTURED: The Semiconductor Index ($SOX -3.65%) gapped down retreating from its all-time high.
| Oil Services |
$OSX |
83.46 |
-0.42 |
-0.49% |
-0.50% |
| Integrated Oil |
$XOI |
1,879.21 |
+16.74 |
+0.90% |
+0.90% |
| Semiconductor |
$SOX |
4,023.04 |
-152.44 |
-3.65% |
-3.65% |
| Networking |
$NWX |
826.10 |
-6.72 |
-0.81% |
-0.81% |
| Broker/Dealer |
$XBD |
553.77 |
-3.53 |
-0.63% |
-0.63% |
| Retail |
$RLX |
3,848.06 |
-40.71 |
-1.05% |
-1.05% |
| Gold & Silver |
$XAU |
123.59 |
-2.11 |
-1.68% |
-1.67% |
| Bank |
$BKX |
96.93 |
+0.90 |
+0.94% |
+0.94% |
| Biotech |
$BTK |
5,496.43 |
+77.64 |
+1.43% |
+1.43% |
|
|
|
 |
Pulled Back After Closing 3 Weeks Tight
Kenneth J. Gruneisen - Passed the CAN SLIM® Master's Exam
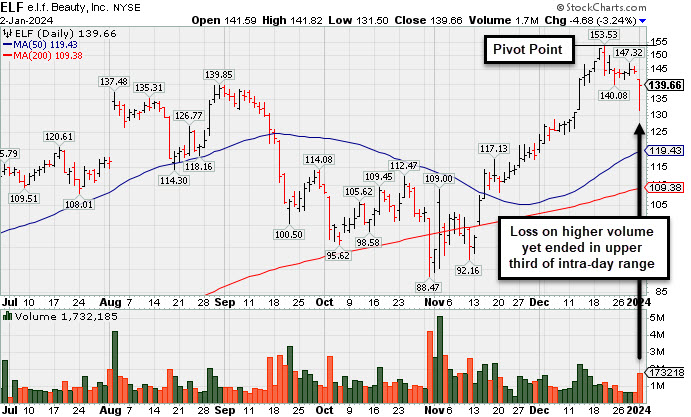
e.l.f. Beauty (ELF -$4.68 or -3.24% to $139.66) has been addeed to the Featured Stocks list highlighted in yellow with pivot point cited based on its 12/20/23 high plus 10 cents after forming an advanced "3 weeks tight" base (the 2nd chart is a weekly graph). It rebounded from early low of the session after gapping down, finished in the upper third of its intra-day range and near its 52-week high. Subsequent volume-driven gains for new highs are needed to trigger a technical buy signal.
ELF has a 98 Earnings Per Share rating. It reported Sep '23 quarterly earnings +128% on +76% sales revenues versus the year-ago period, adding to its streak of very strong quarterly results well above the +25% minimum earnings guideline (C criteria). Annual earnings (A criteria) history over the past 3 years has been strong, making it a better match with the fact-based investment system's fundamental guidelines.
The number of top-rated funds owning its shares rose from 510 in Mar '23 to 722 in Dec '23, a very reassuring sign concerning the I criteria. Its current Up/Down Volume Ratio of 1.8 is an unbiased indication its shares have been under accumulation over the past 50 days. Its small supply (S criteria) of only 55.2 million shares outstanding can contribute to greater price volatility in the event of institutional buying or selling.
|
|
|
Color Codes Explained :
Y - Better candidates highlighted by our
staff of experts.
G - Previously featured
in past reports as yellow but may no longer be buyable under the
guidelines.
***Last / Change / Volume data in this table is the closing quote data***
Symbol/Exchange
Company Name
Industry Group |
PRICE |
CHANGE
(%Change) |
Day High |
Volume
(% DAV)
(% 50 day avg vol) |
52 Wk Hi
% From Hi |
Featured
Date |
Price
Featured |
Pivot Featured |
|
Max Buy |
 ANET
-
NYSE
ANET
-
NYSE
Arista Networks
Computer-Networking
|
$231.56
|
-3.95
-1.68% |
$234.25
|
1,407,262
66.69% of 50 DAV
50 DAV is 2,110,000
|
$240.68
-3.79%
|
10/31/2023
|
$188.84
|
PP = $198.80
|
|
MB = $208.74
|
 Most Recent Note - 1/2/2024 6:24:55 PM
G - Pulling back after hovering near its all-time high, extended from any sound base. Its 50 DMA line ($215.66) defines near-term support above the prior low in the $210 area. Fundamentals remain strong.
>>> FEATURED STOCK ARTICLE : Extended From Base and Hovering at All-Time High - 12/26/2023 |
View all notes |
Set NEW NOTE alert |
Company Profile |
SEC
News |
Chart |
Request a new note
C
A
S
I |
NVO
-
NYSE
Novo Nordisk ADR
Medical-Ethical Drugs
|
$102.11
|
-1.34
-1.30% |
$102.63
|
2,637,364
64.28% of 50 DAV
50 DAV is 4,103,000
|
$105.69
-3.39%
|
11/2/2023
|
$100.97
|
PP = $104.10
|
|
MB = $109.31
|
Most Recent Note - 12/28/2023 6:21:31 PM
Y - There was a "negative reversal" after an early gain today as, with light volume, it closed at the session low. Recently wedged above its 50 DMA line ($99.75) toward its high with gains lacking great volume conviction. Its 50 DMA line defines initial support above the recent low ($94.73 on 12/11/23) on pullbacks.
>>> FEATURED STOCK ARTICLE : Managed a "Positive Reversal" but Still Below 50-Day Moving Average - 12/11/2023 |
View all notes |
Set NEW NOTE alert |
Company Profile |
SEC
News |
Chart |
Request a new note
C
A
S
I |
QLYS
-
NASDAQ
Qualys
Computer Sftwr-Security
|
$191.88
|
-4.40
-2.24% |
$194.40
|
385,595
106.22% of 50 DAV
50 DAV is 363,000
|
$206.35
-7.01%
|
11/3/2023
|
$167.50
|
PP = $165.03
|
|
MB = $173.28
|
Most Recent Note - 1/2/2024 6:29:13 PM
G - Pulled back today for a 5th consecutive loss with average (higher) volume. It is very extended from any sound base. Its 50 DMA line ($179.58) defines initial support to watch.
>>> FEATURED STOCK ARTICLE : Extended From Base Following Big Breakout - 12/12/2023 |
View all notes |
Set NEW NOTE alert |
Company Profile |
SEC
News |
Chart |
Request a new note
C
A
S
I |
AXON
-
NASDAQ
Axon Enterprise
Security/Sfty
|
$251.63
|
-6.70
-2.59% |
$256.01
|
532,385
121.55% of 50 DAV
50 DAV is 438,000
|
$260.69
-3.48%
|
11/8/2023
|
$127.84
|
PP = $223.30
|
|
MB = $234.47
|
Most Recent Note - 12/28/2023 6:17:58 PM
G - Volume totals have been cooling while stubbornly holding its ground near its all-time high. On pullbacks, the prior highs in the $229-231 area define near-term support to watch coinciding with its 50-day moving average (DMA) line ($229).
>>> FEATURED STOCK ARTICLE : Axon Enterprise Hits New High With 6th Straight Gain - 12/13/2023 |
View all notes |
Set NEW NOTE alert |
Company Profile |
SEC
News |
Chart |
Request a new note
C
A
S
I |
TDG
-
NYSE
TransDigm Group
Aerospace/Defense
|
$992.20
|
-19.40
-1.92% |
$1,013.50
|
245,594
109.64% of 50 DAV
50 DAV is 224,000
|
$1,018.50
-2.58%
|
12/12/2023
|
$1,000.39
|
PP = $1,013.18
|
|
MB = $1,063.84
|
Most Recent Note - 1/2/2024 6:26:48 PM
Y - Pulled back today with near-average (higher) volume. The new pivot point cited was based on its 11/14/23 high plus 10 cents, however, recent gains above the pivot point were not backed by the +40% above-average volume necessary to trigger a proper new technical buy signal. Fundamentals remain strong. Recent lows in the $950 area define near-term support to watch on pullbacks.
>>> FEATURED STOCK ARTICLE : Volume-Driven Loss Breaks Streak of 6 Straight Gains - 12/14/2023 |
View all notes |
Set NEW NOTE alert |
Company Profile |
SEC
News |
Chart |
Request a new note
C
A
S
I |
Symbol/Exchange
Company Name
Industry Group |
PRICE |
CHANGE
(%Change) |
Day High |
Volume
(% DAV)
(% 50 day avg vol) |
52 Wk Hi
% From Hi |
Featured
Date |
Price
Featured |
Pivot Featured |
|
Max Buy |
PANW
-
NASDAQ
Palo Alto Networks
Computer Sftwr-Security
|
$288.92
|
-5.96
-2.02% |
$292.12
|
2,878,382
66.03% of 50 DAV
50 DAV is 4,359,000
|
$318.00
-9.14%
|
11/13/2023
|
$255.90
|
PP = $266.00
|
|
MB = $279.30
|
Most Recent Note - 1/2/2024 6:28:03 PM
G - Pulled back today with below-average volume for a 4th consecutive loss. Prior highs in the $265 area define important support to watch along with its 50 DMA line ($272). Fundamentals remain strong.
>>> FEATURED STOCK ARTICLE : Consolidating After Volume-Driven Gains for All-Time Highs - 12/15/2023 |
View all notes |
Set NEW NOTE alert |
Company Profile |
SEC
News |
Chart |
Request a new note
C
A
S
I |
URI
-
NYSE
United Rentals
Comml Svcs-Leasing
|
$567.10
|
-6.32
-1.10% |
$575.08
|
444,014
59.12% of 50 DAV
50 DAV is 751,000
|
$585.50
-3.14%
|
12/1/2023
|
$499.51
|
PP = $488.73
|
|
MB = $513.17
|
Most Recent Note - 12/28/2023 6:23:40 PM
G - Sputtered today but recovered to end in the upper third of its intra-day range with a small loss on below-average volume, perched very near its all-time high. On pullbacks, the prior highs define near-term support to watch above its 50 DMA line ($478).
>>> FEATURED STOCK ARTICLE : Perched Near All-Time High Following Volume-Driven Gains - 12/19/2023 |
View all notes |
Set NEW NOTE alert |
Company Profile |
SEC
News |
Chart |
Request a new note
C
A
S
I |
AMPH
-
NASDAQ
Amphastar Pharm
Medical-Biomed/Biotech
|
$62.29
|
+0.44
0.71% |
$62.41
|
428,654
100.62% of 50 DAV
50 DAV is 426,000
|
$67.66
-7.94%
|
12/4/2023
|
$60.84
|
PP = $58.35
|
|
MB = $61.27
|
Most Recent Note - 12/28/2023 6:16:08 PM
G - Color code is changed to green after Tuesday's volume-driven gain triggered a technical buy signal and it rose above its "max buy" level. Little resistance remains due to overhead supply. Fundamentals remain strong.
>>> FEATURED STOCK ARTICLE : Consolidating Above Pivot Point With Volume Cooling - 12/21/2023 |
View all notes |
Set NEW NOTE alert |
Company Profile |
SEC
News |
Chart |
Request a new note
C
A
S
I |
TBBK
-
NASDAQ
The Bancorp
Banks-Northeast
|
$38.37
|
-0.19
-0.49% |
$39.01
|
351,032
80.70% of 50 DAV
50 DAV is 435,000
|
$42.46
-9.63%
|
12/4/2023
|
$39.88
|
PP = $41.62
|
|
MB = $43.70
|
Most Recent Note - 12/29/2023 5:01:31 PM
Y - Fell toward its 50 DMA line ($38.18) with today's 3rd consecutive loss. Subsequent gains and a strong close above the pivot point backed by at least +40% above average volume are needed to trigger a proper technical buy signal.
>>> FEATURED STOCK ARTICLE : Negative Reversals are Signs of Distributional Pressure - 12/22/2023 |
View all notes |
Set NEW NOTE alert |
Company Profile |
SEC
News |
Chart |
Request a new note
C
A
S
I |
LULU
-
NASDAQ
lululemon athletica
Retail-Apparel/Shoes/Acc
|
$505.38
|
-5.91
-1.16% |
$508.92
|
1,187,178
75.42% of 50 DAV
50 DAV is 1,574,000
|
$516.39
-2.13%
|
12/8/2023
|
$490.61
|
PP = $485.93
|
|
MB = $510.23
|
Most Recent Note - 12/27/2023 5:33:17 PM
Y - Hovering near its all-time high but still below its "max buy" level with volume totals cooling. Its 2021 high of $485 defines initial support to watch after its recent breakout from a 2+ year base. See the latest FSU analysis for more details and a new annotated graph.
>>> FEATURED STOCK ARTICLE : Perched at All-Time High With Volume Totals Cooling - 12/27/2023 |
View all notes |
Set NEW NOTE alert |
Company Profile |
SEC
News |
Chart |
Request a new note
C
A
S
I |
Symbol/Exchange
Company Name
Industry Group |
PRICE |
CHANGE
(%Change) |
Day High |
Volume
(% DAV)
(% 50 day avg vol) |
52 Wk Hi
% From Hi |
Featured
Date |
Price
Featured |
Pivot Featured |
|
Max Buy |
CRWD
-
NASDAQ
CrowdStrike Holdings
Computer Sftwr-Security
|
$246.89
|
-8.43
-3.30% |
$252.29
|
3,752,481
123.44% of 50 DAV
50 DAV is 3,040,000
|
$261.81
-5.70%
|
1/2/2024
|
$246.42
|
PP = $261.91
|
|
MB = $275.01
|
Most Recent Note - 1/2/2024 2:43:00 PM
Y - Pulling back from its 52-week high with today's 4th consecutive loss. Color code is changed to yellow as it formed an advanced "3-weeks tight" base with the pivot point cited based on its 12/18/23 high plus 10 cents. Subsequent gains above the pivot point backed by at least +40% above average volume may trigger a technical buy signal. Reported Oct '23 quarterly earnings +105% on +35% sales revenues versus the year-ago period, extending its streak of strong earnings increases well above the +25% minimum guideline (C criteria) in quarterly comparisons. Faces no resistance due to overhead supply. Annual earnings history has been strong. Completed its $34 IPO on 6/12/19.
There are no Featured Stock Updates™ available for this stock at this time. You may request one by clicking the Request a New Note link below |
View all notes |
Set NEW NOTE alert |
Company Profile |
SEC
News |
Chart |
Request a new note
C
A
S
I |
ELF
-
NYSE
e.l.f. Beauty
Cosmetics/Personal Care
|
$139.66
|
-4.68
-3.24% |
$141.82
|
1,732,064
118.72% of 50 DAV
50 DAV is 1,459,000
|
$153.53
-9.03%
|
1/2/2024
|
$138.23
|
PP = $153.63
|
|
MB = $161.31
|
Most Recent Note - 1/2/2024 2:43:17 PM
Y - Color code is changed to yellow with pivot point cited based on its 12/20/23 high plus 10 cents after forming an advanced "3 weeks tight" base. Rebounded from early low after gapping down today retreating from near its 52-week high. Subsequent volume-driven gains for new highs are needed to trigger a technical buy signal. Reported Sep '23 quarterly earnings +128% on +76% sales revenues versus the year-ago period, adding to its streak of very strong quarterly results well above the +25% minimum earnings guideline (C criteria). Annual earnings (A criteria) history over the past 3 years has been strong, making it a better match with the fact-based investment system's fundamental guidelines.
>>> FEATURED STOCK ARTICLE : Pulled Back After Closing 3 Weeks Tight - 1/2/2024 |
View all notes |
Set NEW NOTE alert |
Company Profile |
SEC
News |
Chart |
Request a new note
C
A
S
I |
|
|
|
THESE ARE NOT BUY RECOMMENDATIONS!
Comments contained in the body of this report are technical
opinions only. The material herein has been obtained
from sources believed to be reliable and accurate, however,
its accuracy and completeness cannot be guaranteed.
This site is not an investment advisor, hence it does
not endorse or recommend any securities or other investments.
Any recommendation contained in this report may not
be suitable for all investors and it is not to be deemed
an offer or solicitation on our part with respect to
the purchase or sale of any securities. All trademarks,
service marks and trade names appearing in this report
are the property of their respective owners, and are
likewise used for identification purposes only.
This report is a service available
only to active Paid Premium Members.
You may opt-out of receiving report notifications
at any time. Questions or comments may be submitted
by writing to Premium Membership Services 665 S.E. 10 Street, Suite 201 Deerfield Beach, FL 33441-5634 or by calling 1-800-965-8307
or 954-785-1121.
|
|
|