You are not logged in.
This means you
CAN ONLY VIEW reports that were published prior to Tuesday, March 25, 2025.
You
MUST UPGRADE YOUR MEMBERSHIP if you want to see any current reports.
AFTER MARKET UPDATE - WEDNESDAY, JANUARY 3RD, 2024
Previous After Market Report Next After Market Report >>>
|
|
|
|
DOW |
-284.85 |
37,430.19 |
-0.76% |
|
Volume |
978,985,510 |
+6% |
|
Volume |
5,583,870,200 |
-5% |
|
NASDAQ |
-173.73 |
14,592.21 |
-1.18% |
|
Advancers |
785 |
28% |
|
Advancers |
1,185 |
27% |
|
S&P 500 |
-38.02 |
4,704.81 |
-0.80% |
|
Decliners |
1,981 |
72% |
|
Decliners |
3,135 |
73% |
|
Russell 2000 |
-67.87 |
1,959.20 |
-3.35% |
|
52 Wk Highs |
38 |
|
|
52 Wk Highs |
60 |
|
|
S&P 600 |
-35.22 |
1,275.62 |
-2.69% |
|
52 Wk Lows |
9 |
|
|
52 Wk Lows |
78 |
|
|
 |
Leadership Thin as Major Indices Fall Again
Kenneth J. Gruneisen - Passed the CAN SLIM® Master's Exam
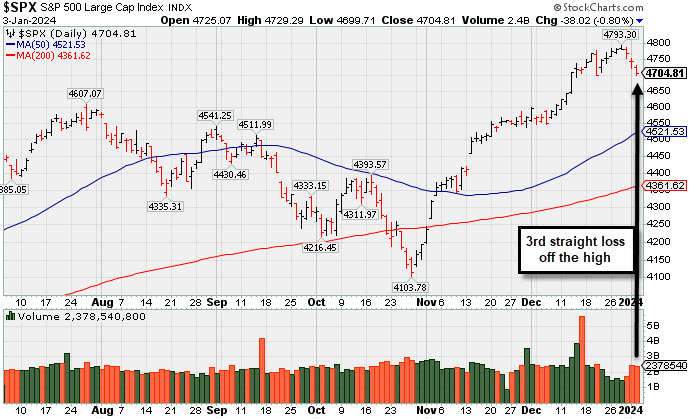
The Dow Jones Industrial Average, S&P 500, and Nasdaq Composite declined -0.8%, -0.8%, and -1.2%, respectively. The Russell 2000 underperformed while declining -2.7%. Volume was reported mixed, higher than the prior session total on the NYSE and lighter on the Nasdaq exchange. Decliners led advancers by a 5-2 margin on the NYSE and by almost a 3-1 margin on the Nasdaq exchange. There were 15 high-ranked companies from the Leaders List that hit new 52-week highs and were listed on the BreakOuts Page, versus the total of 14 on the prior session. New 52-week highs outnumbered new 52-week lows on the NYSE but new lows outnumbered new highs on the Nasdaq exchange. The major indices are in a confirmed uptrend (M criteria). New buying efforts should be only made in stocks fitting all key criteria of the fact-based investment system.
PICTURED: The S&P 500 Index pulled back for a 3rd straight loss off its recent high. Eight of the 11 S&P 500 sectors fell with the real estate sector (-2.4%) suffering the largest decline by a wide margin followed by the consumer discretionary sector (-1.9%). The energy sector outperformed, gaining +1.5%, as oil prices climbed ($72.82/bbl, +2.29, +3.3%).
The 2-yr note yield declined one basis point to 4.32% and the 10-yr note yield fell four basis points to 3.91%. With the minutes for the December 12-13 FOMC meeting the committee viewed the policy rate as likely at or near its peak for this tightening cycle. The Fed made it clear, however, that it isn't divorcing itself entirely from the idea that it might still have to raise rates again.
|
 Kenneth J. Gruneisen started out as a licensed stockbroker in August 1987, a couple of months prior to the historic stock market crash that took the Dow Jones Industrial Average down -22.6% in a single day. He has published daily fact-based fundamental and technical analysis on high-ranked stocks online for two decades. Through FACTBASEDINVESTING.COM, Kenneth provides educational articles, news, market commentary, and other information regarding proven investment systems that work in good times and bad.
Comments contained in the body of this report are technical opinions only and are not necessarily those of Gruneisen Growth Corp. The material herein has been obtained from sources believed to be reliable and accurate, however, its accuracy and completeness cannot be guaranteed. Our firm, employees, and customers may effect transactions, including transactions contrary to any recommendation herein, or have positions in the securities mentioned herein or options with respect thereto. Any recommendation contained in this report may not be suitable for all investors and it is not to be deemed an offer or solicitation on our part with respect to the purchase or sale of any securities. |
|
 |
Retail, Financial, Tech, and Gold & Silver Indexes Fell
Kenneth J. Gruneisen - Passed the CAN SLIM® Master's Exam
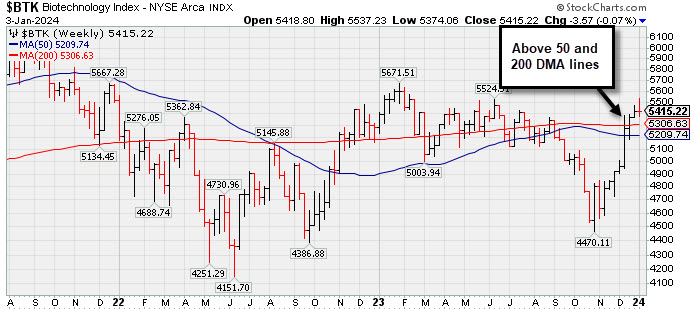
The Bank Index ($BKX -1.95%), Broker/Dealer Index ($XBD -1.50%), and the Retail Index ($RLX -1.35%) each finished with losses. The Semiconductor Index ($SOX -2.03%) led the tech sector lower while the Networking Index ($NWX -1.74%) and the Biotech Index ($BTK -1.48%) also lost ground. The Gold & Silver Index ($XAU -2.64%) lost ground while the Oil Services Index ($OSX +0.33%) inched higher and the Integrated Oil Index ($XOI +2.03%) posted a standout gain.
PICTURED: The Biotech Index ($BTK -1.48%) is consolidating after rebounding above its 50 and 200 DMA lines.
| Oil Services |
$OSX |
83.74 |
+0.27 |
+0.33% |
-0.17% |
| Integrated Oil |
$XOI |
1,917.42 |
+38.21 |
+2.03% |
+2.95% |
| Semiconductor |
$SOX |
3,941.21 |
-81.82 |
-2.03% |
-5.61% |
| Networking |
$NWX |
811.70 |
-14.39 |
-1.74% |
-2.53% |
| Broker/Dealer |
$XBD |
545.49 |
-8.28 |
-1.50% |
-2.12% |
| Retail |
$RLX |
3,796.28 |
-51.78 |
-1.35% |
-2.38% |
| Gold & Silver |
$XAU |
120.32 |
-3.27 |
-2.64% |
-4.27% |
| Bank |
$BKX |
95.03 |
-1.89 |
-1.95% |
-1.03% |
| Biotech |
$BTK |
5,415.22 |
-81.21 |
-1.48% |
-0.07% |
|
|
|
 |
CrowdStrike Holdings Pulling Back After "3-Weeks Tight" Pattern
Kenneth J. Gruneisen - Passed the CAN SLIM® Master's Exam
CrowdStrike Holdings (CRWD -$2.53 or -1.02% to $244.36) pulled back from its 52-week high with near average volume behind today's 5th consecutive loss. Little resistance remains due to overhead supply. Its color code was changed to yellow as it formed an advanced "3-weeks tight" base with the pivot point cited based on its 12/18/23 high plus 10 cents. Subsequent gains above the pivot point backed by at least +40% above average volume may trigger a technical buy signal.
CRWD has a highest possible 99 Earnings Per Share rating. It reported Oct '23 quarterly earnings +105% on +35% sales revenues versus the year-ago period, extending its streak of strong earnings increases well above the +25% minimum guideline (C criteria) in quarterly comparisons. Its annual earnings (A criteria) history has been strong. Completed its $34 IPO on 6/12/19.
The number of top-rated funds owning its shares rose from 1,880 in Jun 23 to 2,061 in Dec '23, a reassuring sign concerning the I criteria. Its current Up/Down Volume Ratio of 2.4 is an unbiased indication its shares have been under accumulation over the past 50 days.
|
|
|
Color Codes Explained :
Y - Better candidates highlighted by our
staff of experts.
G - Previously featured
in past reports as yellow but may no longer be buyable under the
guidelines.
***Last / Change / Volume data in this table is the closing quote data***
Symbol/Exchange
Company Name
Industry Group |
PRICE |
CHANGE
(%Change) |
Day High |
Volume
(% DAV)
(% 50 day avg vol) |
52 Wk Hi
% From Hi |
Featured
Date |
Price
Featured |
Pivot Featured |
|
Max Buy |
 ANET
-
NYSE
ANET
-
NYSE
Arista Networks
Computer-Networking
|
$229.40
|
-2.16
-0.93% |
$232.90
|
1,201,765
57.09% of 50 DAV
50 DAV is 2,105,000
|
$240.68
-4.69%
|
10/31/2023
|
$188.84
|
PP = $198.80
|
|
MB = $208.74
|
Most Recent Note - 1/2/2024 6:24:55 PM
G - Pulling back after hovering near its all-time high, extended from any sound base. Its 50 DMA line ($215.66) defines near-term support above the prior low in the $210 area. Fundamentals remain strong.
>>> FEATURED STOCK ARTICLE : Extended From Base and Hovering at All-Time High - 12/26/2023 |
View all notes |
Set NEW NOTE alert |
Company Profile |
SEC
News |
Chart |
Request a new note
C
A
S
I |
NVO
-
NYSE
Novo Nordisk ADR
Medical-Ethical Drugs
|
$103.62
|
+1.51
1.48% |
$103.84
|
4,062,181
100.20% of 50 DAV
50 DAV is 4,054,000
|
$105.69
-1.96%
|
11/2/2023
|
$100.97
|
PP = $104.10
|
|
MB = $109.31
|
Most Recent Note - 12/28/2023 6:21:31 PM
Y - There was a "negative reversal" after an early gain today as, with light volume, it closed at the session low. Recently wedged above its 50 DMA line ($99.75) toward its high with gains lacking great volume conviction. Its 50 DMA line defines initial support above the recent low ($94.73 on 12/11/23) on pullbacks.
>>> FEATURED STOCK ARTICLE : Managed a "Positive Reversal" but Still Below 50-Day Moving Average - 12/11/2023 |
View all notes |
Set NEW NOTE alert |
Company Profile |
SEC
News |
Chart |
Request a new note
C
A
S
I |
QLYS
-
NASDAQ
Qualys
Computer Sftwr-Security
|
$185.36
|
-6.52
-3.40% |
$191.00
|
447,683
122.65% of 50 DAV
50 DAV is 365,000
|
$206.35
-10.17%
|
11/3/2023
|
$167.50
|
PP = $165.03
|
|
MB = $173.28
|
 Most Recent Note - 1/3/2024 7:07:08 PM
G - Pulled back today for a 6th consecutive loss with ever-increasing volume. It is very extended from any sound base. Its 50 DMA line ($180) defines initial support to watch.
>>> FEATURED STOCK ARTICLE : Extended From Base Following Big Breakout - 12/12/2023 |
View all notes |
Set NEW NOTE alert |
Company Profile |
SEC
News |
Chart |
Request a new note
C
A
S
I |
AXON
-
NASDAQ
Axon Enterprise
Security/Sfty
|
$247.43
|
-4.20
-1.67% |
$252.24
|
332,986
75.34% of 50 DAV
50 DAV is 442,000
|
$260.69
-5.09%
|
11/8/2023
|
$127.84
|
PP = $223.30
|
|
MB = $234.47
|
Most Recent Note - 12/28/2023 6:17:58 PM
G - Volume totals have been cooling while stubbornly holding its ground near its all-time high. On pullbacks, the prior highs in the $229-231 area define near-term support to watch coinciding with its 50-day moving average (DMA) line ($229).
>>> FEATURED STOCK ARTICLE : Axon Enterprise Hits New High With 6th Straight Gain - 12/13/2023 |
View all notes |
Set NEW NOTE alert |
Company Profile |
SEC
News |
Chart |
Request a new note
C
A
S
I |
TDG
-
NYSE
TransDigm Group
Aerospace/Defense
|
$972.61
|
-19.59
-1.97% |
$993.40
|
271,475
120.66% of 50 DAV
50 DAV is 225,000
|
$1,018.50
-4.51%
|
12/12/2023
|
$1,000.39
|
PP = $1,013.18
|
|
MB = $1,063.84
|
Most Recent Note - 1/2/2024 6:26:48 PM
Y - Pulled back today with near-average (higher) volume. The new pivot point cited was based on its 11/14/23 high plus 10 cents, however, recent gains above the pivot point were not backed by the +40% above-average volume necessary to trigger a proper new technical buy signal. Fundamentals remain strong. Recent lows in the $950 area define near-term support to watch on pullbacks.
>>> FEATURED STOCK ARTICLE : Volume-Driven Loss Breaks Streak of 6 Straight Gains - 12/14/2023 |
View all notes |
Set NEW NOTE alert |
Company Profile |
SEC
News |
Chart |
Request a new note
C
A
S
I |
Symbol/Exchange
Company Name
Industry Group |
PRICE |
CHANGE
(%Change) |
Day High |
Volume
(% DAV)
(% 50 day avg vol) |
52 Wk Hi
% From Hi |
Featured
Date |
Price
Featured |
Pivot Featured |
|
Max Buy |
PANW
-
NASDAQ
Palo Alto Networks
Computer Sftwr-Security
|
$286.47
|
-2.45
-0.85% |
$289.12
|
2,466,891
56.85% of 50 DAV
50 DAV is 4,339,000
|
$318.00
-9.92%
|
11/13/2023
|
$255.90
|
PP = $266.00
|
|
MB = $279.30
|
Most Recent Note - 1/2/2024 6:28:03 PM
G - Pulled back today with below-average volume for a 4th consecutive loss. Prior highs in the $265 area define important support to watch along with its 50 DMA line ($272). Fundamentals remain strong.
>>> FEATURED STOCK ARTICLE : Consolidating After Volume-Driven Gains for All-Time Highs - 12/15/2023 |
View all notes |
Set NEW NOTE alert |
Company Profile |
SEC
News |
Chart |
Request a new note
C
A
S
I |
URI
-
NYSE
United Rentals
Comml Svcs-Leasing
|
$547.16
|
-19.94
-3.52% |
$558.43
|
828,753
112.91% of 50 DAV
50 DAV is 734,000
|
$585.50
-6.55%
|
12/1/2023
|
$499.51
|
PP = $488.73
|
|
MB = $513.17
|
Most Recent Note - 1/3/2024 7:03:37 PM
G - Pulled back today with higher volume behind a 5th consecutive loss, reteating from its all-time high. On pullbacks, the prior highs define near-term support to watch above its 50 DMA line ($486.62).
>>> FEATURED STOCK ARTICLE : Perched Near All-Time High Following Volume-Driven Gains - 12/19/2023 |
View all notes |
Set NEW NOTE alert |
Company Profile |
SEC
News |
Chart |
Request a new note
C
A
S
I |
AMPH
-
NASDAQ
Amphastar Pharm
Medical-Biomed/Biotech
|
$61.04
|
-1.25
-2.01% |
$63.15
|
524,721
122.03% of 50 DAV
50 DAV is 430,000
|
$67.66
-9.78%
|
12/4/2023
|
$60.84
|
PP = $58.35
|
|
MB = $61.27
|
Most Recent Note - 12/28/2023 6:16:08 PM
G - Color code is changed to green after Tuesday's volume-driven gain triggered a technical buy signal and it rose above its "max buy" level. Little resistance remains due to overhead supply. Fundamentals remain strong.
>>> FEATURED STOCK ARTICLE : Consolidating Above Pivot Point With Volume Cooling - 12/21/2023 |
View all notes |
Set NEW NOTE alert |
Company Profile |
SEC
News |
Chart |
Request a new note
C
A
S
I |
TBBK
-
NASDAQ
The Bancorp
Banks-Northeast
|
$37.03
|
-1.34
-3.49% |
$38.26
|
525,402
120.23% of 50 DAV
50 DAV is 437,000
|
$42.46
-12.79%
|
12/4/2023
|
$39.88
|
PP = $41.62
|
|
MB = $43.70
|
Most Recent Note - 1/3/2024 7:06:27 PM
G - Violated its 50 DMA line ($38.39) with higher volume behind today's 5th consecutive loss raising concerns and its color code is changed to green. A prompt rebound above the 50 DMA line is needed for its outlook to improve.
>>> FEATURED STOCK ARTICLE : Negative Reversals are Signs of Distributional Pressure - 12/22/2023 |
View all notes |
Set NEW NOTE alert |
Company Profile |
SEC
News |
Chart |
Request a new note
C
A
S
I |
LULU
-
NASDAQ
lululemon athletica
Retail-Apparel/Shoes/Acc
|
$498.02
|
-7.36
-1.46% |
$503.95
|
1,028,515
66.53% of 50 DAV
50 DAV is 1,546,000
|
$516.39
-3.56%
|
12/8/2023
|
$490.61
|
PP = $485.93
|
|
MB = $510.23
|
Most Recent Note - 1/3/2024 7:02:07 PM
Y - Quietly pulling back yet lingering near its all-time high below its "max buy" level with volume totals cooling. Its 2021 high of $485 defines initial support to watch after its recent breakout from a 2+ year base.
>>> FEATURED STOCK ARTICLE : Perched at All-Time High With Volume Totals Cooling - 12/27/2023 |
View all notes |
Set NEW NOTE alert |
Company Profile |
SEC
News |
Chart |
Request a new note
C
A
S
I |
Symbol/Exchange
Company Name
Industry Group |
PRICE |
CHANGE
(%Change) |
Day High |
Volume
(% DAV)
(% 50 day avg vol) |
52 Wk Hi
% From Hi |
Featured
Date |
Price
Featured |
Pivot Featured |
|
Max Buy |
CRWD
-
NASDAQ
CrowdStrike Holdings
Computer Sftwr-Security
|
$244.36
|
-2.53
-1.02% |
$248.83
|
3,155,646
103.63% of 50 DAV
50 DAV is 3,045,000
|
$261.81
-6.67%
|
1/2/2024
|
$246.42
|
PP = $261.91
|
|
MB = $275.01
|
Most Recent Note - 1/3/2024 7:00:41 PM
Y - Pulled back from its 52-week high with today's 5th consecutive loss. Color code was changed to yellow as it formed an advanced "3-weeks tight" base with the pivot point cited based on its 12/18/23 high plus 10 cents. Subsequent gains above the pivot point backed by at least +40% above average volume may trigger a technical buy signal. Reported Oct '23 quarterly earnings +105% on +35% sales revenues versus the year-ago period, extending its streak of strong earnings increases well above the +25% minimum guideline (C criteria) in quarterly comparisons. Faces no resistance due to overhead supply. Annual earnings history has been strong. Completed its $34 IPO on 6/12/19. See the latest FSU analysis for more details and a new annotated graph.
>>> FEATURED STOCK ARTICLE : CrowdStrike Holdings Pulling Back After "3-Weeks Tight" Pattern - 1/3/2024 |
View all notes |
Set NEW NOTE alert |
Company Profile |
SEC
News |
Chart |
Request a new note
C
A
S
I |
ELF
-
NYSE
e.l.f. Beauty
Cosmetics/Personal Care
|
$132.16
|
-7.50
-5.37% |
$138.65
|
995,121
67.51% of 50 DAV
50 DAV is 1,474,000
|
$153.53
-13.92%
|
1/2/2024
|
$138.23
|
PP = $153.63
|
|
MB = $161.31
|
Most Recent Note - 1/3/2024 7:04:55 PM
Y - Pulled back for a 3rd consecutive loss. Pivot point cited recently was based on its 12/20/23 high plus 10 cents after forming an advanced "3 weeks tight" base. Subsequent volume-driven gains for new highs are needed to trigger a technical buy signal. Reported Sep '23 quarterly earnings +128% on +76% sales revenues versus the year-ago period, adding to its streak of very strong quarterly results well above the +25% minimum earnings guideline (C criteria). Annual earnings (A criteria) history over the past 3 years has been strong, making it a better match with the fact-based investment system's fundamental guidelines.
>>> FEATURED STOCK ARTICLE : Pulled Back After Closing 3 Weeks Tight - 1/2/2024 |
View all notes |
Set NEW NOTE alert |
Company Profile |
SEC
News |
Chart |
Request a new note
C
A
S
I |
|
|
|
THESE ARE NOT BUY RECOMMENDATIONS!
Comments contained in the body of this report are technical
opinions only. The material herein has been obtained
from sources believed to be reliable and accurate, however,
its accuracy and completeness cannot be guaranteed.
This site is not an investment advisor, hence it does
not endorse or recommend any securities or other investments.
Any recommendation contained in this report may not
be suitable for all investors and it is not to be deemed
an offer or solicitation on our part with respect to
the purchase or sale of any securities. All trademarks,
service marks and trade names appearing in this report
are the property of their respective owners, and are
likewise used for identification purposes only.
This report is a service available
only to active Paid Premium Members.
You may opt-out of receiving report notifications
at any time. Questions or comments may be submitted
by writing to Premium Membership Services 665 S.E. 10 Street, Suite 201 Deerfield Beach, FL 33441-5634 or by calling 1-800-965-8307
or 954-785-1121.
|
|
|