You are not logged in.
This means you
CAN ONLY VIEW reports that were published prior to Friday, April 11, 2025.
You
MUST UPGRADE YOUR MEMBERSHIP if you want to see any current reports.
AFTER MARKET UPDATE - FRIDAY, JANUARY 5TH, 2024
Previous After Market Report Next After Market Report >>>
|
|
|
|
DOW |
+25.77 |
37,466.11 |
+0.07% |
|
Volume |
971,584,097 |
-6% |
|
Volume |
5,270,598,500 |
-3% |
|
NASDAQ |
+13.77 |
14,524.07 |
+0.09% |
|
Advancers |
1,452 |
53% |
|
Advancers |
1,810 |
43% |
|
S&P 500 |
+8.56 |
4,697.24 |
+0.18% |
|
Decliners |
1,282 |
47% |
|
Decliners |
2,403 |
57% |
|
Russell 2000 |
-6.58 |
1,951.14 |
-0.34% |
|
52 Wk Highs |
51 |
|
|
52 Wk Highs |
56 |
|
|
S&P 600 |
-3.86 |
1,270.66 |
-0.30% |
|
52 Wk Lows |
16 |
|
|
52 Wk Lows |
93 |
|
|
 |
Major Indices Ended Little Changed After Sluggish Start to 2024
Kenneth J. Gruneisen - Passed the CAN SLIM® Master's Exam
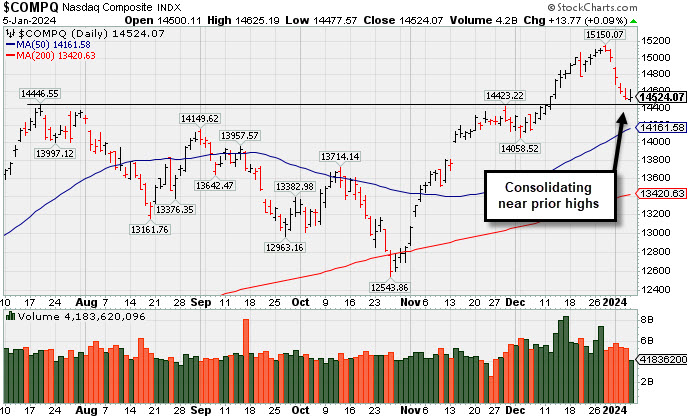
The S&P 500 closed just below 4,700 with a 0.2% gain. The Nasdaq Composite and Dow Jones Industrial Average each logged a 0.1% gain while the Russell 2000 declined 0.3%. Volume was reported lighter than the prior session total on the NYSE and on the Nasdaq exchange. Advancers led decliners by a narrow margin on the NYSE but decliners led advancers byt a 4-3 margin on the Nasdaq exchange. There were 22 high-ranked companies from the Leaders List that hit new 52-week highs and were listed on the BreakOuts Page, versus the total of 25 on the prior session. New 52-week highs outnumbered new 52-week lows on the NYSE but new lows outnumbered new highs on the Nasdaq exchange for a 3rd consecutive session. The major indices are in a confirmed uptrend (M criteria). New buying efforts should be only made in stocks fitting all key criteria of the fact-based investment system.
PICTURED: The Nasdaq Composite halted its slide near prior highs after slumping for 5 straight losses. The only three S&P 500 sectors to close lower were consumer staples (-0.2%), real estate (-0.2%), and health care (-0.02%). The financials sector (+0.5%) saw the biggest gain. None of the sectors moved more than 0.5% in either direction. Apple (AAPL -0.4%) shares slumped near their 200 DMA line following news that the DOJ is getting close to filing an antitrust case against the company, according to The New York Times.
Market participants were digesting the December Employment Situation Report and the December ISM Services PMI. The news included better than expected nonfarm payrolls and average hourly earnings along with a steady unemployment rate. There was a larger than expected deceleration in December service sector growth. Together, those reports stirred uncertainty about rate-cut expectations.
The 10-yr yield settled the day at 4.04%, five basis points higher. The 2-yr note yield, which is most sensitive to changes in the fed funds rate, settled the session at 4.39%.
|
 Kenneth J. Gruneisen started out as a licensed stockbroker in August 1987, a couple of months prior to the historic stock market crash that took the Dow Jones Industrial Average down -22.6% in a single day. He has published daily fact-based fundamental and technical analysis on high-ranked stocks online for two decades. Through FACTBASEDINVESTING.COM, Kenneth provides educational articles, news, market commentary, and other information regarding proven investment systems that work in good times and bad.
Comments contained in the body of this report are technical opinions only and are not necessarily those of Gruneisen Growth Corp. The material herein has been obtained from sources believed to be reliable and accurate, however, its accuracy and completeness cannot be guaranteed. Our firm, employees, and customers may effect transactions, including transactions contrary to any recommendation herein, or have positions in the securities mentioned herein or options with respect thereto. Any recommendation contained in this report may not be suitable for all investors and it is not to be deemed an offer or solicitation on our part with respect to the purchase or sale of any securities. |
|
 |
Financial, Retail, Semiconductor, and Oil Services Indexes Rose
Kenneth J. Gruneisen - Passed the CAN SLIM® Master's Exam
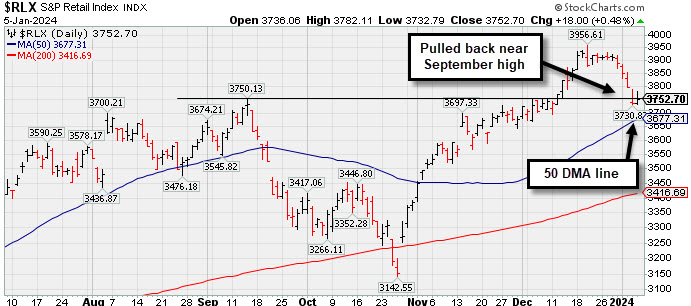
The Bank Index ($BKX +1.61%) outpaced the Broker/Dealer Index ($XBD +0.66%) and the Retail Index ($RLX +0.48%). The tech sector was mixed as the Semiconductor Index ($SOX +0.63%) edged higher while the Networking Index ($NWX -0.20%) and the Biotech Index ($BTK -0.29%) both edged lower. The Gold & Silver Index ($XAU -0.26%) and the Integrated Oil Index ($XOI -0.12%) both ended slightly lower while the Oil Services Index ($OSX +1.17%) posted a solid gain.
PICTURED: The Retail Index ($RLX +0.48%) is consolidating near the September high, well above its 50 DMA line.
| Oil Services |
$OSX |
82.89 |
+0.96 |
+1.17% |
-1.18% |
| Integrated Oil |
$XOI |
1,880.05 |
-2.19 |
-0.12% |
+0.94% |
| Semiconductor |
$SOX |
3,933.49 |
+24.63 |
+0.63% |
-5.80% |
| Networking |
$NWX |
802.35 |
-1.64 |
-0.20% |
-3.66% |
| Broker/Dealer |
$XBD |
549.87 |
+3.61 |
+0.66% |
-1.33% |
| Retail |
$RLX |
3,752.70 |
+18.00 |
+0.48% |
-3.50% |
| Gold & Silver |
$XAU |
120.30 |
-0.32 |
-0.26% |
-4.29% |
| Bank |
$BKX |
97.14 |
+1.54 |
+1.61% |
+1.16% |
| Biotech |
$BTK |
5,410.81 |
-15.54 |
-0.29% |
-0.15% |
|
|
|
 |
Gap Up Gain on Prior Session Triggered Technical Buy Signal
Kenneth J. Gruneisen - Passed the CAN SLIM® Master's Exam
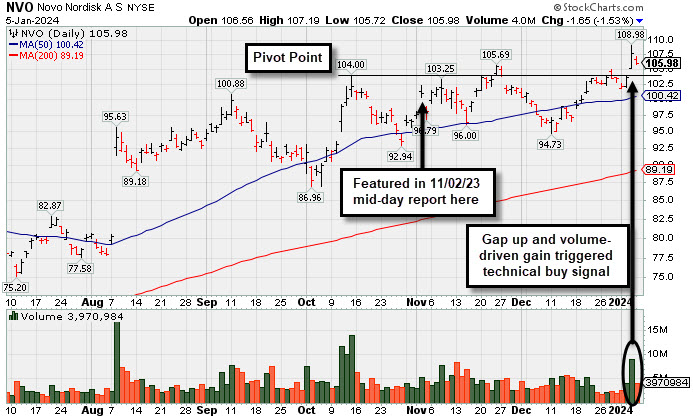
Novo Nordisk (NVO -$1.65 or -1.53% to $105.98) pulled back with average volume. On Thursday's session it gapped up and triggered a technical buy signal with a considerable gain backed by +118% above average volume. Prior highs in the $105 area defien initial support to watch above the 50-day moving average ($100.42).
NVO was highlighted in yellow in the 11/02/23 mid-day report (read here) with pivot point cited based on its 10/13/23 high plus 10 cents while building on an advanced ascending base. It was last shown in detail in this FSU section on 12/11/23 with an annotated graph under the headline, "Managed a 'Positive Reversal' but Still Below 50-Day Moving Average".
This Denmark-based Medical - Ethical Drugs firm's shares split 2-1 on 9/20/23. NVO reported Sep '23 quarterly earnings +69% on +39% sales revenues versus the year-ago period, its 3rd strong quarter well above the +25% minimum earnings guideline (C criteria). Annual earnings growth has been slow and steady. It has a 97 Earnings Per Share Rating, well above the 80+ minimum for buy candidates.
The number of top-rated funds owning its shares rose from 372 in Dec '22 to 470 in Sep '23, a reassuring sign concerning the I criteria. Its current Up/Down Volume Ratio of 1.1 is an unbiased indication its shares have been under slight accumulation over the past 50 days. It has a Timeliness Rating of B and an Accumulation/Distribution Rating of B. |
|
|
Color Codes Explained :
Y - Better candidates highlighted by our
staff of experts.
G - Previously featured
in past reports as yellow but may no longer be buyable under the
guidelines.
***Last / Change / Volume data in this table is the closing quote data***
Symbol/Exchange
Company Name
Industry Group |
PRICE |
CHANGE
(%Change) |
Day High |
Volume
(% DAV)
(% 50 day avg vol) |
52 Wk Hi
% From Hi |
Featured
Date |
Price
Featured |
Pivot Featured |
|
Max Buy |
 ANET
-
NYSE
ANET
-
NYSE
Arista Networks
Computer-Networking
|
$230.92
|
+0.36
0.16% |
$232.03
|
1,135,877
54.32% of 50 DAV
50 DAV is 2,091,000
|
$240.68
-4.06%
|
10/31/2023
|
$188.84
|
PP = $198.80
|
|
MB = $208.74
|
Most Recent Note - 1/2/2024 6:24:55 PM
G - Pulling back after hovering near its all-time high, extended from any sound base. Its 50 DMA line ($215.66) defines near-term support above the prior low in the $210 area. Fundamentals remain strong.
>>> FEATURED STOCK ARTICLE : Extended From Base and Hovering at All-Time High - 12/26/2023 |
View all notes |
Set NEW NOTE alert |
Company Profile |
SEC
News |
Chart |
Request a new note
C
A
S
I |
NVO
-
NYSE
Novo Nordisk ADR
Medical-Ethical Drugs
|
$105.98
|
-1.65
-1.53% |
$107.19
|
3,970,613
94.83% of 50 DAV
50 DAV is 4,187,000
|
$108.98
-2.75%
|
11/2/2023
|
$100.97
|
PP = $104.10
|
|
MB = $109.31
|
 Most Recent Note - 1/5/2024 5:13:14 PM
Y - Pulled back today with average volume. Gap up and volume-driven gain on the prior session triggered a technical buy signal while hitting a new all-time high. Prior highs in the $105 area define initial support above its 50 DMA line ($100.42) See the latest FSU analysis for more details and a new annotated graph.
>>> FEATURED STOCK ARTICLE : Gap Up Gain on Prior Session Triggered Technical Buy Signal - 1/5/2024 |
View all notes |
Set NEW NOTE alert |
Company Profile |
SEC
News |
Chart |
Request a new note
C
A
S
I |
QLYS
-
NASDAQ
Qualys
Computer Sftwr-Security
|
$180.30
|
-3.91
-2.12% |
$184.66
|
378,456
102.56% of 50 DAV
50 DAV is 369,000
|
$206.35
-12.62%
|
11/3/2023
|
$167.50
|
PP = $165.03
|
|
MB = $173.28
|
Most Recent Note - 1/5/2024 5:14:52 PM
G - Pulled back today for an 8th consecutive loss with average volume and closed just below its 50 DMA line ($181.24) raising concerns. Only a prompt rebound above the 50 DMA line would help its outlook improve.
>>> FEATURED STOCK ARTICLE : Extended From Base Following Big Breakout - 12/12/2023 |
View all notes |
Set NEW NOTE alert |
Company Profile |
SEC
News |
Chart |
Request a new note
C
A
S
I |
AXON
-
NASDAQ
Axon Enterprise
Security/Sfty
|
$244.21
|
-0.72
-0.29% |
$246.10
|
339,720
76.00% of 50 DAV
50 DAV is 447,000
|
$260.69
-6.32%
|
11/8/2023
|
$127.84
|
PP = $223.30
|
|
MB = $234.47
|
Most Recent Note - 1/5/2024 1:30:56 PM
G - Pulling back today for a 6th consecutive loss. On pullbacks, the prior highs in the $229-231 area define near-term support to watch coinciding with its 50-day moving average (DMA) line ($232).
>>> FEATURED STOCK ARTICLE : Axon Enterprise Hits New High With 6th Straight Gain - 12/13/2023 |
View all notes |
Set NEW NOTE alert |
Company Profile |
SEC
News |
Chart |
Request a new note
C
A
S
I |
TDG
-
NYSE
TransDigm Group
Aerospace/Defense
|
$978.61
|
+3.08
0.32% |
$986.76
|
215,530
94.53% of 50 DAV
50 DAV is 228,000
|
$1,018.50
-3.92%
|
12/12/2023
|
$1,000.39
|
PP = $1,013.18
|
|
MB = $1,063.84
|
Most Recent Note - 1/2/2024 6:26:48 PM
Y - Pulled back today with near-average (higher) volume. The new pivot point cited was based on its 11/14/23 high plus 10 cents, however, recent gains above the pivot point were not backed by the +40% above-average volume necessary to trigger a proper new technical buy signal. Fundamentals remain strong. Recent lows in the $950 area define near-term support to watch on pullbacks.
>>> FEATURED STOCK ARTICLE : Volume-Driven Loss Breaks Streak of 6 Straight Gains - 12/14/2023 |
View all notes |
Set NEW NOTE alert |
Company Profile |
SEC
News |
Chart |
Request a new note
C
A
S
I |
Symbol/Exchange
Company Name
Industry Group |
PRICE |
CHANGE
(%Change) |
Day High |
Volume
(% DAV)
(% 50 day avg vol) |
52 Wk Hi
% From Hi |
Featured
Date |
Price
Featured |
Pivot Featured |
|
Max Buy |
PANW
-
NASDAQ
Palo Alto Networks
Computer Sftwr-Security
|
$282.93
|
-0.37
-0.13% |
$286.45
|
1,791,015
41.66% of 50 DAV
50 DAV is 4,299,000
|
$318.00
-11.03%
|
11/13/2023
|
$255.90
|
PP = $266.00
|
|
MB = $279.30
|
Most Recent Note - 1/2/2024 6:28:03 PM
G - Pulled back today with below-average volume for a 4th consecutive loss. Prior highs in the $265 area define important support to watch along with its 50 DMA line ($272). Fundamentals remain strong.
>>> FEATURED STOCK ARTICLE : Consolidating After Volume-Driven Gains for All-Time Highs - 12/15/2023 |
View all notes |
Set NEW NOTE alert |
Company Profile |
SEC
News |
Chart |
Request a new note
C
A
S
I |
URI
-
NYSE
United Rentals
Comml Svcs-Leasing
|
$541.39
|
-7.47
-1.36% |
$548.46
|
670,568
92.36% of 50 DAV
50 DAV is 726,000
|
$585.50
-7.53%
|
12/1/2023
|
$499.51
|
PP = $488.73
|
|
MB = $513.17
|
Most Recent Note - 1/3/2024 7:03:37 PM
G - Pulled back today with higher volume behind a 5th consecutive loss, reteating from its all-time high. On pullbacks, the prior highs define near-term support to watch above its 50 DMA line ($486.62).
>>> FEATURED STOCK ARTICLE : Perched Near All-Time High Following Volume-Driven Gains - 12/19/2023 |
View all notes |
Set NEW NOTE alert |
Company Profile |
SEC
News |
Chart |
Request a new note
C
A
S
I |
AMPH
-
NASDAQ
Amphastar Pharm
Medical-Biomed/Biotech
|
$62.70
|
-0.75
-1.18% |
$65.92
|
613,965
139.54% of 50 DAV
50 DAV is 440,000
|
$67.66
-7.33%
|
12/4/2023
|
$60.84
|
PP = $58.35
|
|
MB = $61.27
|
Most Recent Note - 1/5/2024 12:04:41 PM
G - No resistance remains due to overhead supply but it has reversed into the red after today's early gain had it poised for a best-ever close. Color code was changed to green after Tuesday's volume-driven gain triggered a technical buy signal and it rose above its "max buy" level. Fundamentals remain strong.
>>> FEATURED STOCK ARTICLE : Consolidating Above Pivot Point With Volume Cooling - 12/21/2023 |
View all notes |
Set NEW NOTE alert |
Company Profile |
SEC
News |
Chart |
Request a new note
C
A
S
I |
TBBK
-
NASDAQ
The Bancorp
Banks-Northeast
|
$37.62
|
-0.11
-0.29% |
$38.31
|
506,263
117.19% of 50 DAV
50 DAV is 432,000
|
$42.46
-11.40%
|
12/4/2023
|
$39.88
|
PP = $41.62
|
|
MB = $43.70
|
Most Recent Note - 1/3/2024 7:06:27 PM
G - Violated its 50 DMA line ($38.39) with higher volume behind today's 5th consecutive loss raising concerns and its color code is changed to green. A prompt rebound above the 50 DMA line is needed for its outlook to improve.
>>> FEATURED STOCK ARTICLE : Negative Reversals are Signs of Distributional Pressure - 12/22/2023 |
View all notes |
Set NEW NOTE alert |
Company Profile |
SEC
News |
Chart |
Request a new note
C
A
S
I |
LULU
-
NASDAQ
lululemon athletica
Retail-Apparel/Shoes/Acc
|
$491.10
|
-4.90
-0.99% |
$499.21
|
1,081,214
71.41% of 50 DAV
50 DAV is 1,514,000
|
$516.39
-4.90%
|
12/8/2023
|
$490.61
|
PP = $485.93
|
|
MB = $510.23
|
Most Recent Note - 1/3/2024 7:02:07 PM
Y - Quietly pulling back yet lingering near its all-time high below its "max buy" level with volume totals cooling. Its 2021 high of $485 defines initial support to watch after its recent breakout from a 2+ year base.
>>> FEATURED STOCK ARTICLE : Perched at All-Time High With Volume Totals Cooling - 12/27/2023 |
View all notes |
Set NEW NOTE alert |
Company Profile |
SEC
News |
Chart |
Request a new note
C
A
S
I |
Symbol/Exchange
Company Name
Industry Group |
PRICE |
CHANGE
(%Change) |
Day High |
Volume
(% DAV)
(% 50 day avg vol) |
52 Wk Hi
% From Hi |
Featured
Date |
Price
Featured |
Pivot Featured |
|
Max Buy |
CRWD
-
NASDAQ
CrowdStrike Holdings
Computer Sftwr-Security
|
$247.50
|
+1.85
0.75% |
$249.48
|
2,319,964
76.77% of 50 DAV
50 DAV is 3,022,000
|
$261.81
-5.47%
|
1/2/2024
|
$246.42
|
PP = $261.91
|
|
MB = $275.01
|
Most Recent Note - 1/3/2024 7:00:41 PM
Y - Pulled back from its 52-week high with today's 5th consecutive loss. Color code was changed to yellow as it formed an advanced "3-weeks tight" base with the pivot point cited based on its 12/18/23 high plus 10 cents. Subsequent gains above the pivot point backed by at least +40% above average volume may trigger a technical buy signal. Reported Oct '23 quarterly earnings +105% on +35% sales revenues versus the year-ago period, extending its streak of strong earnings increases well above the +25% minimum guideline (C criteria) in quarterly comparisons. Faces no resistance due to overhead supply. Annual earnings history has been strong. Completed its $34 IPO on 6/12/19. See the latest FSU analysis for more details and a new annotated graph.
>>> FEATURED STOCK ARTICLE : CrowdStrike Holdings Pulling Back After "3-Weeks Tight" Pattern - 1/3/2024 |
View all notes |
Set NEW NOTE alert |
Company Profile |
SEC
News |
Chart |
Request a new note
C
A
S
I |
ELF
-
NYSE
e.l.f. Beauty
Cosmetics/Personal Care
|
$138.02
|
+0.75
0.55% |
$142.75
|
1,018,472
69.85% of 50 DAV
50 DAV is 1,458,000
|
$153.53
-10.10%
|
1/2/2024
|
$138.23
|
PP = $153.63
|
|
MB = $161.31
|
Most Recent Note - 1/5/2024 1:34:04 PM
Y - Rebounding above its August high with today's gain. Pivot point cited recently was based on its 12/20/23 high plus 10 cents after forming an advanced "3 weeks tight" base. Subsequent volume-driven gains for new highs are needed to trigger a technical buy signal. Reported Sep '23 quarterly earnings +128% on +76% sales revenues versus the year-ago period, adding to its streak of very strong quarterly results well above the +25% minimum earnings guideline (C criteria). Annual earnings (A criteria) history over the past 3 years has been strong, making it a better match with the fact-based investment system's fundamental guidelines.
>>> FEATURED STOCK ARTICLE : Pulled Back After Closing 3 Weeks Tight - 1/2/2024 |
View all notes |
Set NEW NOTE alert |
Company Profile |
SEC
News |
Chart |
Request a new note
C
A
S
I |
|
|
|
THESE ARE NOT BUY RECOMMENDATIONS!
Comments contained in the body of this report are technical
opinions only. The material herein has been obtained
from sources believed to be reliable and accurate, however,
its accuracy and completeness cannot be guaranteed.
This site is not an investment advisor, hence it does
not endorse or recommend any securities or other investments.
Any recommendation contained in this report may not
be suitable for all investors and it is not to be deemed
an offer or solicitation on our part with respect to
the purchase or sale of any securities. All trademarks,
service marks and trade names appearing in this report
are the property of their respective owners, and are
likewise used for identification purposes only.
This report is a service available
only to active Paid Premium Members.
You may opt-out of receiving report notifications
at any time. Questions or comments may be submitted
by writing to Premium Membership Services 665 S.E. 10 Street, Suite 201 Deerfield Beach, FL 33441-5634 or by calling 1-800-965-8307
or 954-785-1121.
|
|
|