You are not logged in.
This means you
CAN ONLY VIEW reports that were published prior to Tuesday, March 25, 2025.
You
MUST UPGRADE YOUR MEMBERSHIP if you want to see any current reports.
AFTER MARKET UPDATE - MONDAY, JANUARY 8TH, 2024
Previous After Market Report Next After Market Report >>>
|
|
|
|
DOW |
+216.90 |
37,683.01 |
+0.58% |
|
Volume |
917,771,976 |
-6% |
|
Volume |
6,380,997,900 |
+21% |
|
NASDAQ |
+319.70 |
14,843.77 |
+2.20% |
|
Advancers |
2,132 |
76% |
|
Advancers |
3,012 |
70% |
|
S&P 500 |
+66.30 |
4,763.54 |
+1.41% |
|
Decliners |
686 |
24% |
|
Decliners |
1,296 |
30% |
|
Russell 2000 |
+37.86 |
1,989.01 |
+1.94% |
|
52 Wk Highs |
56 |
|
|
52 Wk Highs |
106 |
|
|
S&P 600 |
+20.72 |
1,291.38 |
+1.63% |
|
52 Wk Lows |
26 |
|
|
52 Wk Lows |
94 |
|
|
 |
Breadth Positive as Major Inidices Rose
Kenneth J. Gruneisen - Passed the CAN SLIM® Master's Exam
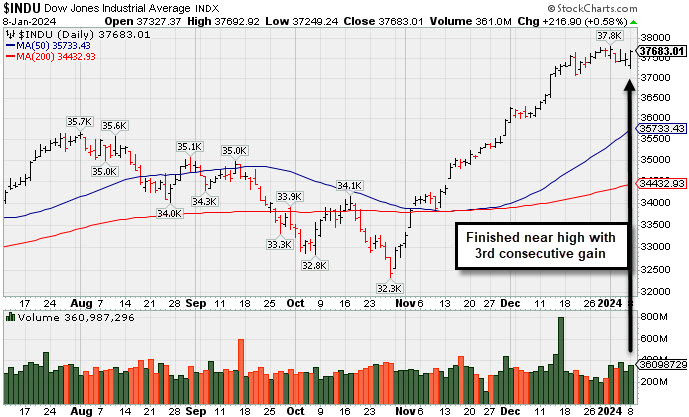
The Dow Jones Industrial Average was a relative underperformer, logging only a +0.6% gain while the S&P 500 posted a +1.4% gain. The Russell 2000 climbed +1.9% and the Nasdaq Composite jumped +2.2%. Volume was reported mixed, lighter than the prior session total on the NYSE and higher on the Nasdaq exchange. Advancers led decliners by a 3-1 margin on the NYSE and by a 5-2 margin on the Nasdaq exchange. There were 21 high-ranked companies from the Leaders List that hit new 52-week highs and were listed on the BreakOuts Page, versus the total of 22 on the prior session. New 52-week highs outnumbered new 52-week lows on the NYSE and on the Nasdaq exchange. The major indices are in a confirmed uptrend (M criteria). New buying efforts should be only made in stocks fitting all key criteria of the fact-based investment system.
PICTURED: The Dow Jones Industrial Average finished near the session high with a 3rd straight gain. The major indices all rallied following last week's losses, which saw the market break its nine-week win streak. Boeing (BA -8.03%) fell after 737 MAX 9 jets were grounded after a fuselage blowout on an Alaska Airlines (ALK -0.21%) flight. United Airlines (UAL +2.78%) rose although some loose bolts were found on plug doors during its Boeing 737 Max 9 inspections. Semiconductor stocks were a pocket of strength.
There was a drop in crude oil prices ($70.82/bbl, -2.91, -3.9%) after a Bloomberg report indicating Saudi Arabia is aiming to cut crude prices for February in all regions because of weak demand.The move in oil weighed on the S&P 500 energy sector (-1.2%), which was the lone laggard to close with a loss.
The heavily-weighted information technology (+2.8%), consumer discretionary (+1.8%), and communication services (+1.7%) sectors outperformed. The rate-sensitive real estate sector (+1.4%) also rose. Treasuries settled off their highs of the day. The 2-yr note yield fell four basis points to 4.35%. The 10-yr note yield declined four basis points to 4.00%.
|
 Kenneth J. Gruneisen started out as a licensed stockbroker in August 1987, a couple of months prior to the historic stock market crash that took the Dow Jones Industrial Average down -22.6% in a single day. He has published daily fact-based fundamental and technical analysis on high-ranked stocks online for two decades. Through FACTBASEDINVESTING.COM, Kenneth provides educational articles, news, market commentary, and other information regarding proven investment systems that work in good times and bad.
Comments contained in the body of this report are technical opinions only and are not necessarily those of Gruneisen Growth Corp. The material herein has been obtained from sources believed to be reliable and accurate, however, its accuracy and completeness cannot be guaranteed. Our firm, employees, and customers may effect transactions, including transactions contrary to any recommendation herein, or have positions in the securities mentioned herein or options with respect thereto. Any recommendation contained in this report may not be suitable for all investors and it is not to be deemed an offer or solicitation on our part with respect to the purchase or sale of any securities. |
|
 |
Broker/Dealer, Retail, and Tech Indexes Led Group Gainers
Kenneth J. Gruneisen - Passed the CAN SLIM® Master's Exam
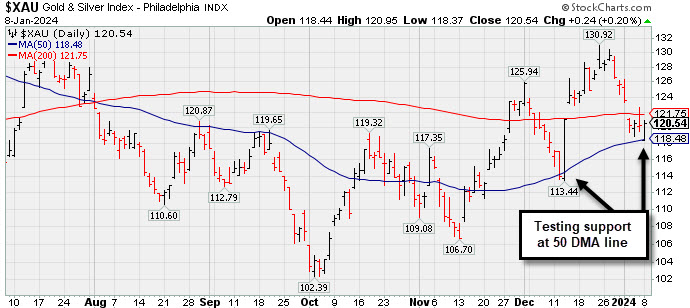
The Retail Index ($RLX +2.13%) outpaced the Broker/Dealer Index ($XBD +1.10%) and the Bank Index ($BKX +0.35%) on Monday. The tech sector had a positive bias led by the Semiconductor Index ($SOX +3.28%) while the Networking Index ($NWX +2.02%) and the Biotech Index ($BTK +1.86%) both posted solid gains. Energy-linked groups were laggards as the Integrated Oil Index ($XOI -0.89%) and the Oil Services Index ($OSX -2.11%) both slumped.
PICTURED: The Gold & Silver Index ($XAU +0.20%) is consolidating and testing support at its 50-day moving average (DMA) line.
| Oil Services |
$OSX |
81.14 |
-1.75 |
-2.11% |
-3.26% |
| Integrated Oil |
$XOI |
1,863.39 |
-16.66 |
-0.89% |
+0.05% |
| Semiconductor |
$SOX |
4,062.48 |
+128.99 |
+3.28% |
-2.71% |
| Networking |
$NWX |
818.58 |
+16.23 |
+2.02% |
-1.71% |
| Broker/Dealer |
$XBD |
555.90 |
+6.03 |
+1.10% |
-0.25% |
| Retail |
$RLX |
3,832.52 |
+79.82 |
+2.13% |
-1.45% |
| Gold & Silver |
$XAU |
120.54 |
+0.24 |
+0.20% |
-4.10% |
| Bank |
$BKX |
97.48 |
+0.34 |
+0.35% |
+1.52% |
| Biotech |
$BTK |
5,511.46 |
+100.65 |
+1.86% |
+1.71% |
|
|
|
 |
Posted Light Volume Gain Finding Support at 50-Day Moving Average
Kenneth J. Gruneisen - Passed the CAN SLIM® Master's Exam
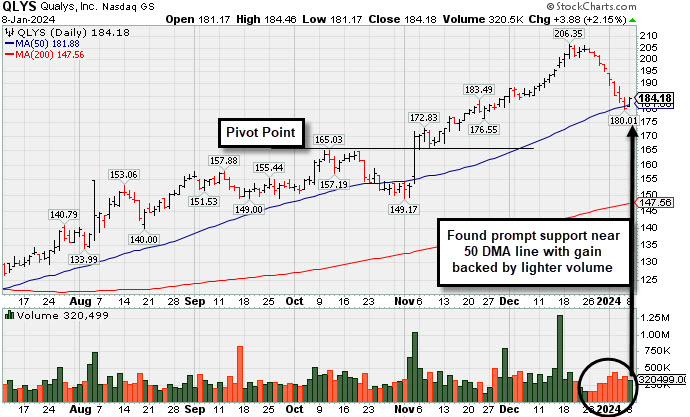
Qualys Inc (QLYS +$3.88 or +2.15% to $184.18) posted a gain today with lighter than average volume, finding prompt support near its 50-day moving average (DMA) line ($181.88). The prior session low ($180.01) defines important near-term support to watch where more damaging losses would raise greater concerns.
QLYS finished strong after highlighted in yellow in the 11/03/23 mid-day report (read here) with pivot point cited based on its 10/11/23 high after a cup-with-handle base. The gap up and considerable gain had it hitting new 52-week and all-time highs triggering a technical buy signal. QLYS was last shown in this FSU section on 12/12/23 with an annotated graph under the headline, "Extended From Base Following Big Breakout".
QLYS reported Sep '23 quarterly earnings +61% on +13% sales revenues versus the year ago period, its 2nd strong quarterly comparison well above the +25% minimum earnings guideline (C criteria). It has a 99 Earnings Per Share Rating. Its annual earnings history (A criteria) has also been very strong and steady. The Computer Software - Security group is currently ranked 11th on the 197 Industry Groups list, and leadership (L criteria) in the industry group is another favorable factor with respect to the fact-based investment system.
QLYS has a Relative Strength Rating of 92, well above the 80+ minimum guideline for buy candidates. Currently it has a Timeliness Rating of A but a Sponsorship Rating of D. Its Accumulation/Distribution rating is C+ while its Up/Down Volume Ratio of 2.1 is an unbiased indication its shares have been under accumulation over the past 50 days. The number of top-rated funds owning its shares rose from 294 in Jun '17 to 744 in Sep '23, a reassuring sign concerning the I criteria. Its small supply of only 36 million shares (S criteria) in the public float can contribute to greater volatility in the event of institutional buying or selling.
|
|
|
Color Codes Explained :
Y - Better candidates highlighted by our
staff of experts.
G - Previously featured
in past reports as yellow but may no longer be buyable under the
guidelines.
***Last / Change / Volume data in this table is the closing quote data***
Symbol/Exchange
Company Name
Industry Group |
PRICE |
CHANGE
(%Change) |
Day High |
Volume
(% DAV)
(% 50 day avg vol) |
52 Wk Hi
% From Hi |
Featured
Date |
Price
Featured |
Pivot Featured |
|
Max Buy |
 ANET
-
NYSE
ANET
-
NYSE
Arista Networks
Computer-Networking
|
$245.85
|
+14.93
6.47% |
$245.89
|
2,214,488
106.31% of 50 DAV
50 DAV is 2,083,000
|
$240.68
2.15%
|
10/31/2023
|
$188.84
|
PP = $198.80
|
|
MB = $208.74
|
 Most Recent Note - 1/8/2024 10:38:44 AM
G - Gapped up today and rallied to hit a new all-time high. Its 50 DMA line ($219) defines near-term support above the prior low in the $210 area. Fundamentals remain strong.
>>> FEATURED STOCK ARTICLE : Extended From Base and Hovering at All-Time High - 12/26/2023 |
View all notes |
Set NEW NOTE alert |
Company Profile |
SEC
News |
Chart |
Request a new note
C
A
S
I |
NVO
-
NYSE
Novo Nordisk ADR
Medical-Ethical Drugs
|
$106.40
|
+0.42
0.40% |
$106.54
|
2,869,301
68.28% of 50 DAV
50 DAV is 4,202,000
|
$108.98
-2.37%
|
11/2/2023
|
$100.97
|
PP = $104.10
|
|
MB = $109.31
|
Most Recent Note - 1/5/2024 5:13:14 PM
Y - Pulled back today with average volume. Gap up and volume-driven gain on the prior session triggered a technical buy signal while hitting a new all-time high. Prior highs in the $105 area define initial support above its 50 DMA line ($100.42) See the latest FSU analysis for more details and a new annotated graph.
>>> FEATURED STOCK ARTICLE : Gap Up Gain on Prior Session Triggered Technical Buy Signal - 1/5/2024 |
View all notes |
Set NEW NOTE alert |
Company Profile |
SEC
News |
Chart |
Request a new note
C
A
S
I |
QLYS
-
NASDAQ
Qualys
Computer Sftwr-Security
|
$184.18
|
+3.88
2.15% |
$184.46
|
320,658
86.20% of 50 DAV
50 DAV is 372,000
|
$206.35
-10.74%
|
11/3/2023
|
$167.50
|
PP = $165.03
|
|
MB = $173.28
|
Most Recent Note - 1/8/2024 5:38:37 PM
G - Found prompt support near its 50 DMA line ($181.88) and posted a gain today with light volume breaking a streak of 8 consecutive losses. The prior session low ($180.01) defines important near-term support where more damaging losses would raise concerns. See the latest FSU analysis for more details and a new annotated graph.
>>> FEATURED STOCK ARTICLE : Posted Light Volume Gain Finding Support at 50-Day Moving Average - 1/8/2024 |
View all notes |
Set NEW NOTE alert |
Company Profile |
SEC
News |
Chart |
Request a new note
C
A
S
I |
AXON
-
NASDAQ
Axon Enterprise
Security/Sfty
|
$251.48
|
+7.27
2.98% |
$251.75
|
344,010
76.62% of 50 DAV
50 DAV is 449,000
|
$260.69
-3.53%
|
11/8/2023
|
$127.84
|
PP = $223.30
|
|
MB = $234.47
|
Most Recent Note - 1/8/2024 5:40:53 PM
G - Posted a solid gain today with lighter volume breaking a streak of 6 consecutive losses. On pullbacks, its 50-day moving average (DMA) line ($233) defines support above prior highs in the $229-231 area.
>>> FEATURED STOCK ARTICLE : Axon Enterprise Hits New High With 6th Straight Gain - 12/13/2023 |
View all notes |
Set NEW NOTE alert |
Company Profile |
SEC
News |
Chart |
Request a new note
C
A
S
I |
TDG
-
NYSE
TransDigm Group
Aerospace/Defense
|
$997.18
|
+18.57
1.90% |
$997.81
|
257,157
112.30% of 50 DAV
50 DAV is 229,000
|
$1,018.50
-2.09%
|
12/12/2023
|
$1,000.39
|
PP = $1,013.18
|
|
MB = $1,063.84
|
Most Recent Note - 1/8/2024 5:46:10 PM
Y - Posted a 3rd consecutive gain today with higher volume. The new pivot point cited was based on its 11/14/23 high plus 10 cents, however, recent gains above the pivot point were not backed by the +40% above-average volume necessary to trigger a proper new technical buy signal. Fundamentals remain strong. Its recent low ($972.08 on 1/03/24) defines near-term support to watch above its 50 DMA line ($957.46).
>>> FEATURED STOCK ARTICLE : Volume-Driven Loss Breaks Streak of 6 Straight Gains - 12/14/2023 |
View all notes |
Set NEW NOTE alert |
Company Profile |
SEC
News |
Chart |
Request a new note
C
A
S
I |
Symbol/Exchange
Company Name
Industry Group |
PRICE |
CHANGE
(%Change) |
Day High |
Volume
(% DAV)
(% 50 day avg vol) |
52 Wk Hi
% From Hi |
Featured
Date |
Price
Featured |
Pivot Featured |
|
Max Buy |
PANW
-
NASDAQ
Palo Alto Networks
Computer Sftwr-Security
|
$289.50
|
+6.57
2.32% |
$290.74
|
2,900,889
67.60% of 50 DAV
50 DAV is 4,291,000
|
$318.00
-8.96%
|
11/13/2023
|
$255.90
|
PP = $266.00
|
|
MB = $279.30
|
Most Recent Note - 1/8/2024 5:43:10 PM
G - Posted a gain today with below-average volume breaking a streak of 7 consecutive losses with below-average volume. Its 50 DMA line ($275.53) defines near-term support above prior highs in the $265 area. Fundamentals remain strong.
>>> FEATURED STOCK ARTICLE : Consolidating After Volume-Driven Gains for All-Time Highs - 12/15/2023 |
View all notes |
Set NEW NOTE alert |
Company Profile |
SEC
News |
Chart |
Request a new note
C
A
S
I |
URI
-
NYSE
United Rentals
Comml Svcs-Leasing
|
$550.83
|
+9.44
1.74% |
$551.77
|
484,790
67.05% of 50 DAV
50 DAV is 723,000
|
$585.50
-5.92%
|
12/1/2023
|
$499.51
|
PP = $488.73
|
|
MB = $513.17
|
Most Recent Note - 1/3/2024 7:03:37 PM
G - Pulled back today with higher volume behind a 5th consecutive loss, reteating from its all-time high. On pullbacks, the prior highs define near-term support to watch above its 50 DMA line ($486.62).
>>> FEATURED STOCK ARTICLE : Perched Near All-Time High Following Volume-Driven Gains - 12/19/2023 |
View all notes |
Set NEW NOTE alert |
Company Profile |
SEC
News |
Chart |
Request a new note
C
A
S
I |
AMPH
-
NASDAQ
Amphastar Pharm
Medical-Biomed/Biotech
|
$59.45
|
-3.29
-5.24% |
$63.96
|
964,735
217.28% of 50 DAV
50 DAV is 444,000
|
$67.66
-12.13%
|
12/4/2023
|
$60.84
|
PP = $58.35
|
|
MB = $61.27
|
Most Recent Note - 1/8/2024 12:21:50 PM
Y - Rebounded from the early low after abruptly retreating today with higher volume following a noted "negative reversal" on the prior session. Color code was changed to yellow while trading back near the pivot point. More damaging losses would raise greater concerns. Fundamentals remain strong.
>>> FEATURED STOCK ARTICLE : Consolidating Above Pivot Point With Volume Cooling - 12/21/2023 |
View all notes |
Set NEW NOTE alert |
Company Profile |
SEC
News |
Chart |
Request a new note
C
A
S
I |
TBBK
-
NASDAQ
The Bancorp
Banks-Northeast
|
$38.25
|
+0.63
1.67% |
$38.25
|
289,226
67.73% of 50 DAV
50 DAV is 427,000
|
$42.46
-9.92%
|
12/4/2023
|
$39.88
|
PP = $41.62
|
|
MB = $43.70
|
Most Recent Note - 1/3/2024 7:06:27 PM
G - Violated its 50 DMA line ($38.39) with higher volume behind today's 5th consecutive loss raising concerns and its color code is changed to green. A prompt rebound above the 50 DMA line is needed for its outlook to improve.
>>> FEATURED STOCK ARTICLE : Negative Reversals are Signs of Distributional Pressure - 12/22/2023 |
View all notes |
Set NEW NOTE alert |
Company Profile |
SEC
News |
Chart |
Request a new note
C
A
S
I |
LULU
-
NASDAQ
lululemon athletica
Retail-Apparel/Shoes/Acc
|
$491.48
|
+0.38
0.08% |
$493.49
|
1,825,502
121.30% of 50 DAV
50 DAV is 1,505,000
|
$516.39
-4.82%
|
12/8/2023
|
$490.61
|
PP = $485.93
|
|
MB = $510.23
|
Most Recent Note - 1/3/2024 7:02:07 PM
Y - Quietly pulling back yet lingering near its all-time high below its "max buy" level with volume totals cooling. Its 2021 high of $485 defines initial support to watch after its recent breakout from a 2+ year base.
>>> FEATURED STOCK ARTICLE : Perched at All-Time High With Volume Totals Cooling - 12/27/2023 |
View all notes |
Set NEW NOTE alert |
Company Profile |
SEC
News |
Chart |
Request a new note
C
A
S
I |
Symbol/Exchange
Company Name
Industry Group |
PRICE |
CHANGE
(%Change) |
Day High |
Volume
(% DAV)
(% 50 day avg vol) |
52 Wk Hi
% From Hi |
Featured
Date |
Price
Featured |
Pivot Featured |
|
Max Buy |
CRWD
-
NASDAQ
CrowdStrike Holdings
Computer Sftwr-Security
|
$261.28
|
+13.82
5.58% |
$261.64
|
4,000,081
131.84% of 50 DAV
50 DAV is 3,034,000
|
$261.81
-0.20%
|
1/2/2024
|
$246.42
|
PP = $261.91
|
|
MB = $275.01
|
Most Recent Note - 1/8/2024 10:39:56 AM
Y - Gapped up today rebounding near its 52-week high. Color code was changed to yellow as it formed an advanced "3-weeks tight" base with the pivot point cited based on its 12/18/23 high plus 10 cents. Subsequent gains above the pivot point backed by at least +40% above average volume may trigger a technical buy signal. Reported Oct '23 quarterly earnings +105% on +35% sales revenues versus the year-ago period, extending its streak of strong earnings increases well above the +25% minimum guideline (C criteria) in quarterly comparisons. Faces no resistance due to overhead supply. Annual earnings history has been strong. Completed its $34 IPO on 6/12/19.
>>> FEATURED STOCK ARTICLE : CrowdStrike Holdings Pulling Back After "3-Weeks Tight" Pattern - 1/3/2024 |
View all notes |
Set NEW NOTE alert |
Company Profile |
SEC
News |
Chart |
Request a new note
C
A
S
I |
ELF
-
NYSE
e.l.f. Beauty
Cosmetics/Personal Care
|
$150.65
|
+12.63
9.15% |
$152.60
|
1,643,218
112.86% of 50 DAV
50 DAV is 1,456,000
|
$153.53
-1.88%
|
1/2/2024
|
$138.23
|
PP = $153.63
|
|
MB = $161.31
|
Most Recent Note - 1/8/2024 10:41:01 AM
Y - Rebounding near its prior high with today's big 3rd consecutive gain. Pivot point cited recently was based on its 12/20/23 high plus 10 cents after forming an advanced "3 weeks tight" base. Subsequent volume-driven gains for new highs are needed to trigger a technical buy signal. Reported Sep '23 quarterly earnings +128% on +76% sales revenues versus the year-ago period, adding to its streak of very strong quarterly results well above the +25% minimum earnings guideline (C criteria). Annual earnings (A criteria) history over the past 3 years has been strong, making it a better match with the fact-based investment system's fundamental guidelines.
>>> FEATURED STOCK ARTICLE : Pulled Back After Closing 3 Weeks Tight - 1/2/2024 |
View all notes |
Set NEW NOTE alert |
Company Profile |
SEC
News |
Chart |
Request a new note
C
A
S
I |
|
|
|
THESE ARE NOT BUY RECOMMENDATIONS!
Comments contained in the body of this report are technical
opinions only. The material herein has been obtained
from sources believed to be reliable and accurate, however,
its accuracy and completeness cannot be guaranteed.
This site is not an investment advisor, hence it does
not endorse or recommend any securities or other investments.
Any recommendation contained in this report may not
be suitable for all investors and it is not to be deemed
an offer or solicitation on our part with respect to
the purchase or sale of any securities. All trademarks,
service marks and trade names appearing in this report
are the property of their respective owners, and are
likewise used for identification purposes only.
This report is a service available
only to active Paid Premium Members.
You may opt-out of receiving report notifications
at any time. Questions or comments may be submitted
by writing to Premium Membership Services 665 S.E. 10 Street, Suite 201 Deerfield Beach, FL 33441-5634 or by calling 1-800-965-8307
or 954-785-1121.
|
|
|