You are not logged in.
This means you
CAN ONLY VIEW reports that were published prior to Tuesday, March 25, 2025.
You
MUST UPGRADE YOUR MEMBERSHIP if you want to see any current reports.
AFTER MARKET UPDATE - WEDNESDAY, DECEMBER 27TH, 2023
Previous After Market Report Next After Market Report >>>
|
|
|
|
DOW |
+111.19 |
37,656.52 |
+0.30% |
|
Volume |
665,912,628 |
+13% |
|
Volume |
7,532,058,600 |
+17% |
|
NASDAQ |
+24.60 |
15,099.18 |
+0.16% |
|
Advancers |
1,661 |
60% |
|
Advancers |
2,497 |
58% |
|
S&P 500 |
+6.83 |
4,781.58 |
+0.14% |
|
Decliners |
1,097 |
40% |
|
Decliners |
1,787 |
42% |
|
Russell 2000 |
+7.02 |
2,066.21 |
+0.34% |
|
52 Wk Highs |
227 |
|
|
52 Wk Highs |
397 |
|
|
S&P 600 |
+4.95 |
1,339.63 |
+0.37% |
|
52 Wk Lows |
4 |
|
|
52 Wk Lows |
80 |
|
|
 |
Major Indices Inched Higher Still
Kenneth J. Gruneisen - Passed the CAN SLIM® Master's Exam
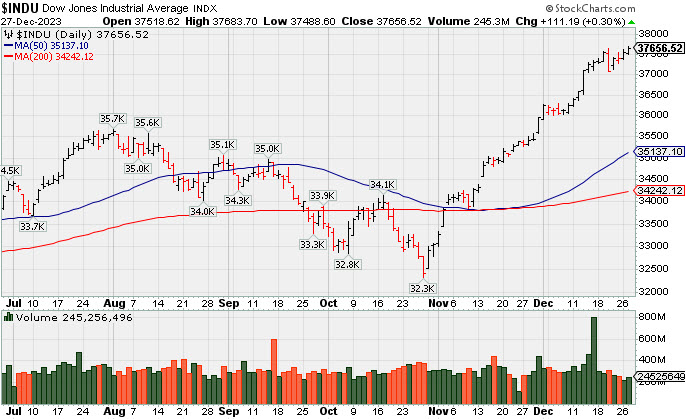
The S&P 500 rose +0.1%, the Nasdaq Composite closed up +0.2%, and the Dow Jones Industrial Average posted a +0.3% gain. Volume was reported higher than the prior session total on the NYSE and on the Nasdaq exchange. Breadth was positive as advancers led decliners by a 3-2 margin on the NYSE and by 4-3 on the Nasdaq exchange. There were 116 high-ranked companies from the Leaders List that hit new 52-week highs and were listed on the BreakOuts Page, versus the total of 110 on the prior session. New 52-week highs totals solidly outnumbered new 52-week lows totals on the NYSE and on the Nasdaq exchange. The major indices are in a confirmed uptrend (M criteria). New buying efforts should be only made in stocks fitting all key criteria of the fact-based investment system.
PICTURED: The Dow Jones Industrial Average is perched at its all-time record high. The real estate (+0.5%) and health care (+0.5%) sectors were top gainers, meanwhile the energy sector declined -0.5%. A fresh $58 billion 5-yr Treasury note sale met excellent demand. The 2-yr note yield declined 12 basis points to 4.23% and the 10-yr note yield fell ten basis points to 3.79%.
The Richmond Fed Manufacturing Index for December came in at -11, down from -5 that was reported in November. The dividing line between expansion and contraction for this series is 0.0, so the December reading reflects an acceleration in the rate of contraction for manufacturing activity in the Richmond Fed region.
|
 Kenneth J. Gruneisen started out as a licensed stockbroker in August 1987, a couple of months prior to the historic stock market crash that took the Dow Jones Industrial Average down -22.6% in a single day. He has published daily fact-based fundamental and technical analysis on high-ranked stocks online for two decades. Through FACTBASEDINVESTING.COM, Kenneth provides educational articles, news, market commentary, and other information regarding proven investment systems that work in good times and bad.
Comments contained in the body of this report are technical opinions only and are not necessarily those of Gruneisen Growth Corp. The material herein has been obtained from sources believed to be reliable and accurate, however, its accuracy and completeness cannot be guaranteed. Our firm, employees, and customers may effect transactions, including transactions contrary to any recommendation herein, or have positions in the securities mentioned herein or options with respect thereto. Any recommendation contained in this report may not be suitable for all investors and it is not to be deemed an offer or solicitation on our part with respect to the purchase or sale of any securities. |
|
 |
Financial, Biotech, and Gold & Silver Indexes Rose
Kenneth J. Gruneisen - Passed the CAN SLIM® Master's Exam
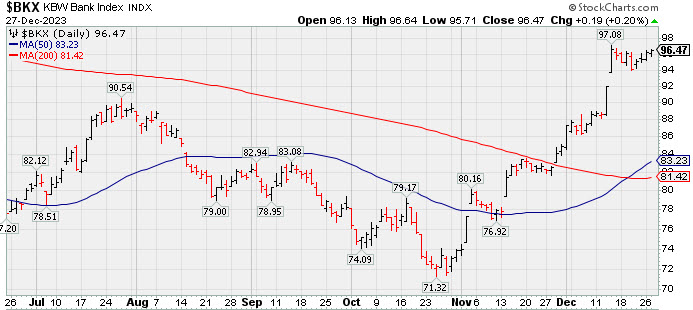
The Broker/Dealer Index ($XBD +0.72%) and Bank Index ($BKX +0.20%) each posted gains while the Retail Index ($RLX -0.01%) finished flat. The tech sector had a slightly positive bias as Biotech Index ($BTK +0.89%) outpaced the Semiconductor Index ($SOX +0.17%) and the Networking Index ($NWX +0.10%). Commodity-linked groups were mixed as the Integrated Oil Index ($XOI -0.54%) and the Oil Services Index ($OSX -0.90%) both fell while the Gold & Silver Index ($XAU +1.00%) posted a gain.
PICTURED: The Bank Index ($BKX +0.20%) has been consolidating in a tight range. It recently rallied above its July high and its 50-day moving average (DMA) line rose above its 200 DMA line, a bullish technical signal termed a "golden cross".
| Oil Services |
$OSX |
86.07 |
-0.78 |
-0.90% |
+2.63% |
| Integrated Oil |
$XOI |
1,897.65 |
-10.38 |
-0.54% |
+6.18% |
| Semiconductor |
$SOX |
4,214.59 |
+7.14 |
+0.17% |
+66.45% |
| Networking |
$NWX |
836.80 |
+0.83 |
+0.10% |
+6.83% |
| Broker/Dealer |
$XBD |
559.38 |
+4.02 |
+0.72% |
+24.55% |
| Retail |
$RLX |
3,910.14 |
-0.37 |
-0.01% |
+41.98% |
| Gold & Silver |
$XAU |
129.58 |
+1.28 |
+1.00% |
+7.22% |
| Bank |
$BKX |
96.47 |
+0.19 |
+0.20% |
-4.34% |
| Biotech |
$BTK |
5,435.94 |
+48.07 |
+0.89% |
+2.93% |
|
|
|
 |
Perched at All-Time High With Volume Totals Cooling
Kenneth J. Gruneisen - Passed the CAN SLIM® Master's Exam
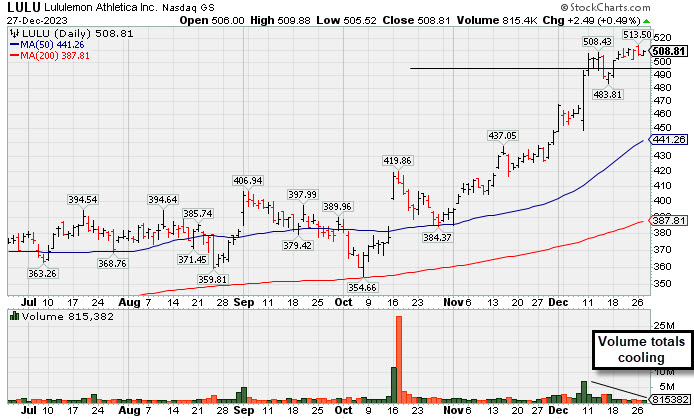
Lululemon Athletica (LULU +$2.49 or +0.49% to $508.81) is hovering at its all-time high with light volume totals recently. Its 2021 high of $485 defines initial support to watch after its recent breakout from a 2+ year base. LULU was highlighted in yellow in the 12/08/23 mid-day report (read here) with pivot point cited based on its Nov '21 high plus 10 cents. It hit new 52-week and all-time highs with a considerable gain backed by +222% above average volume triggering a technical buy signal. LULU was shown in greater detail in this FSU section that evening with an annotated graph on under the headline, "Lululemon Breaks Out to New All-Time High".
LULU reported Oct '23 quarterly earnings +27% on +19% sales revenues versus the year-ago period. Three of the 4 latest quarterly comparisons were above the +25% minimum earnings guideline (C criteria). Annual earnings (A criteria) had a downturn in FY '21. It currently has a 98 Earnings Per Share Rating. Its Timeliness rating is A and Sponsorship rating is C. The current Up/Down Volume Ratio of 1.1 is an unbiased indication its shares have been under slight accumulation over the past 50 days. The number of top-rated funds owning its shares rose from 2,100 in Mar '23 to 2,209 in Sep '23, a good sign concerning the I criteria.
Charts courtesy of www.stockcharts.com
Symbol/Exchange
Company Name
Industry Group | PRICE | CHANGE
(%Change) | Day High | Volume
(% DAV)
(% 50 day avg vol) | 52 Wk Hi
% From Hi | Featured
Date | Price
Featured | Pivot Featured | | Max Buy |  ANET - NYSE ANET - NYSE
Arista Networks
Computer-Networking | $237.76 | +0.23
0.10% | $239.00 | 604,355
27.68% of 50 DAV
50 DAV is 2,183,000 | $240.68
-1.21%
| 10/31/2023 | $188.84 | PP = $198.80 | | MB = $208.74 | Most Recent Note - 12/26/2023 8:38:00 PM
G - Hovering near its all-time high, extended from any sound base. Its 50 DMA line ($212) defines near-term support above the prior low in the $210 area. Fundamentals remain strong. See the latest FSU analysis for more details and a new annotated graph.
>>> FEATURED STOCK ARTICLE : Extended From Base and Hovering at All-Time High - 12/26/2023 | View all notes | Set NEW NOTE alert | Company Profile | SEC News | Chart | Request a new note C A S I | NVO - NYSE
Novo Nordisk ADR
Medical-Ethical Drugs | $103.69 | +1.01
0.98% | $103.81 | 2,247,736
53.05% of 50 DAV
50 DAV is 4,237,000 | $105.69
-1.89%
| 11/2/2023 | $100.97 | PP = $104.10 | | MB = $109.31 | Most Recent Note - 12/21/2023 4:58:05 PM
Y - Posted a 4th consecutive gain today, wedging further above its 50 DMA line ($99.59) toward its high. Its 50 DMA line defines initial support above the recent low ($94.73 on 12/11/23) on pullbacks.
>>> FEATURED STOCK ARTICLE : Managed a "Positive Reversal" but Still Below 50-Day Moving Average - 12/11/2023 | View all notes | Set NEW NOTE alert | Company Profile | SEC News | Chart | Request a new note C A S I | QLYS - NASDAQ
Qualys
Computer Sftwr-Security | $201.61 | -1.47
-0.72% | $203.45 | 159,997
43.01% of 50 DAV
50 DAV is 372,000 | $206.35
-2.30%
| 11/3/2023 | $167.50 | PP = $165.03 | | MB = $173.28 |  Most Recent Note - 12/27/2023 5:35:13 PM Most Recent Note - 12/27/2023 5:35:13 PM
G - Pulled back today for a 2nd loss with light volume, consolidating after a streak of 10 consecutive gains for new all-time highs. It is very extended from any sound base. Its 50 DMA line ($177.60) defines initial support to watch.
>>> FEATURED STOCK ARTICLE : Extended From Base Following Big Breakout - 12/12/2023 | View all notes | Set NEW NOTE alert | Company Profile | SEC News | Chart | Request a new note C A S I | AXON - NASDAQ
Axon Enterprise
Security/Sfty | $259.21 | +1.10
0.43% | $259.95 | 340,423
76.67% of 50 DAV
50 DAV is 444,000 | $260.69
-0.57%
| 11/8/2023 | $127.84 | PP = $223.30 | | MB = $234.47 | Most Recent Note - 12/21/2023 5:01:37 PM
G - Posted a gain today with lighter volume for a best-ever close. On pullbacks, the prior highs in the $229-231 area define near-term support to watch above its 50-day moving average (DMA) line ($225.62).
>>> FEATURED STOCK ARTICLE : Axon Enterprise Hits New High With 6th Straight Gain - 12/13/2023 | View all notes | Set NEW NOTE alert | Company Profile | SEC News | Chart | Request a new note C A S I | TDG - NYSE
TransDigm Group
Aerospace/Defense | $1,007.99 | -0.98
-0.10% | $1,012.44 | 148,269
65.03% of 50 DAV
50 DAV is 228,000 | $1,015.72
-0.76%
| 12/12/2023 | $1,000.39 | PP = $1,013.18 | | MB = $1,063.84 | Most Recent Note - 12/26/2023 8:41:22 PM
Y - Posted a 3rd consecutive gain backed by light volume for its second-best ever close. The new pivot point cited was based on its 11/14/23 high plus 10 cents, however, gains above the pivot point were not backed by the +40% above-average volume necessary to trigger a proper new technical buy signal. Fundamentals remain strong. Recent lows in the $950 area define near-term support to watch on pullbacks.
>>> FEATURED STOCK ARTICLE : Volume-Driven Loss Breaks Streak of 6 Straight Gains - 12/14/2023 | View all notes | Set NEW NOTE alert | Company Profile | SEC News | Chart | Request a new note C A S I | Symbol/Exchange
Company Name
Industry Group | PRICE | CHANGE
(%Change) | Day High | Volume
(% DAV)
(% 50 day avg vol) | 52 Wk Hi
% From Hi | Featured
Date | Price
Featured | Pivot Featured | | Max Buy | PANW - NASDAQ
Palo Alto Networks
Computer Sftwr-Security | $297.50 | -3.32
-1.10% | $300.89 | 1,821,896
41.43% of 50 DAV
50 DAV is 4,398,000 | $318.00
-6.45%
| 11/13/2023 | $255.90 | PP = $266.00 | | MB = $279.30 | Most Recent Note - 12/27/2023 5:19:13 PM
G - Pulled back today with light volume and volume totals have been cooling while still consolidating near its all-time high. Prior highs in the $265 area define important support to watch along with its 50 DMA line ($270). Fundamentals remain strong.
>>> FEATURED STOCK ARTICLE : Consolidating After Volume-Driven Gains for All-Time Highs - 12/15/2023 | View all notes | Set NEW NOTE alert | Company Profile | SEC News | Chart | Request a new note C A S I | URI - NYSE
United Rentals
Comml Svcs-Leasing | $578.86 | -1.61
-0.28% | $582.41 | 488,383
60.22% of 50 DAV
50 DAV is 811,000 | $585.50
-1.13%
| 12/1/2023 | $499.51 | PP = $488.73 | | MB = $513.17 | Most Recent Note - 12/21/2023 4:59:10 PM
G - Posted a gain today with below-average volume, hovering near its all-time high. On pullbacks, the prior highs define near-term support to watch above its 50 DMA line ($467).
>>> FEATURED STOCK ARTICLE : Perched Near All-Time High Following Volume-Driven Gains - 12/19/2023 | View all notes | Set NEW NOTE alert | Company Profile | SEC News | Chart | Request a new note C A S I | AMPH - NASDAQ
Amphastar Pharm
Medical-Biomed/Biotech | $62.96 | +0.45
0.72% | $63.67 | 306,366
72.77% of 50 DAV
50 DAV is 421,000 | $67.66
-6.95%
| 12/4/2023 | $60.84 | PP = $58.35 | | MB = $61.27 | Most Recent Note - 12/21/2023 4:55:41 PM
Y - Posted a gain with light volume today. It is above the pivot point cited based on its 11/21/23 high after a cup-with-handle base. Volume totals have been cooling while consolidating. Little resistance remains due to overhead supply. Fundamentals remain strong. See the latest FSU analysis for more details and a new annotated graph.
>>> FEATURED STOCK ARTICLE : Consolidating Above Pivot Point With Volume Cooling - 12/21/2023 | View all notes | Set NEW NOTE alert | Company Profile | SEC News | Chart | Request a new note C A S I | TBBK - NASDAQ
The Bancorp
Banks-Northeast | $39.85 | -0.50
-1.24% | $40.30 | 321,920
73.83% of 50 DAV
50 DAV is 436,000 | $42.46
-6.15%
| 12/4/2023 | $39.88 | PP = $41.62 | | MB = $43.70 | Most Recent Note - 12/22/2023 11:14:13 PM
Y - Posted a small gain on lighter volume today after 2 "negative reversals" at its all-time high sputtering back below its pivot point. Subsequent gains and a strong close above the pivot point backed by at least +40% above average volume may trigger a proper technical buy signal. See the latest FSU analysis for more details and a new annotated graph.
>>> FEATURED STOCK ARTICLE : Negative Reversals are Signs of Distributional Pressure - 12/22/2023 | View all notes | Set NEW NOTE alert | Company Profile | SEC News | Chart | Request a new note C A S I | LULU - NASDAQ
lululemon athletica
Retail-Apparel/Shoes/Acc | $508.81 | +2.49
0.49% | $509.88 | 815,440
34.10% of 50 DAV
50 DAV is 2,391,000 | $513.50
-0.91%
| 12/8/2023 | $490.61 | PP = $485.93 | | MB = $510.23 | Most Recent Note - 12/27/2023 5:33:17 PM
Y - Hovering near its all-time high but still below its "max buy" level with volume totals cooling. Its 2021 high of $485 defines initial support to watch after its recent breakout from a 2+ year base. See the latest FSU analysis for more details and a new annotated graph.
>>> FEATURED STOCK ARTICLE : Perched at All-Time High With Volume Totals Cooling - 12/27/2023 | View all notes | Set NEW NOTE alert | Company Profile | SEC News | Chart | Request a new note C A S I | Symbol/Exchange
Company Name
Industry Group | PRICE | CHANGE
(%Change) | Day High | Volume
(% DAV)
(% 50 day avg vol) | 52 Wk Hi
% From Hi | Featured
Date | Price
Featured | Pivot Featured | | Max Buy |
|
|
|
Color Codes Explained :
Y - Better candidates highlighted by our
staff of experts.
G - Previously featured
in past reports as yellow but may no longer be buyable under the
guidelines.
***Last / Change / Volume data in this table is the closing quote data***
|
|
|
THESE ARE NOT BUY RECOMMENDATIONS!
Comments contained in the body of this report are technical
opinions only. The material herein has been obtained
from sources believed to be reliable and accurate, however,
its accuracy and completeness cannot be guaranteed.
This site is not an investment advisor, hence it does
not endorse or recommend any securities or other investments.
Any recommendation contained in this report may not
be suitable for all investors and it is not to be deemed
an offer or solicitation on our part with respect to
the purchase or sale of any securities. All trademarks,
service marks and trade names appearing in this report
are the property of their respective owners, and are
likewise used for identification purposes only.
This report is a service available
only to active Paid Premium Members.
You may opt-out of receiving report notifications
at any time. Questions or comments may be submitted
by writing to Premium Membership Services 665 S.E. 10 Street, Suite 201 Deerfield Beach, FL 33441-5634 or by calling 1-800-965-8307
or 954-785-1121.
|
|
|