You are not logged in.
This means you
CAN ONLY VIEW reports that were published prior to Wednesday, March 26, 2025.
You
MUST UPGRADE YOUR MEMBERSHIP if you want to see any current reports.
AFTER MARKET UPDATE - MONDAY, JANUARY 8TH, 2018
Previous After Market Report Next After Market Report >>>
|
|
|
|
DOW |
-12.87 |
25,283.00 |
-0.05% |
|
Volume |
809,310,840 |
+5% |
|
Volume |
2,040,160,306 |
+1% |
|
NASDAQ |
+20.83 |
7,157.39 |
+0.29% |
|
Advancers |
1,706 |
58% |
|
Advancers |
1,351 |
48% |
|
S&P 500 |
+4.56 |
2,747.71 |
+0.17% |
|
Decliners |
1,227 |
42% |
|
Decliners |
1,438 |
52% |
|
Russell 2000 |
+1.80 |
1,561.81 |
+0.12% |
|
52 Wk Highs |
236 |
|
|
52 Wk Highs |
260 |
|
|
S&P 600 |
+1.01 |
950.19 |
+0.11% |
|
52 Wk Lows |
21 |
|
|
52 Wk Lows |
31 |
|
|
 |
S&P 500 Index Tallied 5th Consecutive Gain for a New Record
Kenneth J. Gruneisen - Passed the CAN SLIM® Master's Exam
Stocks were mostly higher Monday. The Dow fell 12 points to 25283. The S&P 500 was up 4 points to 2747 while the Nasdaq Composite added 20 points to 7157. Volume totals reported were higher than the prior session totals on the NYSE and on the Nasdaq exchange. Advancers led decliners by almost a 3-2 margin on the NYSE but decliners narrowly led advancers on the Nasdaq exchange. There were 101 high-ranked companies from the Leaders List that made new 52-week highs and were listed on the BreakOuts Page, versus the total of 82 on the prior session. New 52-week highs totals solidly outnumbered new 52-week lows on the NYSE and on the Nasdaq exchange. The Featured Stocks Page provides the latest analysis on noteworthy high-ranked leaders. Charts used courtesy of www.stockcharts.com
 PICTURED: The S&P 500 Index hit a new record high with a 5th consecutive gain.
The major averages (M criteria) are in a confirmed uptrend. Investors should only consider stocks meeting all key criteria of the fact-based investment system as they trigger technical buy signals.
The S&P 500 and Nasdaq rebounded from early morning lows and posted gains for the fifth consecutive session to start 2018. Investor attention is directed towards several key economic updates scheduled for later this week. Corporate profits were also in focus with fourth-quarter earnings season kicking off with several major financial firms scheduled to report Friday. On the data front, consumer credit increase by $28 billion in November, the largest monthly increase since 2001.
Nine of 11 S&P 500 sectors finished the session higher. Technology stocks helped pace gains with Nvidia (NVDA +3.06%) and Seagate Technology (STX +7.13%) both climbing on positive analyst commentary. Biotech shares underperformed as Celgene (CELG 0.77%), Biogen Inc. (BIIB -3.75%), and Shire PLC (SHPG -4.95%) each fell. Electric vehicle manufacturer Tesla (TSLA +6.26%) rose in sympathy with an analyst upgrade of lithium battery manufacturer Albemarle (ALB +4.35%) on Monday.
Treasury prices were lower along the curve as the yield on the 10-year note climbed one basis point to 2.48%. In commodities, NYMEX WTI crude gained 0.7% to $61.86/barrel. COMEX gold fell 0.2% to $1319.80/ounce. |
 Kenneth J. Gruneisen started out as a licensed stockbroker in August 1987, a couple of months prior to the historic stock market crash that took the Dow Jones Industrial Average down -22.6% in a single day. He has published daily fact-based fundamental and technical analysis on high-ranked stocks online for two decades. Through FACTBASEDINVESTING.COM, Kenneth provides educational articles, news, market commentary, and other information regarding proven investment systems that work in good times and bad.
Comments contained in the body of this report are technical opinions only and are not necessarily those of Gruneisen Growth Corp. The material herein has been obtained from sources believed to be reliable and accurate, however, its accuracy and completeness cannot be guaranteed. Our firm, employees, and customers may effect transactions, including transactions contrary to any recommendation herein, or have positions in the securities mentioned herein or options with respect thereto. Any recommendation contained in this report may not be suitable for all investors and it is not to be deemed an offer or solicitation on our part with respect to the purchase or sale of any securities. |
|
 |
Retail, Broker/Dealer, Networking, Semiconductor, and Energy Groups Rose
Kenneth J. Gruneisen - Passed the CAN SLIM® Master's Exam
The Retail Index ($RLX +0.42%) ended higher for a 5th consecutive session Monday, meanwhile the Broker/Dealer Index ($XBD +0.22%) edged higher but the Bank Index ($BKX -0.13%) edged lower. The tech sector was mixed with a positive bias shown by the Networking Index ($NWX +1.46%) and the Semiconductor Index ($SOX +0.74%) but a big loss for the Biotechnology Index ($BTK -1.17%). Commodity-linked groups were also mixed as the Gold & Silver Index ($XAU -1.26%) again ended lower while the Oil Services Index ($OSX +1.90%) outpaced the Integrated Oil Index ($XOI +0.30%). Charts courtesy wwwstockcharts.com
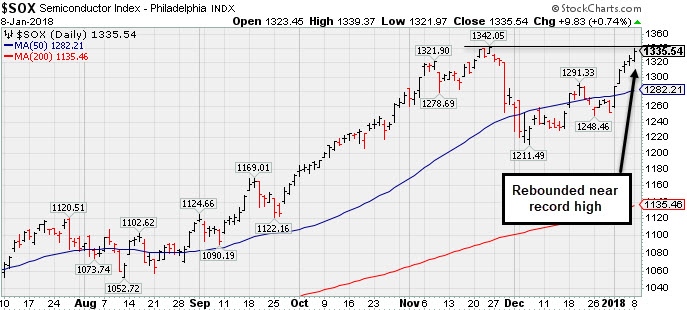 PICTURED: The Semiconductor Index ($SOX +0.74%) has rebounded near its record high.
| Oil Services |
$OSX |
160.10 |
+2.99 |
+1.90% |
+7.05% |
| Integrated Oil |
$XOI |
1,391.09 |
+4.19 |
+0.30% |
+4.16% |
| Semiconductor |
$SOX |
1,335.54 |
+9.83 |
+0.74% |
+6.58% |
| Networking |
$NWX |
508.04 |
+7.29 |
+1.46% |
+3.57% |
| Broker/Dealer |
$XBD |
272.59 |
+0.59 |
+0.22% |
+2.77% |
| Retail |
$RLX |
1,808.22 |
+7.42 |
+0.41% |
+4.29% |
| Gold & Silver |
$XAU |
86.29 |
-1.10 |
-1.26% |
+1.20% |
| Bank |
$BKX |
108.76 |
-0.14 |
-0.13% |
+1.92% |
| Biotech |
$BTK |
4,283.21 |
-50.53 |
-1.17% |
+1.44% |
|
|
|
 |
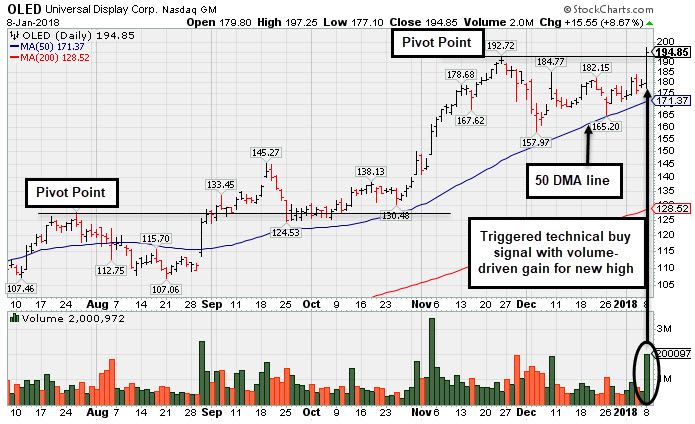
Technical Breakout With Volume-Driven Gain For New High
Kenneth J. Gruneisen - Passed the CAN SLIM® Master's Exam
Universal Display Corp (OLED +$15.55 or +8.67% to $194.85) finished strong after highlighted in yellow with new pivot point cited based on its 11/24/17 high plus 10 cents in the earlier mid-day report (read here). The gain and a strong close above the pivot point was backed by +215% above average volume triggering a convincing new (or add-on) technical buy signal. OLED found support above its 50-day moving average (DMA) line ($171.33) during its recent consolidation. Subsequent losses leading to a violation may trigger a technical sell signal.
Fundamentals remain very strong. It reported Sep '17 quarterly earnings of 28 cents per share versus a year-ago loss of 3 cents per share on sales revenues +104%. It reported +115% earnings on +59% sales revenues for the Jun '17 quarter, then marking its 3rd consecutive strong quarter above the +25% minimum guideline (C criteria), helping it better match with the fact-based investment system's fundamental guidelines. Its annual earnings (A criteria) history has been strong.
The high-ranked Electronic Products firm has earned a current Timeliness rating of A and a Sponsorship rating of B. The number of top-rated funds owning its shares rose from 355 in Sep '16 to 713 in Sep '17. Its current Up/Down Volume Ratio of 1.5 is an unbiased indication its shares have been under accumulation over the past 50 days (I criteria). Its small supply of only 45.3 million shares (S criteria) in the public float can contribute to greater volatility in the event of institutional buying or selling.
It wedged higher with gains lacking great volume conviction after since last shown in this FSU section on 12/13/17 with an annotated graph under the headline, "Consolidating After +50% Rally Since First Featured ". OLED has traded up as much as +53.8% since first highlighted in yellow at $128.22 in the 8/31/17 mid-day report (read here) with a pivot point cited based on its 7/26/17 high while then rallying from a 12-week "double bottom" base pattern. |
|
|
Color Codes Explained :
Y - Better candidates highlighted by our
staff of experts.
G - Previously featured
in past reports as yellow but may no longer be buyable under the
guidelines.
***Last / Change / Volume data in this table is the closing quote data***
Symbol/Exchange
Company Name
Industry Group |
PRICE |
CHANGE
(%Change) |
Day High |
Volume
(% DAV)
(% 50 day avg vol) |
52 Wk Hi
% From Hi |
Featured
Date |
Price
Featured |
Pivot Featured |
|
Max Buy |
THO
-
NYSE
Thor Industries Inc
AUTOMOTIVE - Recreational Vehicles
|
$153.75
|
-1.12
-0.72% |
$155.64
|
297,259
48.57% of 50 DAV
50 DAV is 612,000
|
$157.50
-2.38%
|
12/19/2017
|
$153.92
|
PP = $156.96
|
|
MB = $164.81
|
 Most Recent Note - 1/8/2018 4:11:10 PM
Y - Still holding its ground stubbornly near its all-time high with volume totals cooling. Subsequent gains above the pivot point backed by at least +40% above average volume may trigger a new (or add-on) technical buy signal. Its 50 DMA line ($144.14) defines near-term support to watch above prior highs in the $138 area. Fundamentals remain very strong.
>>> FEATURED STOCK ARTICLE : Holding Ground in Tight Range Near High - 12/27/2017 |
View all notes |
Set NEW NOTE alert |
Company Profile |
SEC
News |
Chart |
Request a new note
C
A
S
I |
ROG
-
NYSE
Rogers Corp
CONSUMER NON-DURABLES - Rubber and Plastics
|
$168.16
|
+1.46
0.88% |
$169.25
|
121,639
61.75% of 50 DAV
50 DAV is 197,000
|
$184.00
-8.61%
|
12/29/2017
|
$162.92
|
PP = $168.17
|
|
MB = $176.58
|
Most Recent Note - 1/4/2018 6:47:08 PM
Y - Closed back below its pivot point today, completely negating the recent breakout and raising concerns after a big "negative reversal" at a new all-time high. The big gain on 1/02/18 backed by +98% above average volume triggered a technical buy signal. It was highlighted in yellow with pivot point cited based on its 11/22/17 high plus 10 cents in the 12/29/17 mid-day report. Disciplined investors avoid chasing stocks more than 5% above prior highs and always limit losses by selling any stock that falls more than -7% from their purchase price.
>>> FEATURED STOCK ARTICLE : Hovering Near Prior High After 3rd Strong Quarterly Earnings - 12/29/2017 |
View all notes |
Set NEW NOTE alert |
Company Profile |
SEC
News |
Chart |
Request a new note
C
A
S
I |
AVGO
-
NASDAQ
Broadcom Limited
ELECTRONICS - Semiconductor - Broad Line
|
$272.27
|
+0.65
0.24% |
$272.55
|
2,093,839
61.31% of 50 DAV
50 DAV is 3,415,000
|
$285.68
-4.69%
|
1/5/2018
|
$271.62
|
PP = $285.78
|
|
MB = $300.07
|
Most Recent Note - 1/5/2018 7:16:32 PM
Y - Rebounded above its 50 DMA line ($265.83) with a streak of gains this week marked by near average volume. The recent low ($254.20 on 12/06/17) defines important support where more damaging losses would raise greater concerns. Fundamentals remain strong. See the latest FSU analysis for more details and a new annotated graph.
>>> FEATURED STOCK ARTICLE : New Pivot Point Cited After Rebound Above 50-Day Moving Average - 1/5/2018 |
View all notes |
Set NEW NOTE alert |
Company Profile |
SEC
News |
Chart |
Request a new note
C
A
S
I |
TPL
-
NYSE
Texas Pacific Land Trust
FINANCIAL SERVICES - Diversified Investments
|
$481.25
|
+30.13
6.68% |
$485.50
|
32,115
247.04% of 50 DAV
50 DAV is 13,000
|
$477.50
0.79%
|
12/21/2017
|
$419.50
|
PP = $435.09
|
|
MB = $456.84
|
Most Recent Note - 1/8/2018 1:03:40 PM
G - Color code is changed to green with today's big gain backed by above average volume lifting it back above its "max buy" level while challenging its all-time high. Prior highs in the $434 area define initial support to watch on pullbacks.
>>> FEATURED STOCK ARTICLE : Real Estate Trust Perched Within Striking Distance of Prior High - 12/21/2017 |
View all notes |
Set NEW NOTE alert |
Company Profile |
SEC
News |
Chart |
Request a new note
C
A
S
I |
YY
-
NASDAQ
YY Inc Ads
INTERNET - Internet Service Providers
|
$129.27
|
+1.17
0.91% |
$131.66
|
1,456,306
98.67% of 50 DAV
50 DAV is 1,476,000
|
$128.80
0.36%
|
12/29/2017
|
$113.06
|
PP = $123.58
|
|
MB = $129.76
|
Most Recent Note - 1/5/2018 7:20:12 PM
Y - Hit a new high today with only average volume. Gains above the pivot point must have at least +40% above average volume to meet the guidelines for a proper technical buy signal. Its 50 DMA line ($105) defines support above the recent low ($98.50 on 12/06/17). This China-based Internet - Content firm's fundamentals remain strong. See the latest FSU analysis for more details and an annotated graph.
>>> FEATURED STOCK ARTICLE : Touched a New High But Ended Below New Pivot Point Cited - 1/4/2018 |
View all notes |
Set NEW NOTE alert |
Company Profile |
SEC
News |
Chart |
Request a new note
C
A
S
I |
Symbol/Exchange
Company Name
Industry Group |
PRICE |
CHANGE
(%Change) |
Day High |
Volume
(% DAV)
(% 50 day avg vol) |
52 Wk Hi
% From Hi |
Featured
Date |
Price
Featured |
Pivot Featured |
|
Max Buy |
HTHT
-
NASDAQ
China Lodging Group Ads
LEISURE - Lodging
|
$154.62
|
+1.11
0.72% |
$155.99
|
424,143
63.30% of 50 DAV
50 DAV is 670,000
|
$159.35
-2.97%
|
12/22/2017
|
$138.07
|
PP = $142.90
|
|
MB = $150.05
|
Most Recent Note - 1/4/2018 6:41:06 PM
Y - Pulled back below its "max buy" level and its color code is changed to yellow. Near term chart support is defined by the prior high $142.80.
>>> FEATURED STOCK ARTICLE : Sales Revenues Growth Rate Shows Acceleration - 12/22/2017 |
View all notes |
Set NEW NOTE alert |
Company Profile |
SEC
News |
Chart |
Request a new note
C
A
S
I |
PATK
-
NASDAQ
Patrick Industries Inc
Bldg-Mobile/Mfg and RV
|
$66.60
|
-1.40
-2.06% |
$68.43
|
89,133
57.88% of 50 DAV
50 DAV is 154,000
|
$71.13
-6.36%
|
10/26/2017
|
$90.90
|
PP = $87.90
|
|
MB = $92.30
|
Most Recent Note - 1/4/2018 6:39:32 PM
G - Abruptly retreated from its all-time high with a big loss today on higher volume indicative of distributional pressure. Its 50 DMA line and prior high coincide in the $64 area defining near-term support to watch. Fundamentals remain strong. Shares split 3/2 effective 12/11/17, so do not be confused by the impact on the share prices.
>>> FEATURED STOCK ARTICLE : Hovering Near High Following 3:2 Share Split - 12/15/2017 |
View all notes |
Set NEW NOTE alert |
Company Profile |
SEC
News |
Chart |
Request a new note
C
A
S
I |
ESNT
-
NYSE
Essent Group Ltd
Finance-MrtgandRel Svc
|
$45.52
|
+0.69
1.54% |
$46.62
|
1,148,590
131.37% of 50 DAV
50 DAV is 874,300
|
$47.29
-3.74%
|
10/9/2017
|
$39.75
|
PP = $41.54
|
|
MB = $43.62
|
Most Recent Note - 1/8/2018 4:06:40 PM
G - Consolidating above its 50 DMA line, not far from its all-time high. Recent lows in the $43.00 area define important support where more damaging losses would raise greater concerns. Its Relative Strength rating is 79, still below the 80+ minimum guideline for buy candidates.
>>> FEATURED STOCK ARTICLE : Pulling Back After Recently Wedging Higher - 12/14/2017 |
View all notes |
Set NEW NOTE alert |
Company Profile |
SEC
News |
Chart |
Request a new note
C
A
S
I |
FIVE
-
NASDAQ
Five Below Inc
Retail-DiscountandVariety
|
$66.95
|
-5.42
-7.49% |
$70.34
|
3,338,805
313.21% of 50 DAV
50 DAV is 1,066,000
|
$73.55
-8.97%
|
1/2/2018
|
$69.16
|
PP = $68.99
|
|
MB = $72.44
|
Most Recent Note - 1/8/2018 12:44:51 PM
Y - Gapped down today abruptly retreating from its all-time high, raising concerns while negating its recent rally from an advanced 3-4 week tight base. Its 50 DMA line ($62.53) defines near-term support above prior highs in the $57-58 area. Fundamentals remain very strong.
>>> FEATURED STOCK ARTICLE : Retail - Discount & Variety Firm Has Strong Fundamentals - 12/19/2017 |
View all notes |
Set NEW NOTE alert |
Company Profile |
SEC
News |
Chart |
Request a new note
C
A
S
I |
OLED
-
NASDAQ
Universal Display Corp
Elec-Misc Products
|
$194.85
|
+15.55
8.67% |
$197.25
|
1,999,668
215.25% of 50 DAV
50 DAV is 929,000
|
$192.75
1.09%
|
1/8/2018
|
$191.68
|
PP = $192.85
|
|
MB = $202.49
|
Most Recent Note - 1/8/2018 5:24:38 PM
Y - Finished strong today after highlighted in yellow with new pivot point cited based on its 11/24/17 high plus 10 cents. Gain and strong close above the pivot point backed by +215% above average volume triggered a convincing new (or add-on) technical buy signal. Recently found support above its 50 DMA line ($171.39). Subsequent losses leading to a violation may trigger a technical sell signal. Fundamentals remain very strong. See the latest FSU analysis for more details and a new annotated graph.
>>> FEATURED STOCK ARTICLE : Technical Breakout With Volume-Driven Gain For New High - 1/8/2018 |
View all notes |
Set NEW NOTE alert |
Company Profile |
SEC
News |
Chart |
Request a new note
C
A
S
I |
Symbol/Exchange
Company Name
Industry Group |
PRICE |
CHANGE
(%Change) |
Day High |
Volume
(% DAV)
(% 50 day avg vol) |
52 Wk Hi
% From Hi |
Featured
Date |
Price
Featured |
Pivot Featured |
|
Max Buy |
ANET
-
NYSE
Arista Networks Inc
TELECOMMUNICATIONS - Communication Equipment
|
$251.06
|
+14.29
6.04% |
$251.95
|
1,383,568
155.98% of 50 DAV
50 DAV is 887,000
|
$245.65
2.20%
|
1/8/2018
|
$248.88
|
PP = $245.75
|
|
MB = $258.04
|
Most Recent Note - 1/8/2018 12:26:40 PM
Y - Hitting a new high today after a choppy 6-week consolidation during which its 50 DMA line ($224.59) acted as support. Color code is changed to yellow with a new pivot point cited based on its 11/21/17 high plus 10 cents. Gains backed by at least +40% above average volume and a close above the pivot point may trigger a new (or add-on) technical buy signal.
>>> FEATURED STOCK ARTICLE : Encountering Distributional Pressure After Wedging Near Prior High - 1/2/2018 |
View all notes |
Set NEW NOTE alert |
Company Profile |
SEC
News |
Chart |
Request a new note
C
A
S
I |
GRUB
-
NYSE
Grubhub Inc
COMPUTER SOFTWARE and SERVICES - Technical and System Software
|
$71.36
|
-1.61
-2.21% |
$72.10
|
1,182,346
87.13% of 50 DAV
50 DAV is 1,357,000
|
$74.81
-4.61%
|
6/21/2017
|
$47.33
|
PP = $46.94
|
|
MB = $49.29
|
Most Recent Note - 1/8/2018 3:41:23 PM
G - Perched near its all-time high, still hovering in a tight range after the previously noted advanced "3-weeks tight" base. Its 50 DMA line ($67.36) defines initial support. Bullish action has continued although the 2 latest quarters were below the +25% minimum earnings guideline (C criteria), raising fundamental concerns with regard to the fact-based investment system.
>>> FEATURED STOCK ARTICLE : Extended From Any Base, Grubhub Hits Another New Record High - 12/18/2017 |
View all notes |
Set NEW NOTE alert |
Company Profile |
SEC
News |
Chart |
Request a new note
C
A
S
I |
IBP
-
NYSE
Installed Building Prod
DIVERSIFIED SERVICES - Business/Management Services
|
$74.40
|
-0.85
-1.13% |
$75.90
|
166,825
85.99% of 50 DAV
50 DAV is 194,000
|
$79.40
-6.30%
|
12/26/2017
|
$75.00
|
PP = $79.50
|
|
MB = $83.48
|
Most Recent Note - 1/4/2018 6:43:31 PM
Y - Perched within close striking distance of the new pivot point cited based on its 12/04/17 high plus 10 cents after forming an advanced ascending base. Its 50 DMA line and prior high define near term support in the $70-71 area. Subsequent losses leading to violations of the 50 DMA line or recent low ($68.30 on 12/13/17) may trigger technical sell signals. Fundamentals remain very strong.
>>> FEATURED STOCK ARTICLE : Building on an Advanced Ascending Base Pattern - 12/26/2017 |
View all notes |
Set NEW NOTE alert |
Company Profile |
SEC
News |
Chart |
Request a new note
C
A
S
I |
OLLI
-
NASDAQ
Ollie's Bargain Outlet
Retail-DiscountandVariety
|
$50.85
|
-2.65
-4.95% |
$53.70
|
943,454
169.99% of 50 DAV
50 DAV is 555,000
|
$54.30
-6.35%
|
11/21/2017
|
$46.78
|
PP = $47.00
|
|
MB = $49.35
|
Most Recent Note - 1/8/2018 3:38:08 PM
G - Churning above average volume and pulling back, consolidating after getting extended from any sound base. Its 50 DMA line ($48.27) defines important near-term support above prior highs in the $46 area. Fundamentals remain very strong.
>>> FEATURED STOCK ARTICLE : Extended From Latest Base and Perched Near Record High - 12/20/2017 |
View all notes |
Set NEW NOTE alert |
Company Profile |
SEC
News |
Chart |
Request a new note
C
A
S
I |
HLI
-
NYSE
Houlihan Lokey Inc Cl A
Finance-Invest Bnk/Bkrs
|
$46.88
|
+1.18
2.58% |
$46.99
|
211,165
85.15% of 50 DAV
50 DAV is 248,000
|
$46.99
-0.23%
|
1/3/2018
|
$45.88
|
PP = $47.09
|
|
MB = $49.44
|
Most Recent Note - 1/8/2018 4:08:56 PM
Y - Posted a gain with below average volume for a best-ever close. Color code was changed to yellow after an advanced "3-weeks tight" base was noted. New pivot point was cited based on its 12/18/17 high plus 10 cents. Subsequent volume-driven gains for new highs may trigger a new (or add-on) technical buy signal. Its 50 DMA line ($43.93) defines near-term support to watch. Made gradual progress since 10/26/17 when it priced a Secondary Offering. Fundamentals remain strong.
>>> FEATURED STOCK ARTICLE : Tight Weekly Closes Formed Advanced Base Pattern - 1/3/2018 |
View all notes |
Set NEW NOTE alert |
Company Profile |
SEC
News |
Chart |
Request a new note
C
A
S
I |
Symbol/Exchange
Company Name
Industry Group |
PRICE |
CHANGE
(%Change) |
Day High |
Volume
(% DAV)
(% 50 day avg vol) |
52 Wk Hi
% From Hi |
Featured
Date |
Price
Featured |
Pivot Featured |
|
Max Buy |
|
|
|
THESE ARE NOT BUY RECOMMENDATIONS!
Comments contained in the body of this report are technical
opinions only. The material herein has been obtained
from sources believed to be reliable and accurate, however,
its accuracy and completeness cannot be guaranteed.
This site is not an investment advisor, hence it does
not endorse or recommend any securities or other investments.
Any recommendation contained in this report may not
be suitable for all investors and it is not to be deemed
an offer or solicitation on our part with respect to
the purchase or sale of any securities. All trademarks,
service marks and trade names appearing in this report
are the property of their respective owners, and are
likewise used for identification purposes only.
This report is a service available
only to active Paid Premium Members.
You may opt-out of receiving report notifications
at any time. Questions or comments may be submitted
by writing to Premium Membership Services 665 S.E. 10 Street, Suite 201 Deerfield Beach, FL 33441-5634 or by calling 1-800-965-8307
or 954-785-1121.
|
|
|