You are not logged in.
This means you
CAN ONLY VIEW reports that were published prior to Wednesday, March 26, 2025.
You
MUST UPGRADE YOUR MEMBERSHIP if you want to see any current reports.
AFTER MARKET UPDATE - FRIDAY, JANUARY 5TH, 2018
Previous After Market Report Next After Market Report >>>
|
|
|
|
DOW |
+220.74 |
25,295.87 |
+0.88% |
|
Volume |
771,146,110 |
-14% |
|
Volume |
2,014,862,360 |
-4% |
|
NASDAQ |
+58.65 |
7,136.56 |
+0.83% |
|
Advancers |
1,745 |
60% |
|
Advancers |
1,514 |
57% |
|
S&P 500 |
+19.16 |
2,743.15 |
+0.70% |
|
Decliners |
1,161 |
40% |
|
Decliners |
1,149 |
43% |
|
Russell 2000 |
+4.29 |
1,560.01 |
+0.28% |
|
52 Wk Highs |
252 |
|
|
52 Wk Highs |
269 |
|
|
S&P 600 |
+3.85 |
949.18 |
+0.41% |
|
52 Wk Lows |
22 |
|
|
52 Wk Lows |
16 |
|
|
 |
Major Indices Start First Week of 2018 With Positive Action
Kenneth J. Gruneisen - Passed the CAN SLIM® Master's Exam
For the week, the Dow climbed 2.3%, the S&P 500 added 2.6%, and the Nasdaq was 3.4% higher. U.S. equities extended gains Friday. The Dow advanced 220 points to 25295.87. The S&P 500 added 19 points to 2743. The Nasdaq gained 59 points to 7136. Volume totals reported were lighter than the prior session totals on the NYSE and on the Nasdaq exchange. Advancers led decliners by 3-2 margin on the NYSE and by a 5-4 margin on the Nasdaq exchange. There were 82 high-ranked companies from the Leaders List that made new 52-week highs and were listed on the BreakOuts Page, versus the total of 94 on the prior session. New 52-week highs totals solidly outnumbered new 52-week lows on the NYSE and on the Nasdaq exchange. The Featured Stocks Page provides the latest analysis on noteworthy high-ranked leaders. Charts used courtesy of www.stockcharts.com
 PICTURED: The Nasdaq Composite Index hit a new record high with a 4th consecutive gain.
The major averages (M criteria) are in a confirmed uptrend. Investors should only consider stocks meeting all key criteria of the fact-based investment system as they trigger technical buy signals.
The Dow and Nasdaq are off to their best start to a year since 2006, as the major averages trended upward for a fourth consecutive day. On the data front, non-farm payrolls increased by 148,000 in December, below expectations of a 190,000 increase. Wages grew slightly, while the unemployment rate held steady at a cycle low of 4.1%. A separate update showed the trade deficit widened more than expected to $50.5 billion in November from $48.9 billion in October. Additional reports showed factory orders rose 1.3% in November while the pace of the U.S. service sector activity cooled last month, but remains firmly in expansionary territory.
Technology shares led today’s market advance with Microsoft (MSFT +1.24%) and Apple (AAPL +1.14%) rising. Shares of Constellation Brands (STZ -2.62%) were a notable decliner, dropping even after posting better-than-expected earnings results.
Treasuries ended the session lower, with the yield on the benchmark 10-year note advancing two basis points to 2.47%. In commodities, NYMEX WTI crude fell from a three year high, down 0.9% to $61.48/barrel. COMEX gold was down 0.1% to $1320.20/ounce amid a stronger dollar. |
 Kenneth J. Gruneisen started out as a licensed stockbroker in August 1987, a couple of months prior to the historic stock market crash that took the Dow Jones Industrial Average down -22.6% in a single day. He has published daily fact-based fundamental and technical analysis on high-ranked stocks online for two decades. Through FACTBASEDINVESTING.COM, Kenneth provides educational articles, news, market commentary, and other information regarding proven investment systems that work in good times and bad.
Comments contained in the body of this report are technical opinions only and are not necessarily those of Gruneisen Growth Corp. The material herein has been obtained from sources believed to be reliable and accurate, however, its accuracy and completeness cannot be guaranteed. Our firm, employees, and customers may effect transactions, including transactions contrary to any recommendation herein, or have positions in the securities mentioned herein or options with respect thereto. Any recommendation contained in this report may not be suitable for all investors and it is not to be deemed an offer or solicitation on our part with respect to the purchase or sale of any securities. |
|
 |
Retail, Financial and Tech Groups Rose
Kenneth J. Gruneisen - Passed the CAN SLIM® Master's Exam
The Retail Index ($RLX +1.38%) charged higher for a 4th consecutive session as the Bank Index ($BKX +0.21%) and the Broker/Dealer Index ($XBD +0.46%) both edged higher on Friday. The tech sector had a positive bias as the Networking Index ($NWX +0.85%) and the Semiconductor Index ($SOX +0.64%) outpaced the Biotechnology Index ($BTK +0.28%).Commodity-linked groups were mixed as the Gold & Silver Index ($XAU -0.45%) ended lower while the Oil Services Index ($OSX +0.05%) and Integrated Oil Index ($XOI +0.18%) inched higher. Charts courtesy wwwstockcharts.com
 PICTURED: The Integrated Oil Index ($XOI +0.18%) has been rallying above late 2016 highs, yet it is still trying to reclaim lost ground.
| Oil Services |
$OSX |
157.11 |
+0.07 |
+0.04% |
+5.06% |
| Integrated Oil |
$XOI |
1,386.89 |
+2.45 |
+0.18% |
+3.84% |
| Semiconductor |
$SOX |
1,325.71 |
+8.47 |
+0.64% |
+5.80% |
| Networking |
$NWX |
500.75 |
+0.85 |
+0.17% |
+2.08% |
| Broker/Dealer |
$XBD |
271.99 |
+1.24 |
+0.46% |
+2.55% |
| Retail |
$RLX |
1,800.80 |
+24.55 |
+1.38% |
+3.87% |
| Gold & Silver |
$XAU |
87.39 |
-0.40 |
-0.46% |
+2.49% |
| Bank |
$BKX |
108.90 |
+0.23 |
+0.21% |
+2.05% |
| Biotech |
$BTK |
4,333.74 |
+12.11 |
+0.28% |
+2.64% |
|
|
|
 |
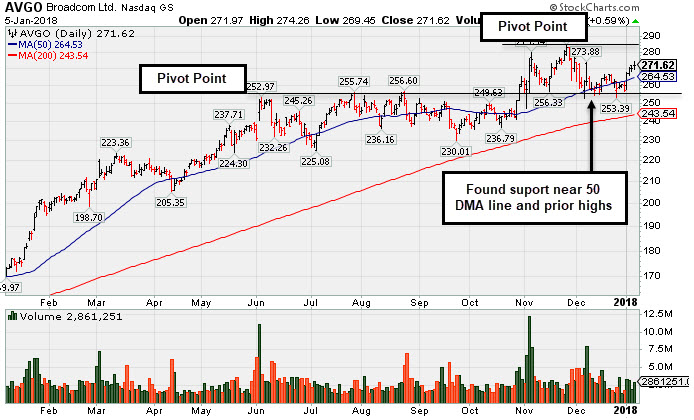
New Pivot Point Cited After Rebound Above 50-Day Moving Average
Kenneth J. Gruneisen - Passed the CAN SLIM® Master's Exam
Broadcom Limited (AVGO +$1.60 or +0.59% to $271.62) rebounded above its 50-day moving average (DMA) line ($264.53 with gains this week helping its outlook improve. A new pivot point is cited based on its 11/27/17 high plus 10 cents. Subsequent volume-driven gains for new highs may trigger a new (or add-on) technical buy signal. Its current Accumulation/Distribution Rating is B+, meanwhile, it has a Timeliness Rating of B and Sponsorship Rating of B.
It made recent bids to acquire Qualcomm Inc (QCOM). Earnings rose +32% on +17% sales revenues for the Oct '17 quarter, its 6th consecutive quarterly earnings increase above the +25% minimum guideline (C criteria). Earnings rose by +29%, +38%, +51%, +46%, and +42%, respectively, in the Jul ,Oct '16, Jan, Apr, and Jul '17 quarterly comparisons versus the year ago periods. Sales revenues rose +119%, +125%, +134%, +18% and +18% during that time span. Its annual earnings (A criteria) history has been strong.
This Singapore-based Electronics - Semiconductor firm was last shown in this FSU section on 12/08/17 under the headline, "Testing Support at Prior Highs and 50-Day Average ". Other leadership in the Semiconductor group has been a reassuring sign concerning the L criteria. The number of top-rated funds owning its shares rose from 2,240 in Mar '17 to 2,387 in Dec '17, a reassuring sign concerning the I criteria. Its current Up//Down Volume ratio of 1.6 is an unbiased indication its shares have been under accumulation over the past 50 days.
|
|
|
Color Codes Explained :
Y - Better candidates highlighted by our
staff of experts.
G - Previously featured
in past reports as yellow but may no longer be buyable under the
guidelines.
***Last / Change / Volume data in this table is the closing quote data***
Symbol/Exchange
Company Name
Industry Group |
PRICE |
CHANGE
(%Change) |
Day High |
Volume
(% DAV)
(% 50 day avg vol) |
52 Wk Hi
% From Hi |
Featured
Date |
Price
Featured |
Pivot Featured |
|
Max Buy |
THO
-
NYSE
Thor Industries Inc
AUTOMOTIVE - Recreational Vehicles
|
$154.87
|
-0.61
-0.39% |
$156.64
|
322,169
52.30% of 50 DAV
50 DAV is 616,000
|
$157.50
-1.67%
|
12/19/2017
|
$153.92
|
PP = $156.96
|
|
MB = $164.81
|
Most Recent Note - 1/3/2018 4:21:49 PM
Y - Wedging up near its all-time high with gains lacking great volume conviction. Subsequent gains above the pivot point backed by at least +40% above average volume may trigger a new (or add-on) technical buy signal. Its 50 DMA line ($142.73) and prior highs in the $138 area define near-term support to watch. Fundamentals remain very strong.
>>> FEATURED STOCK ARTICLE : Holding Ground in Tight Range Near High - 12/27/2017 |
View all notes |
Set NEW NOTE alert |
Company Profile |
SEC
News |
Chart |
Request a new note
C
A
S
I |
ROG
-
NYSE
Rogers Corp
CONSUMER NON-DURABLES - Rubber and Plastics
|
$166.70
|
+2.66
1.62% |
$166.87
|
72,597
36.67% of 50 DAV
50 DAV is 198,000
|
$184.00
-9.40%
|
12/29/2017
|
$162.92
|
PP = $168.17
|
|
MB = $176.58
|
Most Recent Note - 1/4/2018 6:47:08 PM
Y - Closed back below its pivot point today, completely negating the recent breakout and raising concerns after a big "negative reversal" at a new all-time high. The big gain on 1/02/18 backed by +98% above average volume triggered a technical buy signal. It was highlighted in yellow with pivot point cited based on its 11/22/17 high plus 10 cents in the 12/29/17 mid-day report. Disciplined investors avoid chasing stocks more than 5% above prior highs and always limit losses by selling any stock that falls more than -7% from their purchase price.
>>> FEATURED STOCK ARTICLE : Hovering Near Prior High After 3rd Strong Quarterly Earnings - 12/29/2017 |
View all notes |
Set NEW NOTE alert |
Company Profile |
SEC
News |
Chart |
Request a new note
C
A
S
I |
AVGO
-
NASDAQ
Broadcom Limited
ELECTRONICS - Semiconductor - Broad Line
|
$271.62
|
+1.60
0.59% |
$274.26
|
2,860,697
84.04% of 50 DAV
50 DAV is 3,404,000
|
$285.68
-4.92%
|
1/5/2018
|
$271.62
|
PP = $285.78
|
|
MB = $300.07
|
 Most Recent Note - 1/5/2018 7:16:32 PM
Y - Rebounded above its 50 DMA line ($265.83) with a streak of gains this week marked by near average volume. The recent low ($254.20 on 12/06/17) defines important support where more damaging losses would raise greater concerns. Fundamentals remain strong. See the latest FSU analysis for more details and a new annotated graph.
>>> FEATURED STOCK ARTICLE : New Pivot Point Cited After Rebound Above 50-Day Moving Average - 1/5/2018 |
View all notes |
Set NEW NOTE alert |
Company Profile |
SEC
News |
Chart |
Request a new note
C
A
S
I |
TPL
-
NYSE
Texas Pacific Land Trust
FINANCIAL SERVICES - Diversified Investments
|
$451.12
|
-2.52
-0.56% |
$464.15
|
12,043
92.64% of 50 DAV
50 DAV is 13,000
|
$477.50
-5.52%
|
12/21/2017
|
$419.50
|
PP = $435.09
|
|
MB = $456.84
|
Most Recent Note - 1/5/2018 12:50:02 PM
Y - Hovering near its all-time high, consolidating above the pivot point and below its "max buy" level. Prior highs in the $434 area define initial support to watch on pullbacks.
>>> FEATURED STOCK ARTICLE : Real Estate Trust Perched Within Striking Distance of Prior High - 12/21/2017 |
View all notes |
Set NEW NOTE alert |
Company Profile |
SEC
News |
Chart |
Request a new note
C
A
S
I |
YY
-
NASDAQ
YY Inc Ads
INTERNET - Internet Service Providers
|
$128.10
|
+6.17
5.06% |
$128.80
|
1,421,397
97.09% of 50 DAV
50 DAV is 1,464,000
|
$125.91
1.74%
|
12/29/2017
|
$113.06
|
PP = $123.58
|
|
MB = $129.76
|
Most Recent Note - 1/5/2018 7:20:12 PM
Y - Hit a new high today with only average volume. Gains above the pivot point must have at least +40% above average volume to meet the guidelines for a proper technical buy signal. Its 50 DMA line ($105) defines support above the recent low ($98.50 on 12/06/17). This China-based Internet - Content firm's fundamentals remain strong. See the latest FSU analysis for more details and an annotated graph.
>>> FEATURED STOCK ARTICLE : Touched a New High But Ended Below New Pivot Point Cited - 1/4/2018 |
View all notes |
Set NEW NOTE alert |
Company Profile |
SEC
News |
Chart |
Request a new note
C
A
S
I |
Symbol/Exchange
Company Name
Industry Group |
PRICE |
CHANGE
(%Change) |
Day High |
Volume
(% DAV)
(% 50 day avg vol) |
52 Wk Hi
% From Hi |
Featured
Date |
Price
Featured |
Pivot Featured |
|
Max Buy |
HTHT
-
NASDAQ
China Lodging Group Ads
LEISURE - Lodging
|
$153.51
|
+4.72
3.17% |
$156.40
|
655,597
98.59% of 50 DAV
50 DAV is 665,000
|
$159.35
-3.66%
|
12/22/2017
|
$138.07
|
PP = $142.90
|
|
MB = $150.05
|
Most Recent Note - 1/4/2018 6:41:06 PM
Y - Pulled back below its "max buy" level and its color code is changed to yellow. Near term chart support is defined by the prior high $142.80.
>>> FEATURED STOCK ARTICLE : Sales Revenues Growth Rate Shows Acceleration - 12/22/2017 |
View all notes |
Set NEW NOTE alert |
Company Profile |
SEC
News |
Chart |
Request a new note
C
A
S
I |
PATK
-
NASDAQ
Patrick Industries Inc
Bldg-Mobile/Mfg and RV
|
$68.00
|
+1.00
1.49% |
$68.05
|
188,014
122.88% of 50 DAV
50 DAV is 153,000
|
$71.13
-4.39%
|
10/26/2017
|
$90.90
|
PP = $87.90
|
|
MB = $92.30
|
Most Recent Note - 1/4/2018 6:39:32 PM
G - Abruptly retreated from its all-time high with a big loss today on higher volume indicative of distributional pressure. Its 50 DMA line and prior high coincide in the $64 area defining near-term support to watch. Fundamentals remain strong. Shares split 3/2 effective 12/11/17, so do not be confused by the impact on the share prices.
>>> FEATURED STOCK ARTICLE : Hovering Near High Following 3:2 Share Split - 12/15/2017 |
View all notes |
Set NEW NOTE alert |
Company Profile |
SEC
News |
Chart |
Request a new note
C
A
S
I |
ESNT
-
NYSE
Essent Group Ltd
Finance-MrtgandRel Svc
|
$44.83
|
+0.45
1.01% |
$45.30
|
929,446
106.81% of 50 DAV
50 DAV is 870,200
|
$47.29
-5.20%
|
10/9/2017
|
$39.75
|
PP = $41.54
|
|
MB = $43.62
|
Most Recent Note - 1/3/2018 3:51:58 PM
G - Recently sputtering below its 50 DMA line ($44.21) raising concerns. The recent low ($43.07 on 12/01/17) defines the next important support level where more damaging losses would raise greater concerns. Its Relative Strength rating has fallen to 79, below the 80+ minimum guideline for buy candidates
>>> FEATURED STOCK ARTICLE : Pulling Back After Recently Wedging Higher - 12/14/2017 |
View all notes |
Set NEW NOTE alert |
Company Profile |
SEC
News |
Chart |
Request a new note
C
A
S
I |
FIVE
-
NASDAQ
Five Below Inc
Retail-DiscountandVariety
|
$72.37
|
-0.27
-0.37% |
$73.55
|
1,272,264
120.37% of 50 DAV
50 DAV is 1,057,000
|
$73.05
-0.93%
|
1/2/2018
|
$69.16
|
PP = $68.99
|
|
MB = $72.44
|
Most Recent Note - 1/3/2018 12:59:26 PM
Y - Hit another new all-time high today but erased much of its early gain. Prior gain was backed by +22% above average volume, not a convincing technical buy signal from the advanced tight base pattern noted. Its 50 DMA line ($61.65) defines near-term support above prior highs in the $57-58 area. Fundamentals remain very strong.
>>> FEATURED STOCK ARTICLE : Retail - Discount & Variety Firm Has Strong Fundamentals - 12/19/2017 |
View all notes |
Set NEW NOTE alert |
Company Profile |
SEC
News |
Chart |
Request a new note
C
A
S
I |
OLED
-
NASDAQ
Universal Display Corp
Elec-Misc Products
|
$179.30
|
+2.80
1.59% |
$181.65
|
556,446
60.09% of 50 DAV
50 DAV is 926,000
|
$192.75
-6.98%
|
8/31/2017
|
$128.22
|
PP = $127.78
|
|
MB = $134.17
|
Most Recent Note - 1/3/2018 4:17:16 PM
G - Has not formed a valid new base pattern of sufficient length, but consolidating in an orderly fashion above its 50 DMA line ($168.42). Below that short-term average the prior low ($158.00 on 12/05/17) defines the next important chart support level to watch on pullbacks. Subsequent losses leading to violations may trigger technical sell signals. Fundamentals remain very strong.
>>> FEATURED STOCK ARTICLE : Consolidating After +50% Rally Since First Featured 8/31/17 - 12/13/2017 |
View all notes |
Set NEW NOTE alert |
Company Profile |
SEC
News |
Chart |
Request a new note
C
A
S
I |
Symbol/Exchange
Company Name
Industry Group |
PRICE |
CHANGE
(%Change) |
Day High |
Volume
(% DAV)
(% 50 day avg vol) |
52 Wk Hi
% From Hi |
Featured
Date |
Price
Featured |
Pivot Featured |
|
Max Buy |
ANET
-
NYSE
Arista Networks Inc
TELECOMMUNICATIONS - Communication Equipment
|
$236.77
|
+4.08
1.75% |
$238.46
|
505,468
57.18% of 50 DAV
50 DAV is 884,000
|
$245.65
-3.61%
|
10/27/2017
|
$195.65
|
PP = $196.37
|
|
MB = $206.19
|
Most Recent Note - 1/2/2018 7:11:28 PM
G - Pulled back on higher volume after wedging up near its all-time high. Its 50 DMA line ($220) defines near-term support above the prior low ($206.86 on 12/05/17). Subsequent violations would trigger technical sell signals. See the latest FSU analysis for more details and a new annotated graph.
>>> FEATURED STOCK ARTICLE : Encountering Distributional Pressure After Wedging Near Prior High - 1/2/2018 |
View all notes |
Set NEW NOTE alert |
Company Profile |
SEC
News |
Chart |
Request a new note
C
A
S
I |
GRUB
-
NYSE
Grubhub Inc
COMPUTER SOFTWARE and SERVICES - Technical and System Software
|
$72.97
|
+1.09
1.52% |
$73.02
|
1,374,981
100.00% of 50 DAV
50 DAV is 1,375,000
|
$74.81
-2.45%
|
6/21/2017
|
$47.33
|
PP = $46.94
|
|
MB = $49.29
|
Most Recent Note - 1/3/2018 3:55:46 PM
G - Hovering near its all-time high with volume totals cooling, it has formed an advanced "3-weeks tight" base. Its 50 DMA line ($66.26) defines initial support above prior highs near $57. Bullish action has continued although the 2 latest quarters were below the +25% minimum earnings guideline (C criteria), raising fundamental concerns with regard to the fact-based investment system.
>>> FEATURED STOCK ARTICLE : Extended From Any Base, Grubhub Hits Another New Record High - 12/18/2017 |
View all notes |
Set NEW NOTE alert |
Company Profile |
SEC
News |
Chart |
Request a new note
C
A
S
I |
IBP
-
NYSE
Installed Building Prod
DIVERSIFIED SERVICES - Business/Management Services
|
$75.25
|
-0.05
-0.07% |
$76.10
|
275,466
144.98% of 50 DAV
50 DAV is 190,000
|
$79.40
-5.23%
|
12/26/2017
|
$75.00
|
PP = $79.50
|
|
MB = $83.48
|
Most Recent Note - 1/4/2018 6:43:31 PM
Y - Perched within close striking distance of the new pivot point cited based on its 12/04/17 high plus 10 cents after forming an advanced ascending base. Its 50 DMA line and prior high define near term support in the $70-71 area. Subsequent losses leading to violations of the 50 DMA line or recent low ($68.30 on 12/13/17) may trigger technical sell signals. Fundamentals remain very strong.
>>> FEATURED STOCK ARTICLE : Building on an Advanced Ascending Base Pattern - 12/26/2017 |
View all notes |
Set NEW NOTE alert |
Company Profile |
SEC
News |
Chart |
Request a new note
C
A
S
I |
OLLI
-
NASDAQ
Ollie's Bargain Outlet
Retail-DiscountandVariety
|
$53.50
|
+1.40
2.69% |
$53.65
|
889,304
163.18% of 50 DAV
50 DAV is 545,000
|
$54.30
-1.47%
|
11/21/2017
|
$46.78
|
PP = $47.00
|
|
MB = $49.35
|
Most Recent Note - 1/5/2018 7:21:17 PM
G - Posted a solid gain today with above average volume. Still extended from any sound base. Its 50 DMA line ($48.15) defines important near-term support above prior highs in the $46 area. Fundamentals remain very strong.
>>> FEATURED STOCK ARTICLE : Extended From Latest Base and Perched Near Record High - 12/20/2017 |
View all notes |
Set NEW NOTE alert |
Company Profile |
SEC
News |
Chart |
Request a new note
C
A
S
I |
HLI
-
NYSE
Houlihan Lokey Inc Cl A
Finance-Invest Bnk/Bkrs
|
$45.70
|
-0.44
-0.95% |
$46.31
|
121,888
48.56% of 50 DAV
50 DAV is 251,000
|
$46.99
-2.75%
|
1/3/2018
|
$45.88
|
PP = $47.09
|
|
MB = $49.44
|
Most Recent Note - 1/3/2018 7:17:32 PM
Y - Color code was changed to yellow as it has formed an advanced "3-weeks tight" base. New pivot point was cited based on its 12/18/17 high plus 10 cents. Subsequent volume-driven gains for new highs may trigger a new (or add-on) technical buy signal. Its 50 DMA line ($43.70) defines near-term support to watch. Made gradual progress since 10/26/17 when it priced a Secondary Offering. Fundamentals remain strong. See the latest FSU analysis for more details and a new annotated graph.
>>> FEATURED STOCK ARTICLE : Tight Weekly Closes Formed Advanced Base Pattern - 1/3/2018 |
View all notes |
Set NEW NOTE alert |
Company Profile |
SEC
News |
Chart |
Request a new note
C
A
S
I |
Symbol/Exchange
Company Name
Industry Group |
PRICE |
CHANGE
(%Change) |
Day High |
Volume
(% DAV)
(% 50 day avg vol) |
52 Wk Hi
% From Hi |
Featured
Date |
Price
Featured |
Pivot Featured |
|
Max Buy |
|
|
|
THESE ARE NOT BUY RECOMMENDATIONS!
Comments contained in the body of this report are technical
opinions only. The material herein has been obtained
from sources believed to be reliable and accurate, however,
its accuracy and completeness cannot be guaranteed.
This site is not an investment advisor, hence it does
not endorse or recommend any securities or other investments.
Any recommendation contained in this report may not
be suitable for all investors and it is not to be deemed
an offer or solicitation on our part with respect to
the purchase or sale of any securities. All trademarks,
service marks and trade names appearing in this report
are the property of their respective owners, and are
likewise used for identification purposes only.
This report is a service available
only to active Paid Premium Members.
You may opt-out of receiving report notifications
at any time. Questions or comments may be submitted
by writing to Premium Membership Services 665 S.E. 10 Street, Suite 201 Deerfield Beach, FL 33441-5634 or by calling 1-800-965-8307
or 954-785-1121.
|
|
|