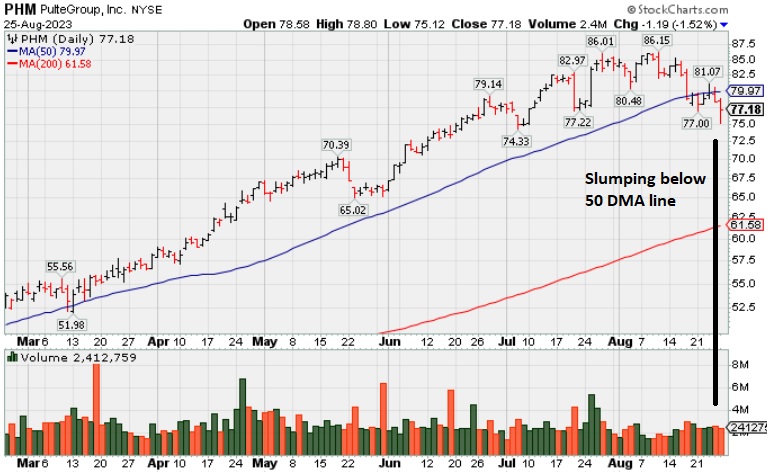
PulteGroup Slumps Further Below its 50-Day Moving Average - Friday, August 25, 2023
PulteGroup's (PHM -$1.19 or -1.52% to $77.18) slumped further today after sputtering below its 50-day moving average (DMA) line ($79.67) since a noted loss on 8/17/23 triggering a technical sell signal. A rebound above the 50 DMA line is needed for its outlook to improve. Recently reported earnings +18% for the Jun '23 quarter versus the year-ago period, below the +25% minimum guideline (C criteria) raising concerns.
PHM was highlighted in yellow in the 4/25/23 mid-day report (read here) with pivot point cited based on its May 2021 high. It was last shown in great detail on 7/27/23 with an annotated graph under the headline, "Reversed After Reaching a New All-Time High".
This Building - Residential/Commercial firm broke a streak of 13 strong quarterly comparisons above the +25% minimum earnings guideline (C criteria). Annual earnings (A criteria) history has been strong. It has a 98 Earnings Per Share Rating.
The number of top-rated funds owning its shares rose from 1,709 in Dec '22 to 1,939 in Jun '23. Its current Up/Down Volume Ratio of 1.3 is an unbiased indication its shares have been under accumulation over the past 50 days. It has a Timeliness Rating of A and an Accumulation/Distribution Rating of D.
Chart courtesy of www.stockcharts.com
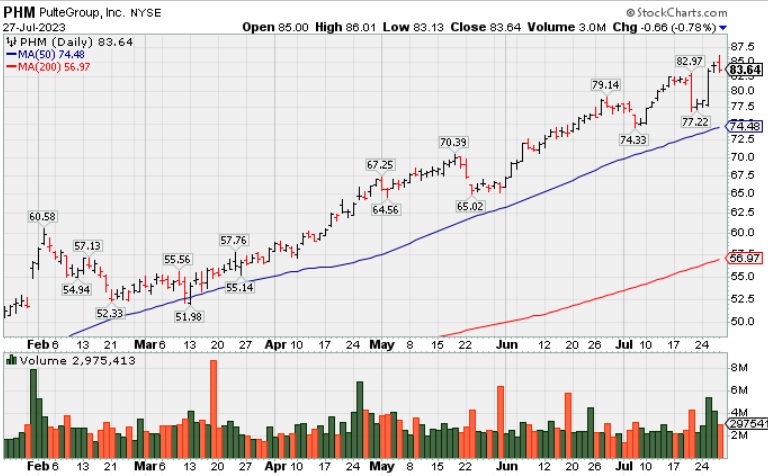
Reversed After Reaching a New All-Time High - Thursday, July 27, 2023
PulteGroup's (PHM -$0.66 or -0.78% to $83.64) had a "negative reversal" and ended lower today after hitting a new all-time high. It is very extended from any sound base. It recently reported earnings +18% for the Jun '23 quarter versus the year-ago period, below the +25% minimum guideline (C criteria) raising concerns. Important support to watch is defined by its 50-day moving average DMA line ($74.54).
PHM was highlighted in yellow in the 4/25/23 mid-day report (read here) with pivot point cited based on its May 2021 high. It was last shown in great detail on 6/26/23 with an annotated graph under the headline, "Negative Reversal After Hitting Another New High".
This Building - Residential/Commercial firm broke a streak of 13 strong quarterly comparisons above the +25% minimum earnings guideline (C criteria). Annual earnings (A criteria) history has been strong. It has a 98 Earnings Per Share Rating.
The number of top-rated funds owning its shares rose from 1,709 in Dec '22 to 1,896 in Jun '23. Its current Up/Down Volume Ratio of 1.6 is an unbiased indication its shares have been under accumulation over the past 50 days. It has a Timeliness Rating of A and an Accumulation/Distribution Rating of B-.
Chart courtesy of www.stockcharts.com
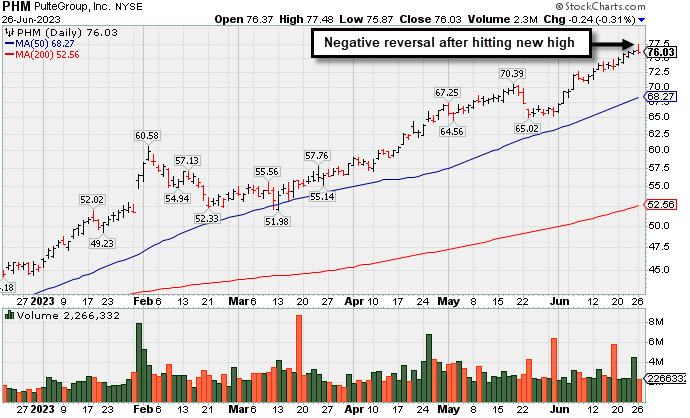
Negative Reversal After Hitting Another New High - Monday, June 26, 2023
PulteGroup's (PHM -$0.24 or -0.31% to $76.03) hit yet another new high today but reversed and ended lower It is extended from any sound base. Important support to watch is defined by its 50 DMA line ($67.06) and recent low. .
PHM was highlighted in yellow in the 4/25/23 mid-day report (read here) with pivot point cited based on its May 2021 high. It was last shown in great detail on 6/02/23 with an annotated graph under the headline, "Rebounded Above "Max Buy" Level Toward Recent High".
Bullish action came after it reported earnings +28% for the Mar '23 quarter versus the year-ago period. This Building - Residential/Commercial firm has posted 13 strong quarterly comparisons above the +25% minimum earnings guideline (C criteria). Annual earnings (A criteria) history has been strong. It has a 99 Earnings Per Share Rating.
The number of top-rated funds owning its shares rose from 1,709 in Dec '22 to 1,777 in Mar '23. Its current Up/Down Volume Ratio of 1.8 is an unbiased indication its shares have been under accumulation over the past 50 days. It has a Timeliness Rating of A and an Accumulation/Distribution Rating of B-.
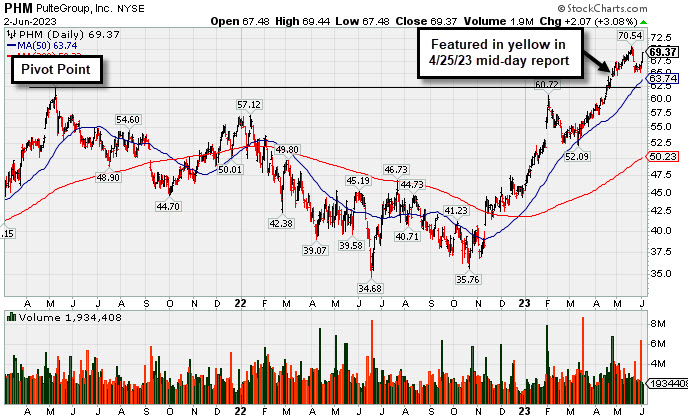
Rebounded Above "Max Buy" Level Toward Recent High - Friday, June 2, 2023
PulteGroup's (PHM +$2.07 or +3.08% to $69.37) color code was changed to green after rising back above its "max buy" level. Important support to watch on pullbacks is its 50-day moving average (DMA) line ($63.73).
PHM was highlighted in yellow in the 4/25/23 mid-day report (read here) with pivot point cited based on its May 2021 high. It was shown in greater detail that evening with an annotated graph under the headline, "Recently Rallying to New All-Time Highs".
PHM was highlighted in yellow in the 4/25/23 mid-day report (read here) with pivot point cited based on its May 2021 high. It was shown in greater detail that evening with an annotated graph under the headline, "Recently Rallying to New All-Time Highs".
Bullish action came after it reported earnings +28% for the Mar '23 quarter versus the year-ago period. This Building - Residential/Commercial firm has posted 13 strong quarterly comparisons above the +25% minimum earnings guideline (C criteria). Annual earnings (A criteria) history has been strong. It has a 98 Earnings Per Share Rating.
The number of top-rated funds owning its shares rose from 1,709 in Dec '22 to 1,784 in Mar '23. Its current Up/Down Volume Ratio of 1.7 is an unbiased indication its shares have been under accumulation over the past 50 days. It has a Timeliness Rating of A and an Accumulation/Distribution Rating of C+.
Chart courtesy of www.stockcharts.com
| Symbol/Exchange Company Name Industry Group | PRICE | CHANGE | Day High | Volume (% DAV) (% 50 day avg vol) | 52 Wk Hi | Featured Date | Price Featured | Pivot Featured |
| Max Buy | ||||||||
Graphic Packaging Hldg CONSUMER NON-DURABLES - Packaging and Containers | $25.00 | +0.84 3.48% | $25.05 | 2,559,015 50 DAV is 2,769,400 | $26.16 -4.43% | 10/25/2022 | $22.75 | PP = $24.17 |
| MB = $25.38 | ||||||||
G - Rebounded near its 50 DMA line ($25.05) with today's big gain backed by below average volume. Tested its 4/27/23 low this week which defines near term support to watch. Subsequent gains and a close above the 50 DMA line is needed for its outlook to improve. Reported Mar '23 quarterly earnings +60% on +9% sales revenues versus the year-ago period. >>> FEATURED STOCK ARTICLE : Packaging Firm Due to Report Earnings News - 5/1/2023 | View all notes | Set NEW NOTE alert | Company Profile | SEC News | Chart | Request a new note | ||||||||
Sterling Infrastructure Bldg-Heavy Construction | $49.20 | +2.76 5.94% | $49.26 | 328,366 50 DAV is 238,000 | $48.44 1.57% | 12/14/2022 | $32.41 | PP = $33.72 |
| MB = $35.41 | ||||||||
G - Hitting another new all-time high with slightly above average volume behind today's big gain. Bullish action has continued although it reported Mar '23 quarterly earnings +0% on +10% sales revenues versus the year-ago period, below the +25% minimum earnings guideline (C criteria) raising fundamental concerns. >>> FEATURED STOCK ARTICLE : 50-Day Moving Average Line Acted as Recent Resistance - 4/28/2023 | View all notes | Set NEW NOTE alert | Company Profile | SEC News | Chart | Request a new note | ||||||||
Comfort Systems USA Bldg-A/C and Heating Prds | $154.86 | +6.48 4.37% | $154.93 | 286,497 50 DAV is 276,000 | $156.19 -0.85% | 4/27/2023 | $148.85 | PP = $152.23 |
| MB = $159.84 | ||||||||
Y - Gapped up today, still hovering near its all-time high. No resistance remains due to overhead supply, however, it has made little headway in recent weeks. Subsequent gains and new highs backed by at least +40% above average volume may help reconfirm a technical buy signal. >>> FEATURED STOCK ARTICLE : Churning Action While Recently Hovering Near All-Time High - 5/12/2023 | View all notes | Set NEW NOTE alert | Company Profile | SEC News | Chart | Request a new note | ||||||||
Coca-Cola Femsa ADR Beverages-Non-Alcoholic | $83.77 | +0.32 0.38% | $84.91 | 178,515 50 DAV is 199,000 | $91.23 -8.18% | 3/7/2023 | $76.63 | PP = $77.11 |
| MB = $80.97 | ||||||||
G - Finding support near its 50 DMA line ($84.35) with today's 2nd gain backed by lighter volume following 7 consecutive losses marked by higher volume. More damaging losses would trigger a technical sell signal. Reported Mar '23 quarterly earnings +53% on +24% sales revenues versus the year-ago period. Prior highs in the $79-$77 area define the next support to watch below its 50 DMA line. >>> FEATURED STOCK ARTICLE : Posted Gain Afrer Reporting Strong Mar '23 Quarterly Results - 5/2/2023 | View all notes | Set NEW NOTE alert | Company Profile | SEC News | Chart | Request a new note | ||||||||
Clean Harbors Pollution Control | $150.91 | +7.42 5.17% | $151.30 | 502,326 50 DAV is 378,000 | $147.76 2.13% | 3/10/2023 | $136.89 | PP = $136.74 |
| MB = $143.58 | ||||||||
G - Hitting a new all-time high with today's big gain backed by near average volume. Found support near its 50 DMA line ($140) this week. More damaging losses would raise greater concerns. Reported Mar '23 quarterly earnings +64% on +12% sales revenues versus the year-ago period. Fundamentals remain strong. >>> FEATURED STOCK ARTICLE : Showed Resilience Near 50-Day Moving Average Following Sell-Off - 5/10/2023 | View all notes | Set NEW NOTE alert | Company Profile | SEC News | Chart | Request a new note | ||||||||
| Symbol/Exchange Company Name Industry Group | PRICE | CHANGE | Day High | Volume (% DAV) (% 50 day avg vol) | 52 Wk Hi | Featured Date | Price Featured | Pivot Featured |
| Max Buy | ||||||||
SPS Commerce Comp Sftwr-Spec Enterprs | $162.73 | +4.26 2.69% | $163.40 | 164,356 50 DAV is 139,000 | $164.69 -1.19% | 4/24/2023 | $150.01 | PP = $157.56 |
| MB = $165.44 | ||||||||
Y - Posted a 2nd solid gain today after pulling back testing its 50 DMA line ($151.91) following a "negative reversal". When wedging to a new 52-week high the recent gains above the pivot point were not backed by the +40% above average volume needed to trigger a proper technical buy signal. Reported Mar '23 quarterly earnings +22% on +20% versus the year-ago period, below the +25% minimum earnings guideline (C criteria) raising some fundamental concerns. >>> FEATURED STOCK ARTICLE : Pulled Back After Quietly Wedging to New Highs - 5/31/2023 | View all notes | Set NEW NOTE alert | Company Profile | SEC News | Chart | Request a new note | ||||||||
Hubbell Electrical-Power/Equipmt | $294.49 | +7.24 2.52% | $296.28 | 318,556 50 DAV is 400,000 | $291.91 0.88% | 4/25/2023 | $262.85 | PP = $257.51 |
| MB = $270.39 | ||||||||
G - Gapped up today and posted a solid gain with lighter volume for another new all-time high, getting more extended from the prior base. Prior highs in the $263 area define initial support to watch on pullbacks. Fundamentals remain strong. See the latest FSU analysis for more details and an annotated graph. >>> FEATURED STOCK ARTICLE : Extended From Prior Base and Perched Near High - 6/1/2023 | View all notes | Set NEW NOTE alert | Company Profile | SEC News | Chart | Request a new note | ||||||||
NVR Bldg-Resident/Comml | $5,711.00 | +140.39 2.52% | $5,732.09 | 23,850 50 DAV is 23,000 | $5,986.96 -4.61% | 4/25/2023 | $5,882.18 | PP = $5,978.25 |
| MB = $6,277.16 | ||||||||
G - Rebounding above its 50 DMA line ($5,693) with today's big gain helping its technical stance. Reported Mar '23 quarterly earnings -14% on -3% sales revenues versus the year-ago period, below the +25% minimum earnings guideline (C criteria) raising fundamental concerns, and its color code was changed to green. Prior quarterly comparisons were well above the +25% minimum earnings guideline (C criteria). Annual earnings (A criteria) growth has been very strong. >>> FEATURED STOCK ARTICLE : Fell From High and Raised Concern With Subpar Mar '23 Report - 4/27/2023 | View all notes | Set NEW NOTE alert | Company Profile | SEC News | Chart | Request a new note | ||||||||
PulteGroup Bldg-Resident/Comml | $69.38 | +2.08 3.09% | $69.44 | 2,450,064 50 DAV is 2,877,000 | $70.54 -1.64% | 4/25/2023 | $65.17 | PP = $64.01 |
| MB = $67.21 | ||||||||
G - Color code is changed to green after rising back above its "max buy" level. Reported earnings +28% for the Mar '23 quarter versus the year-ago period. Important support to watch is its 50 DMA line ($63.74). See the latest FSU analysis for more details and a new annotated graph. >>> FEATURED STOCK ARTICLE : Rebounded Above "Max Buy" Level Toward Recent High - 6/2/2023 | View all notes | Set NEW NOTE alert | Company Profile | SEC News | Chart | Request a new note | ||||||||
Coca-Cola Consolidated Beverages-Non-Alcoholic | $692.23 | +11.99 1.76% | $693.92 | 45,776 50 DAV is 33,000 | $694.20 -0.28% | 5/4/2023 | $646.66 | PP = $656.21 |
| MB = $689.02 | ||||||||
G - Color code is changed to green after rising above its "max buy" level. Bullish action came after it reported Mar '23 quarterly earnings +93% on +12% sales revenues versus the year-ago period, continuing its strong earnings track record. >>> FEATURED STOCK ARTICLE : COKE is Showing Real Strength - 5/4/2023 | View all notes | Set NEW NOTE alert | Company Profile | SEC News | Chart | Request a new note | ||||||||
| Symbol/Exchange Company Name Industry Group | PRICE | CHANGE | Day High | Volume (% DAV) (% 50 day avg vol) | 52 Wk Hi | Featured Date | Price Featured | Pivot Featured |
| Max Buy | ||||||||
Amphastar Pharm Medical-Biomed/Biotech | $46.70 | +1.56 3.46% | $46.86 | 604,870 50 DAV is 386,000 | $45.50 2.64% | 5/15/2023 | $43.56 | PP = $44.15 |
| MB = $46.36 | ||||||||
Y - Hitting a new all-time high and trading near its "max buy" level with today's 5th consecutive gain backed by ever-increasing volume but still below the +40% above average volume guideline. Subsequent gains and a strong close above the pivot point backed by at least +40% above average volume may clinch a technical buy signal. Fundamentals remain strong. >>> FEATURED STOCK ARTICLE : Weak Finish After Early Gain When Perched Near All-Time High - 5/15/2023 | View all notes | Set NEW NOTE alert | Company Profile | SEC News | Chart | Request a new note | ||||||||
Arista Networks Computer-Networking | $162.50 | -4.18 -2.51% | $169.98 | 3,369,498 50 DAV is 3,230,000 | $178.36 -8.89% | 5/30/2023 | $176.35 | PP = $171.54 |
| MB = $180.12 | ||||||||
Y - Pulling back again today. Stalled this week after a streak of 4 consecutive volume-driven gains hitting a new high triggered a technical buy signal. Color code was changed to yellow with new pivot point cited based on its 3/23/23 high plus 10 cents in the 5/30/23 mid-day report. Reported Mar '23 quarterly earnings +70% on +54% sales revenues versus the year-ago period and fundamentals remain strong. >>> FEATURED STOCK ARTICLE : Technical Sell Signal Triggered by Damaging Volume-Driven Loss - 5/3/2023 | View all notes | Set NEW NOTE alert | Company Profile | SEC News | Chart | Request a new note | ||||||||
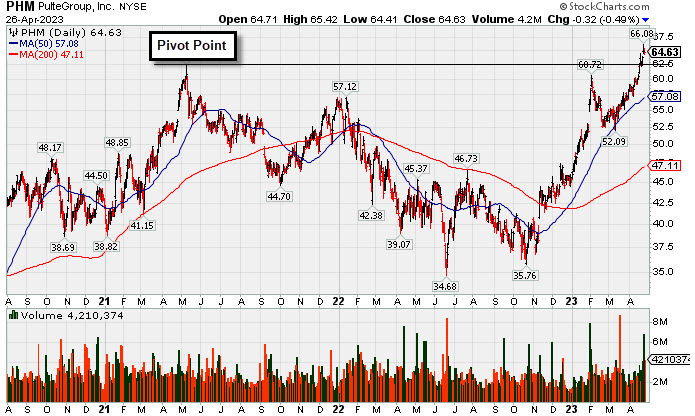
Recently Rallying to New All-Time Highs - Wednesday, April 26, 2023
PulteGroup (PHM -$0.43 or -0.66% to $64.52) pulled back today. It was highlighted in yellow in the 4/25/23 mid-day report (read here) with pivot point cited based on its May 2021 high. It gapped up hitting a new all-time high with a 4th consecutive volume-driven gain and no resistance remains due to overhead supply.
Bullish action came after it reported earnings +28% for the Mar '23 quarter versus the year-ago period. This Building - Residential/Commercial firm has posted 13 strong quarterly comparisons above the +25% minimum earnings guideline (C criteria). Annual earnings (A criteria) history has been strong. It has a 98 Earnings Per Share Rating.
The number of top-rated funds owning its shares reportedly fell from 1,791 in Sep 22 to 1,701 in Mar '23. However, its current Up/Down Volume Ratio of 1.4 is an unbiased indication its shares have been under accumulation over the past 50 days. It has a Timeliness Rating of A and an Accumulation/Distribution Rating of A-.
Chart courtesy of www.stockcharts.com