You are not logged in.
This means you
CAN ONLY VIEW reports that were published prior to Thursday, March 20, 2025.
You
MUST UPGRADE YOUR MEMBERSHIP if you want to see any current reports.
AFTER MARKET UPDATE - MONDAY, JUNE 26TH, 2023
Previous After Market Report Next After Market Report >>>
|
|
|
|
DOW |
-12.72 |
33,714.71 |
-0.04% |
|
Volume |
830,511,920 |
-68% |
|
Volume |
4,496,575,800 |
-45% |
|
NASDAQ |
-156.74 |
13,335.78 |
-1.16% |
|
Advancers |
1,882 |
65% |
|
Advancers |
2,110 |
47% |
|
S&P 500 |
-19.51 |
4,328.82 |
-0.45% |
|
Decliners |
1,016 |
35% |
|
Decliners |
2,335 |
53% |
|
Russell 2000 |
+1.63 |
1,823.26 |
+0.09% |
|
52 Wk Highs |
55 |
|
|
52 Wk Highs |
58 |
|
|
S&P 600 |
+7.07 |
1,173.39 |
+0.61% |
|
52 Wk Lows |
30 |
|
|
52 Wk Lows |
172 |
|
|
 |
Major Averages Fell With Lighter Volume Totals
Kenneth J. Gruneisen - Passed the CAN SLIM® Master's Exam
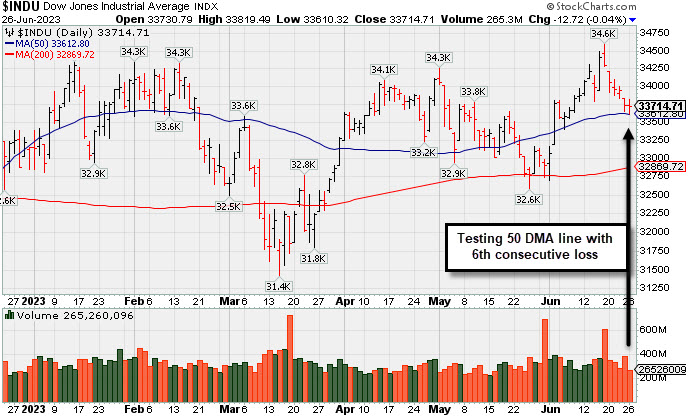
The Dow was down 12 points (-0.04%), while the S&P 500 fell -0.4% and the tech-heavy Nasdaq Composite declined -1.2%. Volume totals reported were lighter on the NYSE and on the Nasdaq exchange versus the prior session. Advancers led decliners by a 9-5 margin on the NYSE but decliners outnumbered advancers by a narrow margin on the Nasdaq exchange. There were 33 high-ranked companies from the Leaders List that hit a new 52-week high and were listed on the BreakOuts Page, versus the total of 20 on the prior session. New 52-week highs totals outnumbered new 52-week lows on the NYSE, but new lows outnumbered new highs on the Nasdaq exchange. The major indices are in a confirmed uptrend (M criteria). Appropriate new buying efforts may be considered under the fact-based investment system.
PICTURED: The Dow Jones Industrial Average is consolidating after hitting a new 2023 high.
Five of 11 sectors fell as U.S. equities closed near session lows on Monday. Concerns over a global economic growth slowdown reignited as central banks around the world remained hawkish in their efforts to fight inflation. The Consumer Services sector led the laggards, down 1.9%.
Treasuries were mixed today as investors continue to digest hawkish commentary over the past week from U.S. Federal Reserve (Fed) officials and unwound bets that the Fed will cut rates at any point this year. The yield on the 10-year note fell two basis points (0.02%) to 3.71%, and the 30-year bond yield was unchanged to 3.81%. Meanwhile, the yield on the two-year note, which is more sensitive to changes in monetary policy, fell two basis points (0.02%) to 4.72%.
On the data front today, the Dallas Fed Manufacturing Activity Index rose less than analysts expected, coming in at -23.2 in June compared to May’s -29.1 reading.
In commodities, West Texas Intermediate (WTI) crude rose 0.4% to $69.46/barrel on heightened concerns over the impact of prolonged turmoil in Russia on global oil markets despite the concerns that a weakening economy could lead to a drop in oil demand. Gold prices rose 0.2% to $1,922.50/ounce as geopolitical uncertainties increased the perceived safe-haven demand for the yellow metal.
|
 Kenneth J. Gruneisen started out as a licensed stockbroker in August 1987, a couple of months prior to the historic stock market crash that took the Dow Jones Industrial Average down -22.6% in a single day. He has published daily fact-based fundamental and technical analysis on high-ranked stocks online for two decades. Through FACTBASEDINVESTING.COM, Kenneth provides educational articles, news, market commentary, and other information regarding proven investment systems that work in good times and bad.
Comments contained in the body of this report are technical opinions only and are not necessarily those of Gruneisen Growth Corp. The material herein has been obtained from sources believed to be reliable and accurate, however, its accuracy and completeness cannot be guaranteed. Our firm, employees, and customers may effect transactions, including transactions contrary to any recommendation herein, or have positions in the securities mentioned herein or options with respect thereto. Any recommendation contained in this report may not be suitable for all investors and it is not to be deemed an offer or solicitation on our part with respect to the purchase or sale of any securities. |
|
 |
Commodity-Linked Groups Rose; Biotech and Retail Indexes Fell
Kenneth J. Gruneisen - Passed the CAN SLIM® Master's Exam
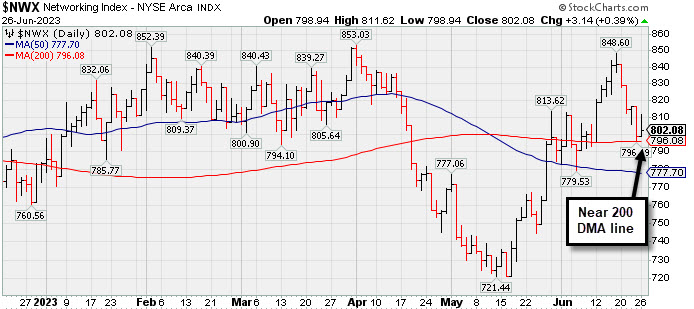
The Bank Index ($BKX +0.64%) posted a small gain and the Broker/Dealer Index ($XBD +0.13%) inched higher,but the Retail Index ($RLX -0.41%) edged lower. The tech sector was mixed as the Semiconductor Index ($SOX +0.26%) and Networking Index ($NWX +0.39%) both edged higher but the Biotech Index ($BTK -2.95%) slumped for a large loss. Commodity-linked groups rose as the Integrated Oil Index ($XOI +1.71%) and the Oil Services Index ($OSX +1.92%) both outpaced the Gold & Silver Index ($XAU +0.98%).
PICTURED: The Networking Index ($NWX +0.39%) is consolidating near its 200-day moving average (DMA) line.
| Oil Services |
$OSX |
75.95 |
+1.43 |
+1.92% |
-9.44% |
| Integrated Oil |
$XOI |
1,638.74 |
+27.63 |
+1.71% |
-8.31% |
| Semiconductor |
$SOX |
3,515.77 |
+9.07 |
+0.26% |
+38.85% |
| Networking |
$NWX |
802.08 |
+3.14 |
+0.39% |
+2.40% |
| Broker/Dealer |
$XBD |
461.58 |
+0.58 |
+0.13% |
+2.77% |
| Retail |
$RLX |
3,396.94 |
-13.82 |
-0.41% |
+23.35% |
| Gold & Silver |
$XAU |
119.46 |
+1.16 |
+0.98% |
-1.16% |
| Bank |
$BKX |
78.09 |
+0.50 |
+0.64% |
-22.57% |
| Biotech |
$BTK |
5,222.23 |
-158.88 |
-2.95% |
-1.11% |
|
|
|
 |
Negative Reversal After Hitting Another New High
Kenneth J. Gruneisen - Passed the CAN SLIM® Master's Exam
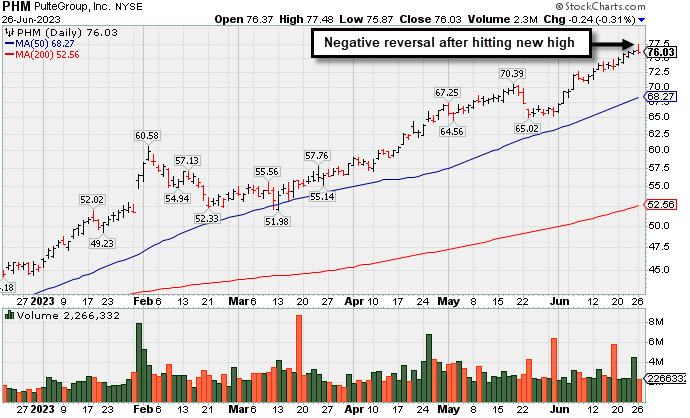
PulteGroup's (PHM -$0.24 or -0.31% to $76.03) hit yet another new high today but reversed and ended lower It is extended from any sound base. Important support to watch is defined by its 50 DMA line ($67.06) and recent low. .
Bullish action came after it reported earnings +28% for the Mar '23 quarter versus the year-ago period. This Building - Residential/Commercial firm has posted 13 strong quarterly comparisons above the +25% minimum earnings guideline (C criteria). Annual earnings (A criteria) history has been strong. It has a 99 Earnings Per Share Rating.
The number of top-rated funds owning its shares rose from 1,709 in Dec '22 to 1,777 in Mar '23. Its current Up/Down Volume Ratio of 1.8 is an unbiased indication its shares have been under accumulation over the past 50 days. It has a Timeliness Rating of A and an Accumulation/Distribution Rating of B-. |
|
|
Color Codes Explained :
Y - Better candidates highlighted by our
staff of experts.
G - Previously featured
in past reports as yellow but may no longer be buyable under the
guidelines.
***Last / Change / Volume data in this table is the closing quote data***
Symbol/Exchange
Company Name
Industry Group |
PRICE |
CHANGE
(%Change) |
Day High |
Volume
(% DAV)
(% 50 day avg vol) |
52 Wk Hi
% From Hi |
Featured
Date |
Price
Featured |
Pivot Featured |
|
Max Buy |
 GPK
-
NYSE
GPK
-
NYSE
Graphic Packaging Hldg
CONSUMER NON-DURABLES - Packaging and Containers
|
$23.97
|
+0.37
1.57% |
$24.03
|
3,933,932
90.35% of 50 DAV
50 DAV is 4,353,900
|
$27.56
-13.03%
|
10/25/2022
|
$22.75
|
PP = $24.17
|
|
MB = $25.38
|
Most Recent Note - 6/22/2023 3:59:03 PM
G - Undercut the prior low (23.75) today while slumping near its 200 DMA line ($23.33). Violation of its 50 DMA line ($25.24) raised concerns following a noted "negative reversal" on 6/13/23. A rebound above the 50 DMA line is needed to help its outlook improve. It was repeatedly noted - "It did not form a sound new base of sufficient length but quickly recovered after testing its 4/27/23 low. Reported Mar '23 quarterly earnings +60% on +9% sales revenues versus the year-ago period."
>>> FEATURED STOCK ARTICLE : Graphic Packaging Hits New High With 6th Consecutive Gain - 6/8/2023 |
View all notes |
Set NEW NOTE alert |
Company Profile |
SEC
News |
Chart |
Request a new note
C
A
S
I |
STRL
-
NASDAQ
Sterling Infrastructure
Bldg-Heavy Construction
|
$52.16
|
-0.43
-0.82% |
$53.29
|
226,347
80.55% of 50 DAV
50 DAV is 281,000
|
$54.44
-4.19%
|
12/14/2022
|
$32.41
|
PP = $33.72
|
|
MB = $35.41
|
Most Recent Note - 6/22/2023 5:27:54 PM
G - Posted a volume-driven gain today. It has been holding its ground stubbornly near its all-time high, extended from any sound base. Mar '23 quarterly earnings were below the +25% minimum guideline (C criteria) raising fundamental concerns.
>>> FEATURED STOCK ARTICLE : Impressive Streak of Gains for New Highs - 6/7/2023 |
View all notes |
Set NEW NOTE alert |
Company Profile |
SEC
News |
Chart |
Request a new note
C
A
S
I |
FIX
-
NYSE
Comfort Systems USA
Bldg-A/C and Heating Prds
|
$161.00
|
+0.43
0.27% |
$164.00
|
206,394
74.51% of 50 DAV
50 DAV is 277,000
|
$165.05
-2.45%
|
4/27/2023
|
$148.85
|
PP = $152.23
|
|
MB = $159.84
|
Most Recent Note - 6/21/2023 7:09:49 PM
G - Posted a gain today with below-average volume for a best-ever close. It is extended from the prior base and no resistance remains due to overhead supply. Prior highs in the $152-156 area define initial support to watch above its 50 DMA line ($148).
>>> FEATURED STOCK ARTICLE : "Negative Reversal" Following Recent Volume-Driven Gains - 6/16/2023 |
View all notes |
Set NEW NOTE alert |
Company Profile |
SEC
News |
Chart |
Request a new note
C
A
S
I |
KOF
-
NYSE
Coca-Cola Femsa ADR
Beverages-Non-Alcoholic
|
$85.70
|
-1.12
-1.29% |
$87.18
|
168,614
97.46% of 50 DAV
50 DAV is 173,000
|
$91.23
-6.06%
|
6/9/2023
|
$88.61
|
PP = $91.33
|
|
MB = $95.90
|
 Most Recent Note - 6/26/2023 6:30:14 PM
G - Undercut its 50 DMA line ($86.33) with today's loss on near average volume raising concerns and its color code is changed to green. A prompt rebound above the 50 DMA line would help its outlook improve. Subsequent gains above the pivot point backed by at least +40% above average volume may trigger a technical buy signal. Fundamentals remain strong.
>>> FEATURED STOCK ARTICLE : Coca-Cola Femsa Posts 7th Consecutive Gain - 6/9/2023 |
View all notes |
Set NEW NOTE alert |
Company Profile |
SEC
News |
Chart |
Request a new note
C
A
S
I |
CLH
-
NYSE
Clean Harbors
Pollution Control
|
$156.11
|
+0.69
0.44% |
$156.83
|
305,540
77.94% of 50 DAV
50 DAV is 392,000
|
$160.50
-2.74%
|
3/10/2023
|
$136.89
|
PP = $136.74
|
|
MB = $143.58
|
Most Recent Note - 6/22/2023 3:52:29 PM
G - Pulling back from its all-time high with today's loss after 4 consecutive gains. Very extended from any sound base. Its 50 DMA line ($145.72) defines near-term support to watch on pullbacks. Fundamentals remain strong.
>>> FEATURED STOCK ARTICLE : Extended From Any Sound Base and Hovering Near High - 6/15/2023 |
View all notes |
Set NEW NOTE alert |
Company Profile |
SEC
News |
Chart |
Request a new note
C
A
S
I |
Symbol/Exchange
Company Name
Industry Group |
PRICE |
CHANGE
(%Change) |
Day High |
Volume
(% DAV)
(% 50 day avg vol) |
52 Wk Hi
% From Hi |
Featured
Date |
Price
Featured |
Pivot Featured |
|
Max Buy |
SPSC
-
NASDAQ
SPS Commerce
Comp Sftwr-Spec Enterprs
|
$181.23
|
-1.56
-0.85% |
$186.39
|
178,045
102.32% of 50 DAV
50 DAV is 174,000
|
$185.99
-2.56%
|
4/24/2023
|
$150.01
|
PP = $157.56
|
|
MB = $165.44
|
Most Recent Note - 6/21/2023 7:12:30 PM
G - Pulled back slightly with lighter volume, stubbornly holding its ground near its 52-week high following an impressive streak of volume-driven gains, extended from the previously noted base. Reported Mar '23 quarterly earnings +22% on +20% versus the year-ago period, below the +25% minimum earnings guideline (C criteria) raising some fundamental concerns. See the latest FSU analysis for more details and a new annotated graph.
>>> FEATURED STOCK ARTICLE : Perched Near High Following Noted Volume-Driven Gains - 6/21/2023 |
View all notes |
Set NEW NOTE alert |
Company Profile |
SEC
News |
Chart |
Request a new note
C
A
S
I |
HUBB
-
NYSE
Hubbell
Electrical-Power/Equipmt
|
$319.45
|
+2.38
0.75% |
$324.42
|
306,030
73.21% of 50 DAV
50 DAV is 418,000
|
$326.62
-2.20%
|
4/25/2023
|
$262.85
|
PP = $257.51
|
|
MB = $270.39
|
Most Recent Note - 6/22/2023 5:26:38 PM
G - Very extended from the prior base. Prior highs in the $263 area define initial support to watch on pullbacks. Fundamentals remain strong. See the latest FSU analysis for more details and a new annotated graph.
>>> FEATURED STOCK ARTICLE : Hubbell on Track for 11th Weekly Gain - 6/22/2023 |
View all notes |
Set NEW NOTE alert |
Company Profile |
SEC
News |
Chart |
Request a new note
C
A
S
I |
NVR
-
NYSE
NVR
Bldg-Resident/Comml
|
$6,149.08
|
-11.13
-0.18% |
$6,253.47
|
21,803
87.21% of 50 DAV
50 DAV is 25,000
|
$6,169.37
-0.33%
|
4/25/2023
|
$5,882.18
|
PP = $5,978.25
|
|
MB = $6,277.16
|
Most Recent Note - 6/26/2023 6:32:01 PM
G - There was a "negative reversal" today after hitting another new all-time high. Its 50 DMA line ($5,824) defines near-term support watch on pullbacks. Reported Mar '23 quarterly earnings -14% on -3% sales revenues versus the year-ago period, below the +25% minimum earnings guideline (C criteria) raising fundamental concerns, and its color code was changed to green.
>>> FEATURED STOCK ARTICLE : Rebounded Above 50 Day Average With Light Volume Gains - 6/6/2023 |
View all notes |
Set NEW NOTE alert |
Company Profile |
SEC
News |
Chart |
Request a new note
C
A
S
I |
PHM
-
NYSE
PulteGroup
Bldg-Resident/Comml
|
$76.03
|
-0.24
-0.31% |
$77.48
|
2,266,332
73.89% of 50 DAV
50 DAV is 3,067,000
|
$76.52
-0.64%
|
4/25/2023
|
$65.17
|
PP = $64.01
|
|
MB = $67.21
|
Most Recent Note - 6/26/2023 6:27:37 PM
G - There was a "negative reversal" today after hitting yet another new high . Very extended from any sound base. Reported earnings +28% for the Mar '23 quarter versus the year-ago period. Important support to watch is defined by its 50 DMA line ($68.40). See the latest FSU analysis for more details and a new annotated graph.
>>> FEATURED STOCK ARTICLE : Negative Reversal After Hitting Another New High - 6/26/2023 |
View all notes |
Set NEW NOTE alert |
Company Profile |
SEC
News |
Chart |
Request a new note
C
A
S
I |
COKE
-
NASDAQ
Coca-Cola Consolidated
Beverages-Non-Alcoholic
|
$639.57
|
-14.50
-2.22% |
$654.07
|
45,333
116.24% of 50 DAV
50 DAV is 39,000
|
$694.20
-7.87%
|
5/4/2023
|
$646.66
|
PP = $656.21
|
|
MB = $689.02
|
Most Recent Note - 6/26/2023 6:35:42 PM
Y - Pulled back today with average volume. Important near-term support is its 50 DMA line ($630). Fundamentals remain strong.
>>> FEATURED STOCK ARTICLE : Fell Below Pivot Point With Recent Volume-Driven Losses - 6/14/2023 |
View all notes |
Set NEW NOTE alert |
Company Profile |
SEC
News |
Chart |
Request a new note
C
A
S
I |
Symbol/Exchange
Company Name
Industry Group |
PRICE |
CHANGE
(%Change) |
Day High |
Volume
(% DAV)
(% 50 day avg vol) |
52 Wk Hi
% From Hi |
Featured
Date |
Price
Featured |
Pivot Featured |
|
Max Buy |
AMPH
-
NASDAQ
Amphastar Pharm
Medical-Biomed/Biotech
|
$55.30
|
-1.86
-3.25% |
$58.39
|
653,210
139.87% of 50 DAV
50 DAV is 467,000
|
$58.70
-5.79%
|
5/15/2023
|
$43.56
|
PP = $44.15
|
|
MB = $46.36
|
Most Recent Note - 6/26/2023 6:34:06 PM
G - Pulled back from its all-time high with today's 2nd consecutive volume-driven loss. Very extended from any sound base. Prior highs in the $44 area define important support to watch coinciding with its 50 DMA line. Fundamentals remain strong.
>>> FEATURED STOCK ARTICLE : Hit Another New High With 4th Consecutive Volume-Driven Gain - 6/20/2023 |
View all notes |
Set NEW NOTE alert |
Company Profile |
SEC
News |
Chart |
Request a new note
C
A
S
I |
ANET
-
NYSE
Arista Networks
Computer-Networking
|
$150.82
|
+2.00
1.34% |
$153.23
|
2,748,845
76.12% of 50 DAV
50 DAV is 3,611,000
|
$178.36
-15.44%
|
5/30/2023
|
$176.35
|
PP = $171.54
|
|
MB = $180.12
|
Most Recent Note - 6/21/2023 7:15:08 PM
G - Color code is changed to green after slumping below its 50 DMA line ($153.62) with near-average volume behind today's 4th consecutive loss. Only a prompt rebound above the 50 DMA line would help its outlook improve. Fundamentals remain strong.
>>> FEATURED STOCK ARTICLE : Rebounding Near Recent High With 3 Consecutive Gains - 6/12/2023 |
View all notes |
Set NEW NOTE alert |
Company Profile |
SEC
News |
Chart |
Request a new note
C
A
S
I |
PANW
-
NASDAQ
Palo Alto Networks
Computer Sftwr-Security
|
$243.80
|
-0.14
-0.06% |
$250.55
|
4,653,396
77.84% of 50 DAV
50 DAV is 5,978,000
|
$249.26
-2.19%
|
6/5/2023
|
$228.35
|
PP = $213.73
|
|
MB = $224.42
|
Most Recent Note - 6/22/2023 3:53:47 PM
G - Hitting a new all-time high with today's gain backed by near-average volume. Very extended from the prior high ($213) which defines initial support to watch on pullbacks. Fundamentals remain strong.
>>> FEATURED STOCK ARTICLE : Palo Alto Powers to New Highs Again - 6/5/2023 |
View all notes |
Set NEW NOTE alert |
Company Profile |
SEC
News |
Chart |
Request a new note
C
A
S
I |
LSCC
-
NASDAQ
Lattice Semiconductor
Elec-Semicondctor Fablss
|
$86.28
|
+0.93
1.09% |
$88.27
|
1,398,742
56.54% of 50 DAV
50 DAV is 2,474,000
|
$96.82
-10.89%
|
6/13/2023
|
$91.73
|
PP = $96.92
|
|
MB = $101.77
|
Most Recent Note - 6/22/2023 4:00:47 PM
Y - Posting a solid gain today backed by light volume after testing its 50 DMA line ($84.79). More damaging losses would raise concerns. Subsequent gains above the pivot point backed by at least +40% above average volume may trigger a technical buy signal. Reported Mar '23 quarterly earnings +38% on +22% sales revenues versus the year-ago period, its 9th consecutive strong quarterly comparison above the +25% minimum earnings guideline (C criteria). Annual earnings history (A criteria) has been strong.
>>> FEATURED STOCK ARTICLE : Lattice Posts Volume-Driven Gains Approaching Prior High - 6/13/2023 |
View all notes |
Set NEW NOTE alert |
Company Profile |
SEC
News |
Chart |
Request a new note
C
A
S
I |
|
|
|
THESE ARE NOT BUY RECOMMENDATIONS!
Comments contained in the body of this report are technical
opinions only. The material herein has been obtained
from sources believed to be reliable and accurate, however,
its accuracy and completeness cannot be guaranteed.
This site is not an investment advisor, hence it does
not endorse or recommend any securities or other investments.
Any recommendation contained in this report may not
be suitable for all investors and it is not to be deemed
an offer or solicitation on our part with respect to
the purchase or sale of any securities. All trademarks,
service marks and trade names appearing in this report
are the property of their respective owners, and are
likewise used for identification purposes only.
This report is a service available
only to active Paid Premium Members.
You may opt-out of receiving report notifications
at any time. Questions or comments may be submitted
by writing to Premium Membership Services 665 S.E. 10 Street, Suite 201 Deerfield Beach, FL 33441-5634 or by calling 1-800-965-8307
or 954-785-1121.
|
|
|