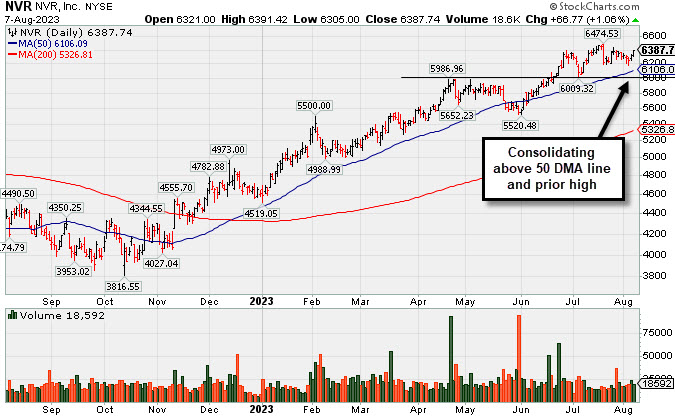
Consolidating Above 50 DMA After 2nd Subpar Earnings Report - Monday, August 7, 2023
NVR Inc (NVR +$66.77 or +1.06% to $6,387.74) posted a 2nd consecutive gain today with below-average volume. It is consolidating above its 50-day moving average (DMA) line ($6,106) which defines near-term support watch above its prior low ($6,009 on 7/06). It recently reported Jun '23 quarterly earnings -6% on -13% sales revenues, a 2nd subpar quarterly comparison, raising greater fundamental concerns. Annual earnings (A criteria) growth has been very strong. However, after the latest subpar quarter it has an 81 Earnings Per Share Rating, just above the 80+ minimum for buy candidates.
NVR was last shown in this FSU section in detail on 6/30/23 with an annotated graph under the headline, "New High Close for Strong Homebuilder". It was highlighted in yellow in the 4/25/23 mid-day report (read here) with pivot point cited based on its 12/30/21 high plus 10 cents.
Chart courtesy of www.stockcharts.com
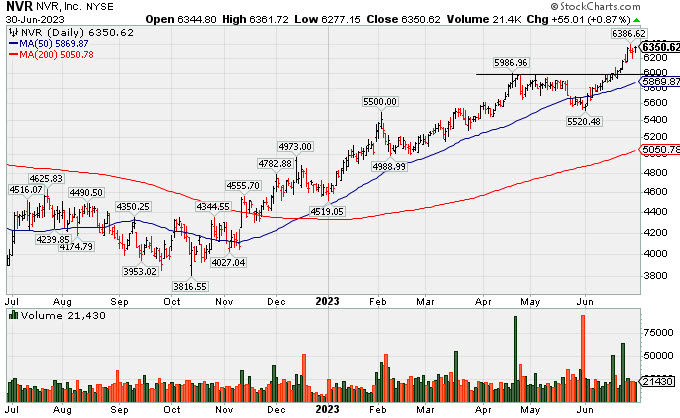
New High Close for Strong Homebuilder -
NVR Inc (NVR +$55.01 or +0.87% to $6,350.62) managed a best-ever close today and remains perched at ts all-time high. Its 50-day moving average (DMA) line ($5,824) defines near-term support watch on pullbacks.
NVR was last shown in this FSU section in detail on 6/06/23 with an annotated graph under the headline, "Rebounded Above 50 Day Average With Light Volume Gains". It was highlighted in yellow in the 4/25/23 mid-day report (read here) with pivot point cited based on its 12/30/21 high plus 10 cents. Concerns were soon raised, however, after it reported Mar '23 quarterly earnings -14% on -8% sales revenues, a noted fundamental flaw. Prior quarterly comparisons were above the +25% minimum earnings guideline (C criteria). Annual earnings (A criteria) growth has been very strong. Despite the latest subpar quarter it still has a 91 Earnings Per Share Rating, well abov the 80+ minimum for buy candidates.
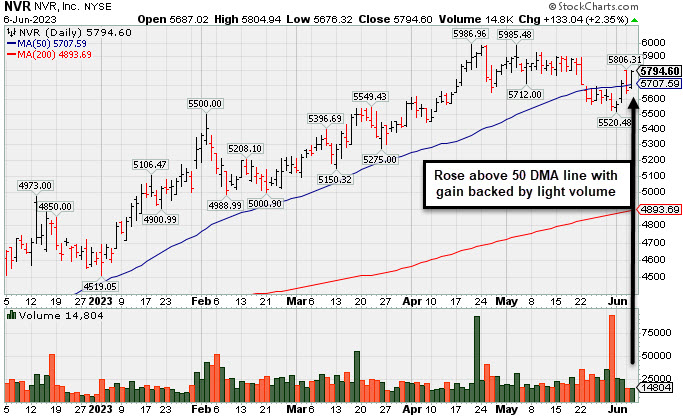
Rebounded Above 50 Day Average With Light Volume Gains - Tuesday, June 6, 2023
NVR Inc (NVR +$133.04 or +2.35% to $5,794.60) rebounded above its 50-day moving average (DMA) line ($5,707) with today's gain backed by light volume helping its technical stance. It has sputtered since last shown in this FSU section in detail on 4/27/23 with an annotated graph under the headline, "Fell From High and Raised Concern With Subpar Mar '23 Report".
NVR was highlighted in yellow in the 4/25/23 mid-day report (read here) with pivot point cited based on its 12/30/21 high plus 10 cents. Concerns were soon raised, however, after it reported Mar '23 quarterly earnings -14% on -8% sales revenues, a noted fundamental flaw. Earnings had risen +50% on +23% sales revenues for the Dec '22 quarter versus the year-ago period, and prior quarterly comparisons were above the +25% minimum earnings guideline (C criteria). Annual earnings (A criteria) growth has been very strong. Despite the latest subpar quarter it still has a 91 Earnings Per Share Rating, well abov the 80+ minimum for buy candidates.
Chart courtesy of www.stockcharts.com
| Symbol/Exchange Company Name Industry Group | PRICE | CHANGE | Day High | Volume (% DAV) (% 50 day avg vol) | 52 Wk Hi | Featured Date | Price Featured | Pivot Featured |
| Max Buy | ||||||||
Graphic Packaging Paper and Paper Products | $25.84 | +0.39 1.53% | $26.01 | 3,180,957 50 DAV is 2,772,000 | $26.16 -1.22% | 10/25/2022 | $22.75 | PP = $24.17 |
| MB = $25.38 | ||||||||
G - Rebounded above its 50 DMA line ($25.11) and it is perched within close striking distance of its all-time high with today's 4th consecutive gain. It has not formed a sound new base of sufficient length. Quickly recovered after testing its 4/27/23 low last week. Reported Mar '23 quarterly earnings +60% on +9% sales revenues versus the year-ago period. >>> FEATURED STOCK ARTICLE : Packaging Firm Due to Report Earnings News - 5/1/2023 | View all notes | Set NEW NOTE alert | Company Profile | SEC News | Chart | Request a new note | ||||||||
Sterling Infrastructure Bldg-Heavy Construction | $51.68 | +1.76 3.53% | $51.73 | 345,312 50 DAV is 243,000 | $49.97 3.42% | 12/14/2022 | $32.41 | PP = $33.72 |
| MB = $35.41 | ||||||||
G - Hitting yet another new all-time high today, getting more extended from any sound base with today's 13th base in the span of 14 sessions. Bullish action has continued although it reported Mar '23 quarterly earnings +0% on +10% sales revenues versus the year-ago period, below the +25% minimum earnings guideline (C criteria) raising fundamental concerns. >>> FEATURED STOCK ARTICLE : 50-Day Moving Average Line Acted as Recent Resistance - 4/28/2023 | View all notes | Set NEW NOTE alert | Company Profile | SEC News | Chart | Request a new note | ||||||||
Comfort Systems USA Bldg-A/C and Heating Prds | $158.84 | +6.56 4.31% | $159.50 | 310,920 50 DAV is 275,000 | $156.19 1.70% | 4/27/2023 | $148.85 | PP = $152.23 |
| MB = $159.84 | ||||||||
Y - Hitting a new all-time high and approaching its "max buy" level with today's big gain backed by light volume. No resistance remains due to overhead supply, however, it has made very little headway in recent weeks. It was repeatedly noted - "Subsequent gains and new highs backed by at least +40% above average volume may help reconfirm a technical buy signal." >>> FEATURED STOCK ARTICLE : Churning Action While Recently Hovering Near All-Time High - 5/12/2023 | View all notes | Set NEW NOTE alert | Company Profile | SEC News | Chart | Request a new note | ||||||||
Coca-Cola Femsa ADR Beverages-Non-Alcoholic | $85.11 | +0.46 0.54% | $85.25 | 147,789 50 DAV is 195,000 | $91.23 -6.71% | 3/7/2023 | $76.63 | PP = $77.11 |
| MB = $80.97 | ||||||||
| Most Recent Note - 6/2/2023 1:30:12 PM G - Finding support near its 50 DMA line ($84.35) with today's 2nd gain backed by lighter volume following 7 consecutive losses marked by higher volume. More damaging losses would trigger a technical sell signal. Reported Mar '23 quarterly earnings +53% on +24% sales revenues versus the year-ago period. Prior highs in the $79-$77 area define the next support to watch below its 50 DMA line. >>> FEATURED STOCK ARTICLE : Posted Gain Afrer Reporting Strong Mar '23 Quarterly Results - 5/2/2023 | View all notes | Set NEW NOTE alert | Company Profile | SEC News | Chart | Request a new note | ||||||||
Clean Harbors Pollution Control | $153.28 | +4.22 2.83% | $153.87 | 540,608 50 DAV is 378,000 | $151.30 1.31% | 3/10/2023 | $136.89 | PP = $136.74 |
| MB = $143.58 | ||||||||
G - Hitting yet another new all-time high with today's big gain backed by below average volume. Its 50 DMA line ($141) defines near-term support to watch on pullbacks. Reported Mar '23 quarterly earnings +64% on +12% sales revenues versus the year-ago period. Fundamentals remain strong. >>> FEATURED STOCK ARTICLE : Showed Resilience Near 50-Day Moving Average Following Sell-Off - 5/10/2023 | View all notes | Set NEW NOTE alert | Company Profile | SEC News | Chart | Request a new note | ||||||||
| Symbol/Exchange Company Name Industry Group | PRICE | CHANGE | Day High | Volume (% DAV) (% 50 day avg vol) | 52 Wk Hi | Featured Date | Price Featured | Pivot Featured |
| Max Buy | ||||||||
SPS Commerce Comp Sftwr-Spec Enterprs | $169.76 | +6.07 3.71% | $170.90 | 199,096 50 DAV is 141,000 | $164.69 3.08% | 4/24/2023 | $150.01 | PP = $157.56 |
| MB = $165.44 | ||||||||
G - Color code is changed to green while rising above its "max buy" level and hitting a new 52-week high with today's 4th consecutive gain backed by near average volume. Gains above the pivot point were not backed by +40% above average volume, so it did not trigger a proper technical buy signal. Reported Mar '23 quarterly earnings +22% on +20% versus the year-ago period, below the +25% minimum earnings guideline (C criteria) raising some fundamental concerns. >>> FEATURED STOCK ARTICLE : Pulled Back After Quietly Wedging to New Highs - 5/31/2023 | View all notes | Set NEW NOTE alert | Company Profile | SEC News | Chart | Request a new note | ||||||||
Hubbell Electrical-Power/Equipmt | $296.17 | +1.93 0.66% | $297.46 | 206,829 50 DAV is 406,000 | $296.28 -0.04% | 4/25/2023 | $262.85 | PP = $257.51 |
| MB = $270.39 | ||||||||
| Most Recent Note - 6/2/2023 4:03:47 PM G - Gapped up today and posted a solid gain with lighter volume for another new all-time high, getting more extended from the prior base. Prior highs in the $263 area define initial support to watch on pullbacks. Fundamentals remain strong. See the latest FSU analysis for more details and an annotated graph. >>> FEATURED STOCK ARTICLE : Extended From Prior Base and Perched Near High - 6/1/2023 | View all notes | Set NEW NOTE alert | Company Profile | SEC News | Chart | Request a new note | ||||||||
NVR Bldg-Resident/Comml | $5,794.60 | +133.04 2.35% | $5,804.94 | 14,804 50 DAV is 23,000 | $5,986.96 -3.21% | 4/25/2023 | $5,882.18 | PP = $5,978.25 |
| MB = $6,277.16 | ||||||||
G - Rebounded further above its 50 DMA line ($5,707) with today's light volume gain helping its technical stance. Reported Mar '23 quarterly earnings -14% on -3% sales revenues versus the year-ago period, below the +25% minimum earnings guideline (C criteria) raising fundamental concerns, and its color code was changed to green. Prior quarterly comparisons were well above the +25% minimum earnings guideline (C criteria). Annual earnings (A criteria) growth has been very strong. See the latest FSU analysis for more details and a new annotated graph. >>> FEATURED STOCK ARTICLE : Rebounded Above 50 Day Average With Light Volume Gains - 6/6/2023 | View all notes | Set NEW NOTE alert | Company Profile | SEC News | Chart | Request a new note | ||||||||
PulteGroup Bldg-Resident/Comml | $72.18 | +2.76 3.98% | $72.25 | 3,159,189 50 DAV is 2,843,000 | $70.54 2.32% | 4/25/2023 | $65.17 | PP = $64.01 |
| MB = $67.21 | ||||||||
G - Hitting another new high with today's 4th consecutive gain backed by light volume, getting extended from any sound base. Reported earnings +28% for the Mar '23 quarter versus the year-ago period. Important support to watch is its 50 DMA line ($64.31). See the latest FSU analysis for more details and an annotated graph. >>> FEATURED STOCK ARTICLE : Rebounded Above "Max Buy" Level Toward Recent High - 6/2/2023 | View all notes | Set NEW NOTE alert | Company Profile | SEC News | Chart | Request a new note | ||||||||
Coca-Cola Consolidated Beverages-Non-Alcoholic | $682.60 | +17.02 2.56% | $683.50 | 44,749 50 DAV is 34,000 | $694.20 -1.67% | 5/4/2023 | $646.66 | PP = $656.21 |
| MB = $689.02 | ||||||||
| Most Recent Note - 6/5/2023 2:47:33 PM Y - Color code is changed to yellow today after pulling back below its "max buy" level. Bullish action came after it reported Mar '23 quarterly earnings +93% on +12% sales revenues versus the year-ago period, continuing its strong earnings track record. >>> FEATURED STOCK ARTICLE : COKE is Showing Real Strength - 5/4/2023 | View all notes | Set NEW NOTE alert | Company Profile | SEC News | Chart | Request a new note | ||||||||
| Symbol/Exchange Company Name Industry Group | PRICE | CHANGE | Day High | Volume (% DAV) (% 50 day avg vol) | 52 Wk Hi | Featured Date | Price Featured | Pivot Featured |
| Max Buy | ||||||||
Amphastar Pharm Medical-Biomed/Biotech | $45.88 | -0.13 -0.28% | $46.43 | 478,209 50 DAV is 394,000 | $46.86 -2.09% | 5/15/2023 | $43.56 | PP = $44.15 |
| MB = $46.36 | ||||||||
| Most Recent Note - 6/2/2023 1:24:42 PM Y - Hitting a new all-time high and trading near its "max buy" level with today's 5th consecutive gain backed by ever-increasing volume but still below the +40% above average volume guideline. Subsequent gains and a strong close above the pivot point backed by at least +40% above average volume may clinch a technical buy signal. Fundamentals remain strong. >>> FEATURED STOCK ARTICLE : Weak Finish After Early Gain When Perched Near All-Time High - 5/15/2023 | View all notes | Set NEW NOTE alert | Company Profile | SEC News | Chart | Request a new note | ||||||||
Arista Networks Computer-Networking | $159.68 | -2.95 -1.81% | $161.41 | 3,005,643 50 DAV is 3,220,000 | $178.36 -10.47% | 5/30/2023 | $176.35 | PP = $171.54 |
| MB = $180.12 | ||||||||
| Most Recent Note - 6/2/2023 3:58:23 PM Y - Pulling back again today. Stalled this week after a streak of 4 consecutive volume-driven gains hitting a new high triggered a technical buy signal. Color code was changed to yellow with new pivot point cited based on its 3/23/23 high plus 10 cents in the 5/30/23 mid-day report. Reported Mar '23 quarterly earnings +70% on +54% sales revenues versus the year-ago period and fundamentals remain strong. >>> FEATURED STOCK ARTICLE : Technical Sell Signal Triggered by Damaging Volume-Driven Loss - 5/3/2023 | View all notes | Set NEW NOTE alert | Company Profile | SEC News | Chart | Request a new note | ||||||||
Palo Alto Networks Computer Sftwr-Security | $224.72 | -2.07 -0.91% | $226.86 | 5,373,228 50 DAV is 4,104,000 | $230.18 -2.37% | 6/5/2023 | $228.35 | PP = $213.73 |
| MB = $224.42 | ||||||||
| Most Recent Note - 6/5/2023 5:02:14 PM Y - Color code was changed to yellow in the earlier mid-day report with new pivot point cited based on its 4/20/22 high plus 10 cents. It powered to a new all-time high with today's gap up and 8th consecutive volume-driven gain, however, it is quickly getting extended from the lengthy new base. Share price was impacted by a 3:1 split on 9/14/22. Reported Apr '23 quarterly earnings +83% on +24% sales revenues versus the year-ago period, and prior quarterly comparisons were above the +25% minimum earnings guideline (C criteria). See the latest FSU analysis for more details and a new annotated graph. >>> FEATURED STOCK ARTICLE : Palo Alto Powers to New Highs Again - 6/5/2023 | View all notes | Set NEW NOTE alert | Company Profile | SEC News | Chart | Request a new note | ||||||||
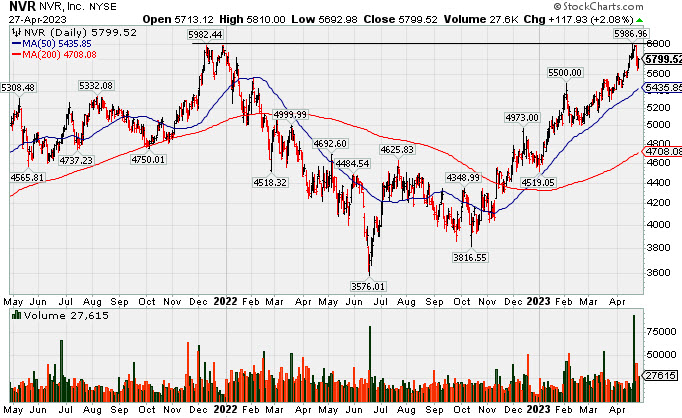
Fell From High and Raised Concern With Subpar Mar '23 Report - Thursday, April 27, 2023
NVR Inc (NVR +$120.63 or +2.12% to $5,802.22) was highlighted in yellow in the 4/25/23 mid-day report (read here) with pivot point cited based on its 12/30/21 high plus 10 cents. It pulled back after recently rallying to touch a new all-time high. Confirming gains and a close above the pivot point backed by at least +40% above average volume may clinch a proper technical buy signal.
Concerns were raised as it reported Mar '23 quarterly earnings -14% on -8% sales revenues, a noted new fundamental flaw. Earnings had risen +50% on +23% sales revenues for the Dec '22 quarter versus the year-ago period, and prior quarterly comparisons were above the +25% minimum earnings guideline (C criteria). Annual earnings (A criteria) growth has been very strong. It still has a 90 Earnings Per Share Rating.
Chart courtesy of www.stockcharts.com