You are not logged in.
This means you
CAN ONLY VIEW reports that were published prior to Tuesday, July 9, 2024.
You
MUST UPGRADE YOUR MEMBERSHIP if you want to see any current reports.
AFTER MARKET UPDATE - MONDAY, MARCH 11TH, 2024
Previous After Market Report Next After Market Report >>>
|
|
|
|
DOW |
+46.97 |
38,769.66 |
+0.12% |
|
Volume |
882,587,023 |
-7% |
|
Volume |
4,988,227,900 |
-8% |
|
NASDAQ |
-65.84 |
16,019.27 |
-0.41% |
|
Advancers |
1,384 |
50% |
|
Advancers |
1,722 |
40% |
|
S&P 500 |
-5.75 |
5,117.94 |
-0.11% |
|
Decliners |
1,405 |
50% |
|
Decliners |
2,562 |
60% |
|
Russell 2000 |
-16.83 |
2,065.88 |
-0.81% |
|
52 Wk Highs |
120 |
|
|
52 Wk Highs |
104 |
|
|
S&P 600 |
-6.23 |
1,304.52 |
-0.48% |
|
52 Wk Lows |
19 |
|
|
52 Wk Lows |
92 |
|
|
 |
Major Indices Showed Little Conviction but Leadership Waned
Kenneth J. Gruneisen - Passed the CAN SLIM® Master's Exam
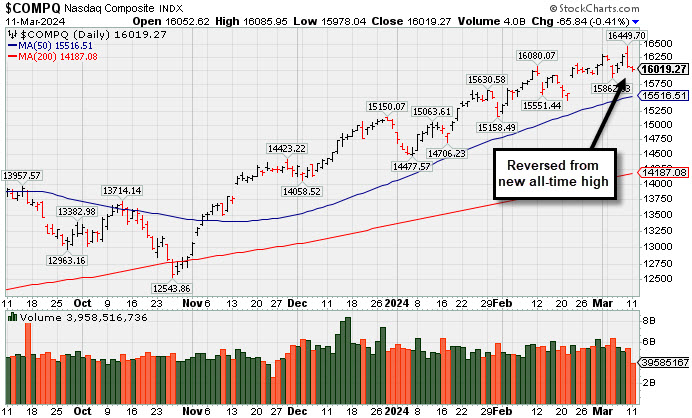
The market showed little conviction ahead of Tuesday's release of the February Consumer Price Index (CPI). The Dow Jones Industrial Average eked out a 0.1% gain, while the market-cap weighted S&P 500 declined -0.1% and the Nasdaq Composite fell -0.4%. Volume reported was lighter that the prior session total on the NYSE and on the Nasdaq exchange. Decliners led advancers by a narrow margin on the NYSE and on the Nasdaq exchange. Leadership clearly contracted as there were 22 high-ranked companies from the Leaders List that hit new 52-week highs and were listed on the BreakOuts Page, versus the total of 101 on the prior session. New 52-week highs totals contracted yet still outnumbered new 52-week lows totals on the NYSE and on the Nasdaq exchange. The major indices are in a confirmed uptrend (M criteria). New buying efforts should be only made in stocks fitting all key criteria of the fact-based investment system.
PICTURED: The Nasdaq Composite Index reversed from a new all-time high on the prior session.
Ongoing selling in some mega cap and semiconductor-related names including NVIDIA (NVDA -2.0%) and Meta Platforms (META -4.4%) created a drag on the major market averages. Applied Materials (AMAT -2.0%) pulled back after raising its quarterly dividend by 25% to $0.40 per share.
Losses weighed on the S&P 500 information technology sector, which declined -0.4%. Alphabet (GOOG +1.94%) closed with a gain but the communication services sector still settled -0.2% lower. The industrial sector was another laggard, dropping -0.5%, as a loss in Boeing (BA -3.02%) created a drag after the Justice Department opened a criminal probe of the door plug issue.
The S&P 500 energy sector was among the top performing sectors, gaining +1.0%. EQT (EQT -7.8%) fell while confirming a merger agreement with Equitrans Midstream Corporation (ETRN +1.5%) with an initial enterprise value over $35 billion. The materials (+1.1%) and consumer staples (+0.6%) sectors were also among the top gainers.
A fresh $56 billion 3-yr note auction met solid demand. Treasuries settled with losses as the 2-yr note yield rose four basis points to 4.53% and the 10-yr note yield rose two basis points to 4.10%. |
 Kenneth J. Gruneisen started out as a licensed stockbroker in August 1987, a couple of months prior to the historic stock market crash that took the Dow Jones Industrial Average down -22.6% in a single day. He has published daily fact-based fundamental and technical analysis on high-ranked stocks online for two decades. Through FACTBASEDINVESTING.COM, Kenneth provides educational articles, news, market commentary, and other information regarding proven investment systems that work in good times and bad.
Comments contained in the body of this report are technical opinions only and are not necessarily those of Gruneisen Growth Corp. The material herein has been obtained from sources believed to be reliable and accurate, however, its accuracy and completeness cannot be guaranteed. Our firm, employees, and customers may effect transactions, including transactions contrary to any recommendation herein, or have positions in the securities mentioned herein or options with respect thereto. Any recommendation contained in this report may not be suitable for all investors and it is not to be deemed an offer or solicitation on our part with respect to the purchase or sale of any securities. |
|
 |
Retail and Semiconductor Indexes Fell; Commodity-Linked Groups Rose
Kenneth J. Gruneisen - Passed the CAN SLIM® Master's Exam
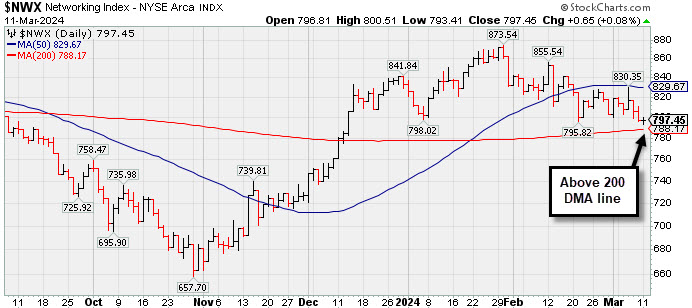
The Retail Index ($RLX -1.27%) slumped and weighed on the major averages while the Broker/Dealer Index ($XBD -0.18%) inched lower and the Bank Index ($BKX +0.12%) inched higher. The tech sector was mixed as the Semiconductor Index ($SOX -1.36%) slumped while the Networking Index ($NWX +0.08%) finished flat and the Biotech Index ($BTK +0.49%) edged higher. Commodity-linked groups had a positive bias as the Gold & Silver Index ($XAU +2.24%), Oil Services Index ($OSX +1.56%) and the Integrated Oil Index ($XOI +0.86%) all notched solid gains.
![]() PICTURED: The Networking Index ($NWX +0.08%) is consolidating above its 200-day moving average (DMA) line.
|
|
|
 |
Encountered Distributional Pressure After Spiking to New High
Kenneth J. Gruneisen - Passed the CAN SLIM® Master's Exam
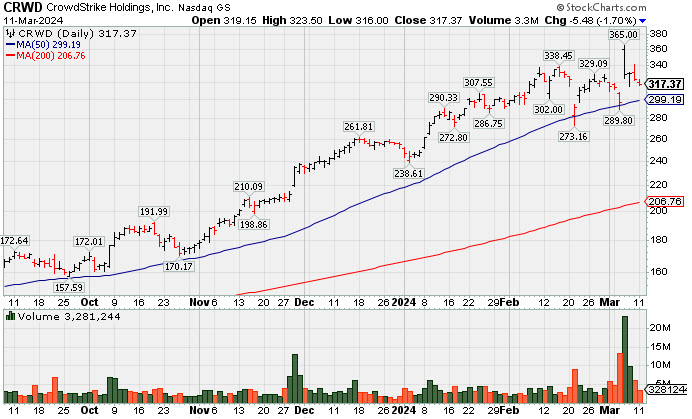
CrowdStrike Holdings (CRWD -$5.48 or -1.70% to $317.37) remains perched near its all-time high but enduring noted distributional pressure. Its 50-day moving average (DMA) line ($299) recently acted as support.
Fundamentals remain strong after it reported Jan '24 quarterly earnings +102% on +33% sales revenues versus the year-ago period, extending its streak of strong earnings increases well above the +25% minimum guideline (C criteria) in quarterly comparisons. CRWD was last shown in detail in this FSU section on 2/08/24 with an annotated graph under the headline "Volume Totals Cooking While Stubbornly Perched at All-Time High". It has a highest possible 99 Earnings Per Share rating. Its annual earnings (A criteria) history has been strong.
CRWD completed its $34 IPO on 6/12/19. The number of top-rated funds owning its shares rose from 1,880 in Jun 23 to 2,245 in Dec '23, a reassuring sign concerning the I criteria. Its current Up/Down Volume Ratio of 1.3 is an unbiased indication its shares have been under accumulation over the past 50 days.
Chart courtesy of www.stockcharts.com
 Symbol/Exchange
Company Name
Industry Group | PRICE | CHANGE
(%Change) | Day High | Volume
(% DAV)
(% 50 day avg vol) | 52 Wk Hi
% From Hi | Featured
Date | Price
Featured | Pivot Featured | | Max Buy |  ANET - NYSE ANET - NYSE
Arista Networks
Computer-Networking | $271.02 | -2.09
-0.77% | $271.78 | 2,026,972
89.81% of 50 DAV
50 DAV is 2,257,000 | $292.66
-7.39%
| 10/31/2023 | $188.84 | PP = $198.80 | | MB = $208.74 | Most Recent Note - 3/8/2024 12:42:45 PM
G - Pulling back today after recently wedging higher with gains lacking great volume conviction. Its 50 DMA line ($262) defines important near-term support to watch.
>>> FEATURED STOCK ARTICLE : Best Ever Close for Arista Networks - 3/1/2024 | View all notes | Set NEW NOTE alert | Company Profile | SEC News | Chart | Request a new note C A S I | NVO - NYSE
Novo Nordisk ADR
Medical-Ethical Drugs | $131.24 | -1.83
-1.38% | $133.52 | 5,727,188
109.28% of 50 DAV
50 DAV is 5,241,000 | $138.28
-5.09%
| 3/1/2024 | $124.23 | PP = $124.97 | | MB = $131.22 | Most Recent Note - 3/8/2024 12:22:57 PM
G - Gapped down today, pulling back from its all-time high after quickly powering well above its "max buy" level. Recent lows in the $118 area define initial support to watch above its 50 DMA line ($114.73).
>>> FEATURED STOCK ARTICLE : Extended From Any Sound Base After Volume-Driven Gains - 2/8/2024 | View all notes | Set NEW NOTE alert | Company Profile | SEC News | Chart | Request a new note C A S I | AXON - NASDAQ
Axon Enterprise
Security/Sfty | $311.04 | -1.75
-0.56% | $313.50 | 447,498
96.86% of 50 DAV
50 DAV is 462,000 | $325.63
-4.48%
| 11/8/2023 | $127.84 | PP = $223.30 | | MB = $234.47 |  Most Recent Note - 3/11/2024 11:02:52 PM Most Recent Note - 3/11/2024 11:02:52 PM
G - Stubbornly holding its ground near its all-time high. Bullish action came after it reported Dec '23 quarterly earnings +60% on +29% sales revenues versus the year-ago period. Its 50-day moving average (DMA) line ($268) defines near-term support above the prior high ($262.95 on 1/12/24).
>>> FEATURED STOCK ARTICLE : Reversal at All-Time High After 7 Consecutive Gains - 2/12/2024 | View all notes | Set NEW NOTE alert | Company Profile | SEC News | Chart | Request a new note C A S I | TDG - NYSE
TransDigm Group
Aerospace/Defense | $1,151.74 | -13.25
-1.14% | $1,158.84 | 253,924
115.95% of 50 DAV
50 DAV is 219,000 | $1,207.58
-4.62%
| 12/12/2023 | $1,000.39 | PP = $1,013.18 | | MB = $1,063.84 | Most Recent Note - 3/5/2024 9:15:39 PM
G - Pulled back today with average volume for a 2nd consecutive loss. Its 50 DMA line ($1,087) defines near-term support to watch.
>>> FEATURED STOCK ARTICLE : Transdigm Perched Near All-Time High - 2/14/2024 | View all notes | Set NEW NOTE alert | Company Profile | SEC News | Chart | Request a new note C A S I | CRWD - NASDAQ
CrowdStrike Holdings
Computer Sftwr-Security | $317.37 | -5.48
-1.70% | $323.50 | 3,281,336
79.34% of 50 DAV
50 DAV is 4,136,000 | $365.00
-13.05%
| 1/2/2024 | $246.42 | PP = $261.91 | | MB = $275.01 | Most Recent Note - 3/11/2024 10:58:05 PM
G - It is extended from any sound base and pulled back today with lighter volume. Its 50 DMA ($299) recently acted as support. Fundamentals remain strong after it reported Jan ''24 quarterly earnings +102% on +33% sales revenues versus the year-ago period. See the latest FSU analysis for more details and a new annotated graph.
>>> FEATURED STOCK ARTICLE : Encountered Distributional Pressure After Spiking to New High - 3/11/2024 | View all notes | Set NEW NOTE alert | Company Profile | SEC News | Chart | Request a new note C A S I | Symbol/Exchange
Company Name
Industry Group | PRICE | CHANGE
(%Change) | Day High | Volume
(% DAV)
(% 50 day avg vol) | 52 Wk Hi
% From Hi | Featured
Date | Price
Featured | Pivot Featured | | Max Buy | ELF - NYSE
e.l.f. Beauty
Cosmetics/Personal Care | $193.98 | -6.93
-3.45% | $199.30 | 1,364,941
89.62% of 50 DAV
50 DAV is 1,523,000 | $221.83
-12.55%
| 1/2/2024 | $138.23 | PP = $153.63 | | MB = $161.31 | Most Recent Note - 3/11/2024 11:04:25 PM
G - Pulled back today with below-average volume, retreating from its all-time high hit last week. Reported Dec '23 quarterly earnings +54% on +85% sales revenues versus the year-ago period, continuing its strong earnings track record. Its 50 DMA line ($170) defines important near-term support to watch.
>>> FEATURED STOCK ARTICLE : Encountering Distributional Pressure Near All-Time High - 3/8/2024 | View all notes | Set NEW NOTE alert | Company Profile | SEC News | Chart | Request a new note C A S I | KOF - NYSE
Coca Cola Femsa Sab Ads
FOOD and BEVERAGE - Beverages - Soft Drinks | $96.56 | +0.72
0.75% | $97.11 | 201,950
121.58% of 50 DAV
50 DAV is 166,100 | $104.38
-7.49%
| 1/12/2024 | $93.38 | PP = $99.34 | | MB = $104.31 | Most Recent Note - 3/6/2024 5:14:57 PM
Y - Still quietly consolidating above its 50 DMA line ($95.10) which defines important near-term support to watch. There was a noted "negative reversal" on 2/20/24 at its all-time high. Reported Dec ''23 quarterly earnings -13% on +24% sales revenues versus the year-ago period, raising fundamental concerns.
>>> FEATURED STOCK ARTICLE : Perched at High With Earnings News Due - 2/21/2024 | View all notes | Set NEW NOTE alert | Company Profile | SEC News | Chart | Request a new note C A S I | PCAR - NASDAQ
Paccar
Trucks and Parts-Hvy Duty | $114.05 | -0.60
-0.52% | $115.23 | 1,972,274
89.45% of 50 DAV
50 DAV is 2,205,000 | $116.88
-2.42%
| 1/23/2024 | $100.35 | PP = $98.57 | | MB = $103.50 | Most Recent Note - 3/8/2024 12:45:03 PM
G - Extended from any sound base and holding its ground stubbornly at its all-time high after steadily wedging higher with gains lacking great volume conviction. Its 50 DMA line ($103) defines near-term support to watch on pullbacks. Fundamentals remain strong.
>>> FEATURED STOCK ARTICLE : Extended From Any Sound Base After 7 Weekly Gains - 2/26/2024 | View all notes | Set NEW NOTE alert | Company Profile | SEC News | Chart | Request a new note C A S I | HUBB - NYSE
Hubbell
Electrical-Power/Equipmt | $387.43 | -5.71
-1.45% | $390.42 | 496,119
124.03% of 50 DAV
50 DAV is 400,000 | $396.92
-2.39%
| 1/30/2024 | $343.26 | PP = $336.83 | | MB = $353.67 | Most Recent Note - 3/5/2024 9:18:55 PM
G - Pulled back from its all-time high with today''s loss after 4 consecutive gains. Very extended from the previously noted base. Prior high ($340) and its 50 DMA line define important support to watch on pullbacks.
>>> FEATURED STOCK ARTICLE : Inched to New Highs With Average Volume - 2/28/2024 | View all notes | Set NEW NOTE alert | Company Profile | SEC News | Chart | Request a new note C A S I | MANH - NASDAQ
Manhattan Associates
Computer Sftwr-Enterprse | $255.41 | -2.09
-0.81% | $257.93 | 257,502
72.54% of 50 DAV
50 DAV is 355,000 | $266.94
-4.32%
| 1/31/2024 | $240.57 | PP = $230.71 | | MB = $242.25 | Most Recent Note - 3/7/2024 9:49:07 PM
G - Posted a solid gain today with +29% above average volume while rallying to a new all-time high, getting extended from the previously noted base. Prior highs in the $230 area along with its 50 DMA line ($232) define near-term support to watch on pullbacks.
>>> FEATURED STOCK ARTICLE : Hovering Near All-Time High After Streak of Small Gains - 2/29/2024 | View all notes | Set NEW NOTE alert | Company Profile | SEC News | Chart | Request a new note C A S I | Symbol/Exchange
Company Name
Industry Group | PRICE | CHANGE
(%Change) | Day High | Volume
(% DAV)
(% 50 day avg vol) | 52 Wk Hi
% From Hi | Featured
Date | Price
Featured | Pivot Featured | | Max Buy | USLM - NASDAQ
U.S. Lime & Minerals
Bldg-Cement/Concrt/Ag | $288.32 | +0.93
0.32% | $289.95 | 19,593
103.12% of 50 DAV
50 DAV is 19,000 | $289.34
-0.35%
| 2/9/2024 | $254.68 | PP = $265.09 | | MB = $278.34 | Most Recent Note - 3/8/2024 12:31:38 PM
G - Wedging to new all-time highs above its "max buy" level with recent gains lacking great volume conviction and its color code is changed to green. Recent gains above the pivot point were not backed by the minimum +40% above average volume necessary to trigger a proper technical buy signal. Through Dec '23 its quarterly and annual earnings (C and A criteria) history has been strong, a good match with the fact-based investment system's guidelines. Thinly traded firm has only 5.7 million shares outstanding (S criteria), which can contribute to greater price volatility in the event of institutional buying or selling.
>>> FEATURED STOCK ARTICLE : Strong Finish for Thinly Traded U.S Lime & Minerals - 2/9/2024 | View all notes | Set NEW NOTE alert | Company Profile | SEC News | Chart | Request a new note C A S I | NOW - NYSE
ServiceNow
Computer Sftwr-Enterprse | $756.74 | -0.94
-0.12% | $759.20 | 908,320
74.57% of 50 DAV
50 DAV is 1,218,000 | $815.32
-7.18%
| 2/22/2024 | $771.75 | PP = $815.32 | | MB = $856.09 | Most Recent Note - 3/7/2024 9:52:33 PM
Y - Gain today with higher volume helped it promptly rebound above its 50 DMA line ($750) helping its outlook to improve and its color code is changed to yellow. Recent lows define important near-term support to watch in the $730 area.
>>> FEATURED STOCK ARTICLE : Found Support With a Solid Gap Up from 10-Week Moving Average - 2/23/2024 | View all notes | Set NEW NOTE alert | Company Profile | SEC News | Chart | Request a new note C A S I | SNPS - NASDAQ
Synopsys
Computer Sftwr-Design | $565.32 | -5.97
-1.05% | $567.72 | 656,319
47.94% of 50 DAV
50 DAV is 1,369,000 | $629.38
-10.18%
| 2/22/2024 | $600.65 | PP = $582.85 | | MB = $611.99 | Most Recent Note - 3/5/2024 9:06:52 PM
Y - Suffered a big loss today with below-average volume, retreating from a best-ever close. Previously noted - "A strong volume-driven gain and close above the pivot point is needed to clinch a proper technical buy signal. Found support recently at its 50 DMA line ($538). Reported Jan ''24 quarterly earnings +36% on +21% sales revenues versus the year-ago period, its 3rd strong quarter above the +25% minimum earnings guideline (C criteria). Annual earnings growth (A criteria) has been strong and steady."
>>> FEATURED STOCK ARTICLE : Gapped Up for New High But Ended Near Session Low - 2/22/2024 | View all notes | Set NEW NOTE alert | Company Profile | SEC News | Chart | Request a new note C A S I | PAY - NYSE
Paymentus Holdings
Finance-CrdtCard/PmtPr | $20.82 | +1.61
8.38% | $21.07 | 859,933
419.48% of 50 DAV
50 DAV is 205,000 | $21.02
-0.95%
| 3/5/2024 | $19.97 | PP = $18.89 | | MB = $19.83 | Most Recent Note - 3/11/2024 12:21:50 PM
G - Challenging the 3/05/24 high with today's 2nd consecutive volume-driven gain and its color code is changed to green after rising above its "max buy" level. Prior highs in the $18 range define important initial support to watch on pullbacks.
>>> FEATURED STOCK ARTICLE : Big Gap Up Gain Triggered Technical Buy Signal - 3/5/2024 | View all notes | Set NEW NOTE alert | Company Profile | SEC News | Chart | Request a new note C A S I |
|
|
|
Color Codes Explained :
Y - Better candidates highlighted by our
staff of experts.
G - Previously featured
in past reports as yellow but may no longer be buyable under the
guidelines.
***Last / Change / Volume data in this table is the closing quote data***
Symbol/Exchange
Company Name
Industry Group |
PRICE |
CHANGE
(%Change) |
Day High |
Volume
(% DAV)
(% 50 day avg vol) |
52 Wk Hi
% From Hi |
Featured
Date |
Price
Featured |
Pivot Featured |
|
Max Buy |
 ANET
-
NYSE
ANET
-
NYSE
Arista Networks
Computer-Networking
|
$273.11
|
-13.37
-4.67% |
$287.31
|
3,204,418
144.47% of 50 DAV
50 DAV is 2,218,000
|
$292.66
-6.68%
|
10/31/2023
|
$188.84
|
PP = $198.80
|
|
MB = $208.74
|
Most Recent Note - 3/8/2024 12:42:45 PM
G - Pulling back today after recently wedging higher with gains lacking great volume conviction. Its 50 DMA line ($262) defines important near-term support to watch.
>>> FEATURED STOCK ARTICLE : Best Ever Close for Arista Networks - 3/1/2024 |
View all notes |
Set NEW NOTE alert |
Company Profile |
SEC
News |
Chart |
Request a new note
C
A
S
I |
NVO
-
NYSE
Novo Nordisk ADR
Medical-Ethical Drugs
|
$133.07
|
-2.85
-2.10% |
$134.83
|
12,645,155
251.75% of 50 DAV
50 DAV is 5,023,000
|
$138.28
-3.77%
|
3/1/2024
|
$124.23
|
PP = $124.97
|
|
MB = $131.22
|
Most Recent Note - 3/8/2024 12:22:57 PM
G - Gapped down today, pulling back from its all-time high after quickly powering well above its "max buy" level. Recent lows in the $118 area define initial support to watch above its 50 DMA line ($114.73).
>>> FEATURED STOCK ARTICLE : Extended From Any Sound Base After Volume-Driven Gains - 2/8/2024 |
View all notes |
Set NEW NOTE alert |
Company Profile |
SEC
News |
Chart |
Request a new note
C
A
S
I |
AXON
-
NASDAQ
Axon Enterprise
Security/Sfty
|
$312.69
|
-2.44
-0.77% |
$320.76
|
431,723
94.47% of 50 DAV
50 DAV is 457,000
|
$325.63
-3.97%
|
11/8/2023
|
$127.84
|
PP = $223.30
|
|
MB = $234.47
|
Most Recent Note - 3/4/2024 12:04:00 PM
G - Very extended from any sound base and hitting another new all-time high today. Bullish action came after it reported Dec '23 quarterly earnings +60% on +29% sales revenues versus the year-ago period. Volume and volatility often increase near earnings news. Prior highs in the $260-262 area define initial support to watch along with its 50-day moving average (DMA) line ($262.58).
>>> FEATURED STOCK ARTICLE : Reversal at All-Time High After 7 Consecutive Gains - 2/12/2024 |
View all notes |
Set NEW NOTE alert |
Company Profile |
SEC
News |
Chart |
Request a new note
C
A
S
I |
TDG
-
NYSE
TransDigm Group
Aerospace/Defense
|
$1,164.99
|
-9.70
-0.83% |
$1,180.00
|
204,547
94.26% of 50 DAV
50 DAV is 217,000
|
$1,207.58
-3.53%
|
12/12/2023
|
$1,000.39
|
PP = $1,013.18
|
|
MB = $1,063.84
|
Most Recent Note - 3/5/2024 9:15:39 PM
G - Pulled back today with average volume for a 2nd consecutive loss. Its 50 DMA line ($1,087) defines near-term support to watch.
>>> FEATURED STOCK ARTICLE : Transdigm Perched Near All-Time High - 2/14/2024 |
View all notes |
Set NEW NOTE alert |
Company Profile |
SEC
News |
Chart |
Request a new note
C
A
S
I |
CRWD
-
NASDAQ
CrowdStrike Holdings
Computer Sftwr-Security
|
$322.85
|
-6.83
-2.07% |
$341.74
|
5,948,150
146.80% of 50 DAV
50 DAV is 4,052,000
|
$365.00
-11.55%
|
1/2/2024
|
$246.42
|
PP = $261.91
|
|
MB = $275.01
|
Most Recent Note - 3/8/2024 12:04:38 PM
G - Perched near its all-time high but enduring noted distributional pressure. Its 50 DMA ($298) recently acted as support. Fundamentals remain strong after it reported Jan '24 quarterly earnings +102% on +33% sales revenues versus the year-ago period.
>>> FEATURED STOCK ARTICLE : Volume Totals Cooking While Stubbornly Perched at All-Time High - 2/6/2024 |
View all notes |
Set NEW NOTE alert |
Company Profile |
SEC
News |
Chart |
Request a new note
C
A
S
I |
Symbol/Exchange
Company Name
Industry Group |
PRICE |
CHANGE
(%Change) |
Day High |
Volume
(% DAV)
(% 50 day avg vol) |
52 Wk Hi
% From Hi |
Featured
Date |
Price
Featured |
Pivot Featured |
|
Max Buy |
ELF
-
NYSE
e.l.f. Beauty
Cosmetics/Personal Care
|
$200.91
|
-9.02
-4.30% |
$213.84
|
1,453,811
96.47% of 50 DAV
50 DAV is 1,507,000
|
$221.83
-9.43%
|
1/2/2024
|
$138.23
|
PP = $153.63
|
|
MB = $161.31
|
Most Recent Note - 3/8/2024 5:10:34 PM
G - Pulled back today with average volume, retreating from its all-time high hit this week. Reported Dec '23 quarterly earnings +54% on +85% sales revenues versus the year-ago period, continuing its strong earnings track record. Its 50 DMA line ($169.44) defines important near-term support to watch. See the latest FSU analysis for more details and a new annotated graph.
>>> FEATURED STOCK ARTICLE : Encountering Distributional Pressure Near All-Time High - 3/8/2024 |
View all notes |
Set NEW NOTE alert |
Company Profile |
SEC
News |
Chart |
Request a new note
C
A
S
I |
KOF
-
NYSE
Coca Cola Femsa Sab Ads
FOOD and BEVERAGE - Beverages - Soft Drinks
|
$95.84
|
-0.95
-0.98% |
$96.93
|
136,272
82.69% of 50 DAV
50 DAV is 164,800
|
$104.38
-8.18%
|
1/12/2024
|
$93.38
|
PP = $99.34
|
|
MB = $104.31
|
Most Recent Note - 3/6/2024 5:14:57 PM
Y - Still quietly consolidating above its 50 DMA line ($95.10) which defines important near-term support to watch. There was a noted "negative reversal" on 2/20/24 at its all-time high. Reported Dec '23 quarterly earnings -13% on +24% sales revenues versus the year-ago period, raising fundamental concerns.
>>> FEATURED STOCK ARTICLE : Perched at High With Earnings News Due - 2/21/2024 |
View all notes |
Set NEW NOTE alert |
Company Profile |
SEC
News |
Chart |
Request a new note
C
A
S
I |
PCAR
-
NASDAQ
Paccar
Trucks and Parts-Hvy Duty
|
$114.65
|
+0.32
0.28% |
$116.07
|
2,035,232
93.27% of 50 DAV
50 DAV is 2,182,000
|
$116.88
-1.91%
|
1/23/2024
|
$100.35
|
PP = $98.57
|
|
MB = $103.50
|
Most Recent Note - 3/8/2024 12:45:03 PM
G - Extended from any sound base and holding its ground stubbornly at its all-time high after steadily wedging higher with gains lacking great volume conviction. Its 50 DMA line ($103) defines near-term support to watch on pullbacks. Fundamentals remain strong.
>>> FEATURED STOCK ARTICLE : Extended From Any Sound Base After 7 Weekly Gains - 2/26/2024 |
View all notes |
Set NEW NOTE alert |
Company Profile |
SEC
News |
Chart |
Request a new note
C
A
S
I |
HUBB
-
NYSE
Hubbell
Electrical-Power/Equipmt
|
$393.14
|
+0.18
0.05% |
$396.92
|
428,687
108.53% of 50 DAV
50 DAV is 395,000
|
$393.37
-0.06%
|
1/30/2024
|
$343.26
|
PP = $336.83
|
|
MB = $353.67
|
Most Recent Note - 3/5/2024 9:18:55 PM
G - Pulled back from its all-time high with today's loss after 4 consecutive gains. Very extended from the previously noted base. Prior high ($340) and its 50 DMA line define important support to watch on pullbacks.
>>> FEATURED STOCK ARTICLE : Inched to New Highs With Average Volume - 2/28/2024 |
View all notes |
Set NEW NOTE alert |
Company Profile |
SEC
News |
Chart |
Request a new note
C
A
S
I |
MANH
-
NASDAQ
Manhattan Associates
Computer Sftwr-Enterprse
|
$257.32
|
-8.71
-3.27% |
$266.94
|
338,506
95.89% of 50 DAV
50 DAV is 353,000
|
$266.78
-3.55%
|
1/31/2024
|
$240.57
|
PP = $230.71
|
|
MB = $242.25
|
Most Recent Note - 3/7/2024 9:49:07 PM
G - Posted a solid gain today with +29% above average volume while rallying to a new all-time high, getting extended from the previously noted base. Prior highs in the $230 area along with its 50 DMA line ($232) define near-term support to watch on pullbacks.
>>> FEATURED STOCK ARTICLE : Hovering Near All-Time High After Streak of Small Gains - 2/29/2024 |
View all notes |
Set NEW NOTE alert |
Company Profile |
SEC
News |
Chart |
Request a new note
C
A
S
I |
Symbol/Exchange
Company Name
Industry Group |
PRICE |
CHANGE
(%Change) |
Day High |
Volume
(% DAV)
(% 50 day avg vol) |
52 Wk Hi
% From Hi |
Featured
Date |
Price
Featured |
Pivot Featured |
|
Max Buy |
USLM
-
NASDAQ
U.S. Lime & Minerals
Bldg-Cement/Concrt/Ag
|
$287.39
|
+4.39
1.55% |
$289.34
|
26,553
139.75% of 50 DAV
50 DAV is 19,000
|
$284.71
0.94%
|
2/9/2024
|
$254.68
|
PP = $265.09
|
|
MB = $278.34
|
Most Recent Note - 3/8/2024 12:31:38 PM
G - Wedging to new all-time highs above its "max buy" level with recent gains lacking great volume conviction and its color code is changed to green. Recent gains above the pivot point were not backed by the minimum +40% above average volume necessary to trigger a proper technical buy signal. Through Dec '23 its quarterly and annual earnings (C and A criteria) history has been strong, a good match with the fact-based investment system's guidelines. Thinly traded firm has only 5.7 million shares outstanding (S criteria), which can contribute to greater price volatility in the event of institutional buying or selling.
>>> FEATURED STOCK ARTICLE : Strong Finish for Thinly Traded U.S Lime & Minerals - 2/9/2024 |
View all notes |
Set NEW NOTE alert |
Company Profile |
SEC
News |
Chart |
Request a new note
C
A
S
I |
NOW
-
NYSE
ServiceNow
Computer Sftwr-Enterprse
|
$757.68
|
-10.40
-1.35% |
$777.57
|
1,026,475
85.04% of 50 DAV
50 DAV is 1,207,000
|
$815.32
-7.07%
|
2/22/2024
|
$771.75
|
PP = $815.32
|
|
MB = $856.09
|
Most Recent Note - 3/7/2024 9:52:33 PM
Y - Gain today with higher volume helped it promptly rebound above its 50 DMA line ($750) helping its outlook to improve and its color code is changed to yellow. Recent lows define important near-term support to watch in the $730 area.
>>> FEATURED STOCK ARTICLE : Found Support With a Solid Gap Up from 10-Week Moving Average - 2/23/2024 |
View all notes |
Set NEW NOTE alert |
Company Profile |
SEC
News |
Chart |
Request a new note
C
A
S
I |
SNPS
-
NASDAQ
Synopsys
Computer Sftwr-Design
|
$571.29
|
-12.06
-2.07% |
$586.26
|
686,424
49.14% of 50 DAV
50 DAV is 1,397,000
|
$629.38
-9.23%
|
2/22/2024
|
$600.65
|
PP = $582.85
|
|
MB = $611.99
|
Most Recent Note - 3/5/2024 9:06:52 PM
Y - Suffered a big loss today with below-average volume, retreating from a best-ever close. Previously noted - "A strong volume-driven gain and close above the pivot point is needed to clinch a proper technical buy signal. Found support recently at its 50 DMA line ($538). Reported Jan '24 quarterly earnings +36% on +21% sales revenues versus the year-ago period, its 3rd strong quarter above the +25% minimum earnings guideline (C criteria). Annual earnings growth (A criteria) has been strong and steady."
>>> FEATURED STOCK ARTICLE : Gapped Up for New High But Ended Near Session Low - 2/22/2024 |
View all notes |
Set NEW NOTE alert |
Company Profile |
SEC
News |
Chart |
Request a new note
C
A
S
I |
PAY
-
NYSE
Paymentus Holdings
Finance-CrdtCard/PmtPr
|
$19.21
|
+0.76
4.12% |
$19.24
|
378,230
189.12% of 50 DAV
50 DAV is 200,000
|
$21.02
-8.61%
|
3/5/2024
|
$19.97
|
PP = $18.89
|
|
MB = $19.83
|
Most Recent Note - 3/8/2024 12:24:56 PM
Y - Rising today after 2 consecutive volume-driven losses undercut the prior highs raised some concerns. Closed in the middle of its intra-day range with a considerable volume-driven gain after highlighted in yellow in the 3/05/24 mid-day report with pivot point cited based on its 12/26/23 high plus 10 cents. Reported Dec '23 quarterly earnings +175% on +25% sales revenues versus the year-ago period, its 3rd strong quarterly comparison well above the +25% minimum earnings guideline (C criteria). Annual earnings history (A criteria) has been strong since its $21 IPO in May '21.
>>> FEATURED STOCK ARTICLE : Big Gap Up Gain Triggered Technical Buy Signal - 3/5/2024 |
View all notes |
Set NEW NOTE alert |
Company Profile |
SEC
News |
Chart |
Request a new note
C
A
S
I |
|
|
|
THESE ARE NOT BUY RECOMMENDATIONS!
Comments contained in the body of this report are technical
opinions only. The material herein has been obtained
from sources believed to be reliable and accurate, however,
its accuracy and completeness cannot be guaranteed.
This site is not an investment advisor, hence it does
not endorse or recommend any securities or other investments.
Any recommendation contained in this report may not
be suitable for all investors and it is not to be deemed
an offer or solicitation on our part with respect to
the purchase or sale of any securities. All trademarks,
service marks and trade names appearing in this report
are the property of their respective owners, and are
likewise used for identification purposes only.
This report is a service available
only to active Paid Premium Members.
You may opt-out of receiving report notifications
at any time. Questions or comments may be submitted
by writing to Premium Membership Services 665 S.E. 10 Street, Suite 201 Deerfield Beach, FL 33441-5634 or by calling 1-800-965-8307
or 954-785-1121.
|
|
|