You are not logged in.
This means you
CAN ONLY VIEW reports that were published prior to Saturday, April 5, 2025.
You
MUST UPGRADE YOUR MEMBERSHIP if you want to see any current reports.
AFTER MARKET UPDATE - WEDNESDAY, DECEMBER 7TH, 2022
Previous After Market Report Next After Market Report >>>
|
|
|
|
DOW |
+1.58 |
33,597.92 |
+0.00% |
|
Volume |
897,120,165 |
-8% |
|
Volume |
4,294,803,000 |
-8% |
|
NASDAQ |
-56.34 |
10,958.55 |
-0.51% |
|
Advancers |
1,460 |
48% |
|
Advancers |
1,849 |
41% |
|
S&P 500 |
-7.34 |
3,933.92 |
-0.19% |
|
Decliners |
1,565 |
52% |
|
Decliners |
2,648 |
59% |
|
Russell 2000 |
-5.67 |
1,806.90 |
-0.31% |
|
52 Wk Highs |
38 |
|
|
52 Wk Highs |
72 |
|
|
S&P 600 |
-5.67 |
1,193.87 |
-0.47% |
|
52 Wk Lows |
102 |
|
|
52 Wk Lows |
329 |
|
|
 |
Major Indices Sputter While Investors Weigh Economic Concerns
Kenneth J. Gruneisen - Passed the CAN SLIM® Master's Exam
The Dow gained 1 point, while the Nasdaq Composite fell 0.5%. The S&P 500 declined 0.2%. Volume totals were lighter than the prior session on the NYSE and on the Nasdaq exchange. Breadth was slightly negative as decliners led advancers by a narrow margin on the NYSE and nearly 3-2 the Nasdaq exchange. There were 11 high-ranked companies from the Leaders List that hit new 52-week highs and were listed on the BreakOuts Page, versus the total of 7 on the prior session. New 52-week lows totals outnumbered new 52-week highs on the NYSE and on the Nasdaq exchange. The market uptrend (M criteria) encountered some pressure. Healthy leadership (new 52-week highs totals) must continue for the rally be productive, but new highs totals have recently contracted. Only stocks meeting all key-criteria of the fact-based investment system should be considered as buy candidates.
Chart courtesy of www.stockcharts.com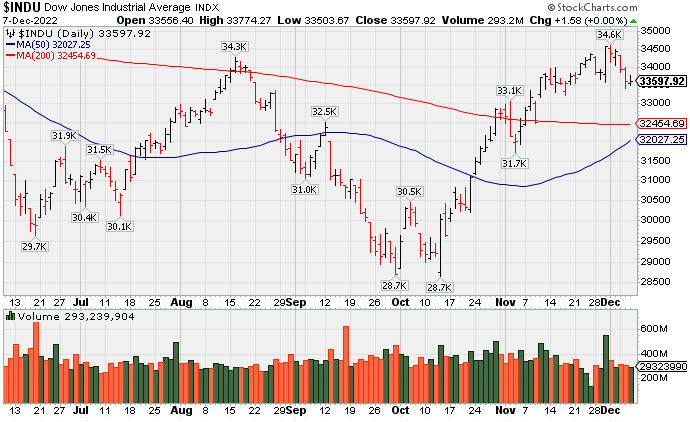 PICTURED: The Dow Jones Industrial Average has been consolidating well above its 200-day moving average (DMA) line and is considered to be in "healthy" shape.
U.S. equities closed mixed Wednesday as investors continued to weigh the risks of a possible recession. Earlier this week the U.S. economy reported stronger-than-anticipated data, heightening investor concerns that the Federal Reserve (Fed) may keep interest rate hikes elevated to combat inflation. Eight of 11 sectors in the S&P 500 finished in negative territory, with Communication Services leading laggards.
On the data front, nonfarm productivity increased slightly (0.8%) in the third quarter, up from the second quarter’s 0.3% print. The finalized third quarter reading for unit labor costs rose 2.4% versus the expected 3.1%. Meanwhile, October’s consumer credit came in higher-than-expected at $27.08 billion compared to analysts’ forecasts of $28 billion.
Treasuries finished higher as the spread between the two and 10-year yields continued to widen, reaching a four-decade extreme this week. The yield on the benchmark 10-year note shed eleven basis points (0.11%) to 3.41%, while the yield on the 30-year bond declined eleven basis points (0.11%) to 3.42% reaching its lowest level since September. The yield on the two-year note, which is more sensitive to changes in Fed policy, fell ten basis points (0.10%) to 4.25%. In commodities, West Texas Intermediate (WTI) crude dropped 2.5% to $72.40/barrel, hitting its lowest level since January, after the U.S. Energy Information Administration (EIA) announced crude inventories declined 5.2 million barrels for the week ended December 2. The U.S. Dollar index weakened 0.4% against a basket of major currencies as economic concerns grow.
|
 Kenneth J. Gruneisen started out as a licensed stockbroker in August 1987, a couple of months prior to the historic stock market crash that took the Dow Jones Industrial Average down -22.6% in a single day. He has published daily fact-based fundamental and technical analysis on high-ranked stocks online for two decades. Through FACTBASEDINVESTING.COM, Kenneth provides educational articles, news, market commentary, and other information regarding proven investment systems that work in good times and bad.
Comments contained in the body of this report are technical opinions only and are not necessarily those of Gruneisen Growth Corp. The material herein has been obtained from sources believed to be reliable and accurate, however, its accuracy and completeness cannot be guaranteed. Our firm, employees, and customers may effect transactions, including transactions contrary to any recommendation herein, or have positions in the securities mentioned herein or options with respect thereto. Any recommendation contained in this report may not be suitable for all investors and it is not to be deemed an offer or solicitation on our part with respect to the purchase or sale of any securities. |
|
 |
Gold & Silver, Biotech, and Retail Indexes Rose
Kenneth J. Gruneisen - Passed the CAN SLIM® Master's Exam
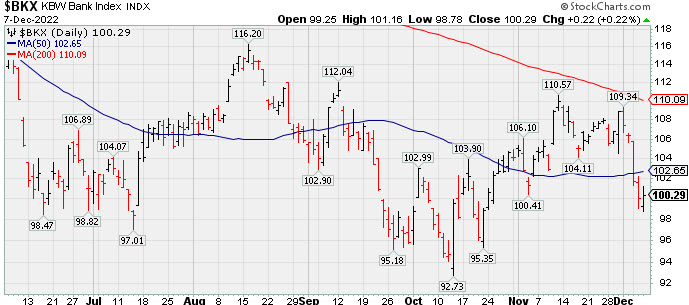
The Retail Index ($RLX +0.39%) and Bank Index ($BKX +0.22%) both edged higher but the Broker/Dealer Index ($XBD -1.08%) lost ground. Commodity-linked groups were mixed as the Gold & Silver Index ($XAU +1.80%) rose while the Oil Services Index ($OSX -2.27%) and Integrated Oil Index ($XOI -0.41%) both lost ground. The Biotech Index ($BTK +0.50%) posted a modest gain while the Semiconductor Index ($SOX -0.01%) finished flat and the Networking Index ($NWX -1.34%) slumped.
PICTURED: The Bank Index ($BKX +0.22%) recently slumped back below its 50-day moving average (DMA) line after meeting resistance near its 200 DMA line.
| Oil Services |
$OSX |
77.99 |
-1.81 |
-2.27% |
+47.94% |
| Integrated Oil |
$XOI |
1,732.66 |
-7.05 |
-0.41% |
+47.06% |
| Semiconductor |
$SOX |
2,673.25 |
-0.28 |
-0.01% |
-32.26% |
| Networking |
$NWX |
793.05 |
-10.78 |
-1.34% |
-18.33% |
| Broker/Dealer |
$XBD |
467.33 |
-5.09 |
-1.08% |
-4.01% |
| Retail |
$RLX |
2,840.94 |
+11.15 |
+0.39% |
-32.78% |
| Gold & Silver |
$XAU |
121.56 |
+2.15 |
+1.80% |
-8.22% |
| Bank |
$BKX |
100.29 |
+0.22 |
+0.22% |
-24.15% |
| Biotech |
$BTK |
5,259.66 |
+26.42 |
+0.50% |
-4.69% |
|
|
|
 |
No Meaningful Progress After Breakout 3 Weeks Ago
Kenneth J. Gruneisen - Passed the CAN SLIM® Master's Exam
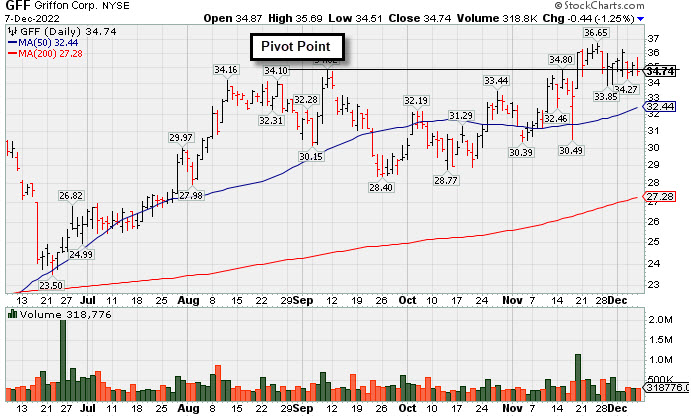
Griffon Corporation (GFF -$0.44 or -1.25% to $34.74) is consolidating near prior highs in the $34 area and well above its 50-day moving average (DMA) line ($32.51). It showed bullish action but made no meaningful price progress in recent weeks since reporting Sep '22 quarterly earnings +230% on +24% sales revenues versus the year ago period.
Fundamentals remain strong. It has a 99 Earnings Per Share Rating. Annual earnings (A criteria) growth has been strong and steady. GFF was highlighted in yellow with new pivot point cited based on its 9/09/22 high plus 10 cents in the 11/11/22 mid-day report (read here) and shown in greater detail that evening with an annotated graph under the headline, "Griffon Perched Near 52-Week High After 9-Week Base".
The company has only 57.1 million shares outstanding (S criteria) which can contribute to greater volatility in the event of institutional buying or selling. The number of top-dated funds owning its shares rose from 331 in Mar '22 to 366 in Sep '22. Its current Up/Down Volume Ratio of 1.6 is an unbiased indication its shares have been under accumulation over the past 50 days. It has an A Timeliness rating and a B Sponsorship Rating.
|
|
|
Color Codes Explained :
Y - Better candidates highlighted by our
staff of experts.
G - Previously featured
in past reports as yellow but may no longer be buyable under the
guidelines.
***Last / Change / Volume data in this table is the closing quote data***
Symbol/Exchange
Company Name
Industry Group |
PRICE |
CHANGE
(%Change) |
Day High |
Volume
(% DAV)
(% 50 day avg vol) |
52 Wk Hi
% From Hi |
Featured
Date |
Price
Featured |
Pivot Featured |
|
Max Buy |
 ESQ
-
NASDAQ
ESQ
-
NASDAQ
Esquire Financial Hldgs
Finance-Commercial Loans
|
$42.79
|
-0.10
-0.23% |
$43.39
|
12,813
45.76% of 50 DAV
50 DAV is 28,000
|
$48.13
-11.09%
|
10/18/2022
|
$40.02
|
PP = $39.95
|
|
MB = $41.95
|
 Most Recent Note - 12/7/2022 3:23:46 PM
G - Pulling back today with below average volume for a 9th loss in the span of 10 sessions. Prior highs and its 50 DMA line ($42.10) coincide in the $41 area defining important near-term support to watch.
>>> FEATURED STOCK ARTICLE : Pulled Back Following "Negative Reversal" at All-Time High - 11/25/2022 |
View all notes |
Set NEW NOTE alert |
Company Profile |
SEC
News |
Chart |
Request a new note
C
A
S
I |
CCRN
-
NASDAQ
Cross Country Healthcare
DIVERSIFIED SERVICES - Staffing and Outsourcing Service
|
$32.34
|
-1.18
-3.52% |
$33.52
|
833,195
102.74% of 50 DAV
50 DAV is 811,000
|
$40.12
-19.39%
|
9/9/2022
|
$27.32
|
PP = $30.61
|
|
MB = $32.14
|
Most Recent Note - 12/6/2022 5:31:09 PM
G - Suffered a 2nd consecutive loss with below average volume today, but slumped and closed below its 50 DMA line ($33.81) raising concerns. More damaging losses may trigger a worrisome technical sell signal. It recently reported Sep '22 quarterly earnings +75% on +70% sales revenues versus the year ago period.
>>> FEATURED STOCK ARTICLE : Big Loss Testing Support at 50-Day Moving Average - 12/5/2022 |
View all notes |
Set NEW NOTE alert |
Company Profile |
SEC
News |
Chart |
Request a new note
C
A
S
I |
CMC
-
NYSE
Commercial Metals Co
METALS and MINING - Steel and Iron
|
$49.27
|
-0.47
-0.94% |
$50.83
|
1,172,978
118.60% of 50 DAV
50 DAV is 989,000
|
$49.80
-1.06%
|
10/14/2022
|
$41.61
|
PP = $44.45
|
|
MB = $46.67
|
Most Recent Note - 12/7/2022 3:21:46 PM
G - Reversed into the red after hitting yet another new high with today's early gain. It posted 9 consecutive weekly gains. Fundamentals remain strong. Prior high in the $44 area defines initial support to watch above its 50 DMA line ($44.40).
>>> FEATURED STOCK ARTICLE : Wedging Higher With Recent Gains Lacking Great Volume - 12/2/2022 |
View all notes |
Set NEW NOTE alert |
Company Profile |
SEC
News |
Chart |
Request a new note
C
A
S
I |
VRTX
-
NASDAQ
Vertex Pharmaceuticals
Medical-Biomed/Biotech
|
$317.58
|
+5.77
1.85% |
$317.71
|
843,047
55.98% of 50 DAV
50 DAV is 1,506,000
|
$323.61
-1.86%
|
10/24/2022
|
$308.47
|
PP = $306.05
|
|
MB = $321.35
|
Most Recent Note - 12/5/2022 5:26:46 PM
Y - Pulled back today with light volume breaking a streak of 5 consecutive gains. Its 50 DMA line ($304.35) defines near-term support above recent intra-day lows in the $287-288 area. Recently reported Sep '22 quarterly earnings +14% on +18% sales revenues versus the year ago period, below the +25% minimum earnings guideline raising fundamental concerns (C criteria). Annual earnings (A criteria) history has been strong.
>>> FEATURED STOCK ARTICLE : Made Little Progress Following Breakout and Latest Earnings News - 11/16/2022 |
View all notes |
Set NEW NOTE alert |
Company Profile |
SEC
News |
Chart |
Request a new note
C
A
S
I |
GPK
-
NYSE
Graphic Packaging Hldg
CONSUMER NON-DURABLES - Packaging and Containers
|
$22.61
|
-0.15
-0.66% |
$22.94
|
1,838,807
64.11% of 50 DAV
50 DAV is 2,868,000
|
$24.07
-6.07%
|
10/25/2022
|
$22.75
|
PP = $24.17
|
|
MB = $25.38
|
Most Recent Note - 12/6/2022 5:36:47 PM
Y - Volume totals have been cooling while still consolidating above its 50 DMA line ($21.80), perched within striking distance of its 52-week high and pivot point. More damaging losses would raise concerns and trigger a technical sell signal. Subsequent gains above the pivot point backed by at least +40% above average volume may trigger a technical buy signal. Fundamentals remain strong.
>>> FEATURED STOCK ARTICLE : Consolidating Above 50-Day Moving Average Still Perched Near High - 11/17/2022 |
View all notes |
Set NEW NOTE alert |
Company Profile |
SEC
News |
Chart |
Request a new note
C
A
S
I |
Symbol/Exchange
Company Name
Industry Group |
PRICE |
CHANGE
(%Change) |
Day High |
Volume
(% DAV)
(% 50 day avg vol) |
52 Wk Hi
% From Hi |
Featured
Date |
Price
Featured |
Pivot Featured |
|
Max Buy |
CBZ
-
NYSE
C B I Z Inc
Comml Svcs-Consulting
|
$48.67
|
-0.05
-0.10% |
$49.38
|
187,285
71.76% of 50 DAV
50 DAV is 261,000
|
$50.57
-3.76%
|
10/26/2022
|
$47.83
|
PP = $48.57
|
|
MB = $51.00
|
Most Recent Note - 12/7/2022 3:19:32 PM
Y - Pulling back for a 3rd consecutive small loss with below average volume, hovering near its 52-week high. Its 50 DMA line ($47.07) and recent low define important near-term support. Recently reported Sep '22 quarterly earnings +24% on +28% sales revenues versus the year ago period.
>>> FEATURED STOCK ARTICLE : Gapped Up and Rebounded Above Pivot Point - 11/18/2022 |
View all notes |
Set NEW NOTE alert |
Company Profile |
SEC
News |
Chart |
Request a new note
C
A
S
I |
ENPH
-
NASDAQ
Enphase Energy Inc
Energy-Solar
|
$317.05
|
+7.32
2.36% |
$317.44
|
3,771,871
94.49% of 50 DAV
50 DAV is 3,992,000
|
$339.92
-6.73%
|
10/26/2022
|
$301.55
|
PP = $324.94
|
|
MB = $341.19
|
Most Recent Note - 12/7/2022 12:03:40 PM
Y - Holding its ground today after a slump back below its pivot point with a volume-driven loss on the prior session raised concerns. Stalled after hitting a new all-time high on 12/02/22 with a volume-driven gain above its pivot point. Faces no resistance due to overhead supply. Its 50 DMA line ($287) defines near-term support above the recent low ($262.60 on 11/07/22). Fundamentals remain strong.
>>> FEATURED STOCK ARTICLE : Perched Near High Still Awaiting Technical Breakout - 11/21/2022 |
View all notes |
Set NEW NOTE alert |
Company Profile |
SEC
News |
Chart |
Request a new note
C
A
S
I |
HRMY
-
NASDAQ
Harmony Biosciences Holdings
Medical-Biomed/Biotech
|
$60.02
|
+0.37
0.62% |
$60.59
|
463,573
96.42% of 50 DAV
50 DAV is 480,800
|
$62.09
-3.33%
|
11/1/2022
|
$55.31
|
PP = $57.23
|
|
MB = $60.09
|
Most Recent Note - 12/5/2022 1:06:57 PM
G - Color code is changed to green while hitting a new all-time high and trading near its "max buy" level with today's 4th consecutive small gain marked by near average volume. The 11/17/22 low ($53.06) defines important support to watch coinciding with its 50 DMA line ($53).
>>> FEATURED STOCK ARTICLE : Harmony Still Hovering Near All-Time High - 11/28/2022 |
View all notes |
Set NEW NOTE alert |
Company Profile |
SEC
News |
Chart |
Request a new note
C
A
S
I |
CLH
-
NYSE
Clean Harbors Inc
Pollution Control
|
$118.77
|
+1.64
1.40% |
$119.81
|
254,954
60.27% of 50 DAV
50 DAV is 423,000
|
$125.41
-5.29%
|
11/2/2022
|
$121.59
|
PP = $124.59
|
|
MB = $130.82
|
Most Recent Note - 12/5/2022 5:20:54 PM
Y - Abruptly reversed from its new all-time high with today's big loss backed by below average volume as it slumped back below the pivot point cited. Its 50 DMA line ($116.40) and recent low ($114.86 on 11/29/22) define important near-term support to watch. Fundamentals remain strong.
>>> FEATURED STOCK ARTICLE : Volume-Driven Losses Undercut 50-Day Moving Average - 11/29/2022 |
View all notes |
Set NEW NOTE alert |
Company Profile |
SEC
News |
Chart |
Request a new note
C
A
S
I |
NPO
-
NYSE
Enpro Industries Inc
Machinery-Gen Industrial
|
$112.35
|
-2.89
-2.51% |
$115.69
|
89,996
90.91% of 50 DAV
50 DAV is 99,000
|
$127.67
-12.00%
|
11/4/2022
|
$119.06
|
PP = $117.73
|
|
MB = $123.62
|
Most Recent Note - 12/5/2022 5:24:41 PM
Y - Pulled back today with higher (near average) volume, sputtering back below its pivot point raising concerns. Fundamentals remain strong.
>>> FEATURED STOCK ARTICLE : Consolidating Near Old Highs Following Recent Breakout - 12/1/2022 |
View all notes |
Set NEW NOTE alert |
Company Profile |
SEC
News |
Chart |
Request a new note
C
A
S
I |
Symbol/Exchange
Company Name
Industry Group |
PRICE |
CHANGE
(%Change) |
Day High |
Volume
(% DAV)
(% 50 day avg vol) |
52 Wk Hi
% From Hi |
Featured
Date |
Price
Featured |
Pivot Featured |
|
Max Buy |
DGII
-
NASDAQ
Digi International Inc
COMPUTER HARDWARE - Networking and Communication Dev
|
$39.13
|
-1.03
-2.56% |
$40.23
|
322,096
80.73% of 50 DAV
50 DAV is 399,000
|
$43.68
-10.42%
|
11/10/2022
|
$41.82
|
PP = $40.96
|
|
MB = $43.01
|
Most Recent Note - 12/7/2022 3:28:26 PM
Y - Pulling back today with below average volume for a 5th consecutive loss. Sinking below the pivot point cited based on its 10/31/22 high plus 10 cents after forming an advanced "ascending base" pattern. Its 50 DMA line ($38.37) defines important near-term support to watch. Fundamentals remain strong. See the latest FSU analysis for more details and an annotated graph.
>>> FEATURED STOCK ARTICLE : Sputtering After Recently Wedging to New Highs - 12/6/2022 |
View all notes |
Set NEW NOTE alert |
Company Profile |
SEC
News |
Chart |
Request a new note
C
A
S
I |
GFF
-
NYSE
Griffon Corporation
MATERIALS and CONSTRUCTION - General Building Materials
|
$34.74
|
-0.44
-1.25% |
$35.69
|
318,776
87.34% of 50 DAV
50 DAV is 365,000
|
$36.75
-5.47%
|
11/10/2022
|
$34.13
|
PP = $35.02
|
|
MB = $36.77
|
Most Recent Note - 12/7/2022 5:28:36 PM
Y - Perched near its 52-week high, consolidating near prior highs in the $34 area which define initial support to watch above its 50 DMA line ($32.51). Reported Sep '22 quarterly earnings +230% on +24% sales revenues versus the year ago period. See the latest FSU analysis for more details and a new annotated graph.
>>> FEATURED STOCK ARTICLE : No Meaningful Progress After Breakout 3 Weeks Ago - 12/7/2022 |
View all notes |
Set NEW NOTE alert |
Company Profile |
SEC
News |
Chart |
Request a new note
C
A
S
I |
ANET
-
NYSE
Arista Networks Inc
Computer-Networking
|
$126.76
|
-2.28
-1.77% |
$128.76
|
2,808,737
119.93% of 50 DAV
50 DAV is 2,342,000
|
$148.57
-14.68%
|
11/14/2022
|
$132.05
|
PP = $133.70
|
|
MB = $140.39
|
Most Recent Note - 12/6/2022 5:28:41 PM
Y - Pulled back today with near average volume for a 3rd consecutive loss after recently wedging higher. Subsequent gains and a close above the pivot point must be backed by at least +40% above average volume to trigger a proper technical buy signal. Faces some resistance due to overhead supply up to the $148 level. Fundamentals are strong.
>>> FEATURED STOCK ARTICLE : Finished in Middle of Intra-Day Range After Challenging Pivot Point - 11/14/2022 |
View all notes |
Set NEW NOTE alert |
Company Profile |
SEC
News |
Chart |
Request a new note
C
A
S
I |
CPRX
-
NASDAQ
Catalyst Pharma Inc
Medical-Biomed/Biotech
|
$16.82
|
+0.36
2.19% |
$16.91
|
1,533,851
66.78% of 50 DAV
50 DAV is 2,297,000
|
$18.39
-8.54%
|
11/22/2022
|
$17.38
|
PP = $16.66
|
|
MB = $17.49
|
Most Recent Note - 12/6/2022 5:35:23 PM
Y - Pulled back today for a 2nd consecutive loss with near average volume, but slumped below its pivot point raising some concerns. Still consolidating well above its 50 DMA line ($14.37).
>>> FEATURED STOCK ARTICLE : Breakout From Cup-With-Handle With 90% Above Average Volume - 11/22/2022 |
View all notes |
Set NEW NOTE alert |
Company Profile |
SEC
News |
Chart |
Request a new note
C
A
S
I |
CLFD
-
NASDAQ
Clearfield Inc
TELECOMMUNICATIONS - Cables / Satalite Equipment
|
$103.51
|
-6.86
-6.22% |
$105.55
|
1,050,164
355.99% of 50 DAV
50 DAV is 295,000
|
$134.90
-23.27%
|
11/23/2022
|
$131.27
|
PP = $130.11
|
|
MB = $136.62
|
Most Recent Note - 12/7/2022 3:03:58 PM
G - Gapped down today violating its 50 DMA line ($107) after pricing an upsized Secondary Offering. Prior losses were noted as action indicative of more damaging distributional pressure soon after triggering a new technical buy signal. Members were reminded - "Disciplined investors always limit losses by selling any stock that falls more than 7-8% from their purchase price."
>>> FEATURED STOCK ARTICLE : Hit New High But Encountered Distributional Pressure - 11/23/2022 |
View all notes |
Set NEW NOTE alert |
Company Profile |
SEC
News |
Chart |
Request a new note
C
A
S
I |
Symbol/Exchange
Company Name
Industry Group |
PRICE |
CHANGE
(%Change) |
Day High |
Volume
(% DAV)
(% 50 day avg vol) |
52 Wk Hi
% From Hi |
Featured
Date |
Price
Featured |
Pivot Featured |
|
Max Buy |
TITN
-
NASDAQ
Titan Machinery Inc
SPECIALTY RETAIL
|
$39.96
|
+0.66
1.68% |
$40.52
|
302,817
161.93% of 50 DAV
50 DAV is 187,000
|
$44.35
-9.90%
|
11/30/2022
|
$40.10
|
PP = $38.68
|
|
MB = $40.61
|
Most Recent Note - 12/7/2022 12:13:47 PM
Y - Prior high in the $38 area defines initial support to watch. Pulling back below its "max buy" level and its color code was changed to yellow. On track for a 5th consecutive loss with above average volume after a technical breakout noted on 11/30/22. Fundamentals remain strong after reporting Oct '22 quarterly earnings +91% on +47% sales revenues.
>>> FEATURED STOCK ARTICLE : Gap Up and Big Volume-Driven Breakout Gain - 11/30/2022 |
View all notes |
Set NEW NOTE alert |
Company Profile |
SEC
News |
Chart |
Request a new note
C
A
S
I |
|
|
|
THESE ARE NOT BUY RECOMMENDATIONS!
Comments contained in the body of this report are technical
opinions only. The material herein has been obtained
from sources believed to be reliable and accurate, however,
its accuracy and completeness cannot be guaranteed.
This site is not an investment advisor, hence it does
not endorse or recommend any securities or other investments.
Any recommendation contained in this report may not
be suitable for all investors and it is not to be deemed
an offer or solicitation on our part with respect to
the purchase or sale of any securities. All trademarks,
service marks and trade names appearing in this report
are the property of their respective owners, and are
likewise used for identification purposes only.
This report is a service available
only to active Paid Premium Members.
You may opt-out of receiving report notifications
at any time. Questions or comments may be submitted
by writing to Premium Membership Services 665 S.E. 10 Street, Suite 201 Deerfield Beach, FL 33441-5634 or by calling 1-800-965-8307
or 954-785-1121.
|
|
|