You are not logged in.
This means you
CAN ONLY VIEW reports that were published prior to Monday, March 24, 2025.
You
MUST UPGRADE YOUR MEMBERSHIP if you want to see any current reports.
AFTER MARKET UPDATE - WEDNESDAY, NOVEMBER 23RD, 2022
Previous After Market Report Next After Market Report >>>
|
|
|
|
DOW |
+95.96 |
34,194.06 |
+0.28% |
|
Volume |
656,123,064 |
-21% |
|
Volume |
4,391,728,700 |
+6% |
|
NASDAQ |
+110.91 |
11,285.32 |
+0.99% |
|
Advancers |
1,841 |
61% |
|
Advancers |
2,837 |
62% |
|
S&P 500 |
+23.68 |
4,027.26 |
+0.59% |
|
Decliners |
1,174 |
39% |
|
Decliners |
1,704 |
38% |
|
Russell 2000 |
+3.08 |
1,863.52 |
+0.17% |
|
52 Wk Highs |
78 |
|
|
52 Wk Highs |
119 |
|
|
S&P 600 |
+1.44 |
1,229.90 |
+0.12% |
|
52 Wk Lows |
47 |
|
|
52 Wk Lows |
170 |
|
|
 |
Major Averages Quietly Continued to Rally
Kenneth J. Gruneisen - Passed the CAN SLIM® Master's Exam
The Dow added 95 points, while the Nasdaq Composite climbed 1%. The S&P 500 advanced 0.6%. The volume totals reported were mixed, lighter than the prior session on the NYSE and higher on the Nasdaq exchange. Breadth was positive as advancers led decliners by a 3-2 margin on the NYSE and on the Nasdaq exchange. There were 45 high-ranked companies from the Leaders List that hit new 52-week highs and were listed on the BreakOuts Page, up from the total of 39 on the prior session. New 52-week highs outnumbered new 52-week lows on the NYSE but new lows still outnumbered new highs on the Nasdaq exchange. The market is in a confirmed uptrend (M criteria). Healthy leadership (new 52-week highs totals) has continued to help the rally be productive. Only stocks meeting all key-criteria of the fact-based investment system should be considered as buy candidates.
Chart courtesy of www.stockcharts.com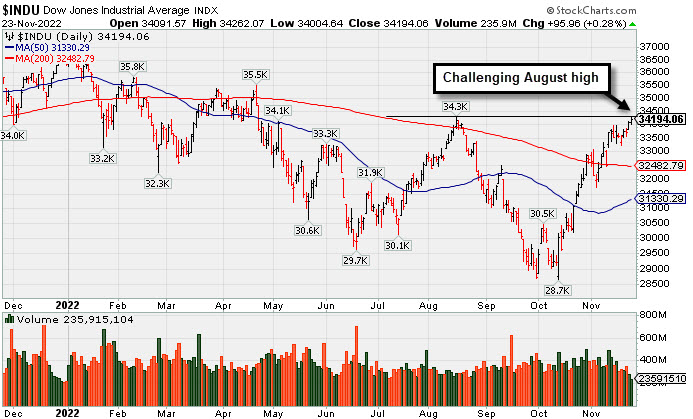 PICTURED: The Dow Jones Industrial Average is well above its 50-day and 200-day moving average (DMA) lines, challenging its August high. Of the 3 major indices only the Dow is in "healthy shape" above its 200 DMA line.
U.S. equities finished higher Wednesday as investors digested the release of the Federal Reserve’s (Fed’s) November meeting minutes. The minutes detailed the central bank’s plan to slow rate hikes to 0.5% in December after approving a fourth consecutive 0.75% increase earlier this month. Many officials suggested a “slowing in the pace of increases would soon be appropriate”. Ten of the 11 sectors in the S&P 500 finished in positive territory, with Consumer Discretionary and Communication Services pacing gains.
On the data front, initial jobless claims for the week ended November 19 came in at 240,000, up from the prior week’s print. October’s preliminary durable goods orders climbed 1%, beating estimates of 0.4%. Preliminary numbers for November’s S&P Global Manufacturing Purchasing Managers’ Index (PMI), Services PMI, and Composite PMI came in weaker-than-expected at 47.6, 46.1, and 46.3 respectively. The University of Michigan’s November consumer sentiment came in stronger than expected at 56.8 versus the estimated 55 points. Meanwhile, the one-year inflation survey increased to 4.9% and long-term inflation remained unchanged at 3%.
Treasuries rallied, with the yield on the benchmark 10-year note falling seven basis points (0.07%) to 3.69%, while the 30-year bond yield shed eleven basis points (0.11%) to 3.72%. The yield on the two-year note dipped five basis points (0.05%) to 4.48%. In commodities, West Texas Intermediate (WTI) crude declined 4.3% to $77.44/barrel as the Group of Seven (G7) nations debated where to cap prices on Russian oil, estimated to be between $65 - $70/barrel.
|
 Kenneth J. Gruneisen started out as a licensed stockbroker in August 1987, a couple of months prior to the historic stock market crash that took the Dow Jones Industrial Average down -22.6% in a single day. He has published daily fact-based fundamental and technical analysis on high-ranked stocks online for two decades. Through FACTBASEDINVESTING.COM, Kenneth provides educational articles, news, market commentary, and other information regarding proven investment systems that work in good times and bad.
Comments contained in the body of this report are technical opinions only and are not necessarily those of Gruneisen Growth Corp. The material herein has been obtained from sources believed to be reliable and accurate, however, its accuracy and completeness cannot be guaranteed. Our firm, employees, and customers may effect transactions, including transactions contrary to any recommendation herein, or have positions in the securities mentioned herein or options with respect thereto. Any recommendation contained in this report may not be suitable for all investors and it is not to be deemed an offer or solicitation on our part with respect to the purchase or sale of any securities. |
|
 |
Tech, Financial, Retail, and Gold & Silver Indexes Rose
Kenneth J. Gruneisen - Passed the CAN SLIM® Master's Exam
The Retail Index ($RLX +0.30%), Bank Index ($BKX +0.32%), and Broker/Dealer Index ($XBD +0.25%) each edged higher on Wednesday. The Semiconductor Index ($SOX +1.07%) led the tech sector while the Networking Index ($NWX +0.31%) edged higher and the Biotech Index ($BTK +0.05%) finished flat. Commodity-linked groups were mixed as the Gold & Silver Index ($XAU +1.14%) rose while the Oil Services Index ($OSX -2.55%) and Integrated Oil Index ($XOI -1.14%) both lost ground.
PICTURED: The Bank Index ($BKX +0.32%) has been consolidating above its 50-day moving average (DMA) line, but it remains below its 200 DMA line and well below its August high.
| Oil Services |
$OSX |
83.58 |
-2.19 |
-2.55% |
+58.53% |
| Integrated Oil |
$XOI |
1,893.49 |
-21.76 |
-1.14% |
+60.71% |
| Semiconductor |
$SOX |
2,786.42 |
+29.60 |
+1.07% |
-29.39% |
| Networking |
$NWX |
820.43 |
+2.54 |
+0.31% |
-15.51% |
| Broker/Dealer |
$XBD |
474.86 |
+1.20 |
+0.25% |
-2.46% |
| Retail |
$RLX |
2,943.77 |
+8.70 |
+0.30% |
-30.35% |
| Gold & Silver |
$XAU |
119.52 |
+1.34 |
+1.14% |
-9.77% |
| Bank |
$BKX |
107.60 |
+0.34 |
+0.32% |
-18.62% |
| Biotech |
$BTK |
5,202.64 |
+2.65 |
+0.05% |
-5.72% |
|
|
|
 |
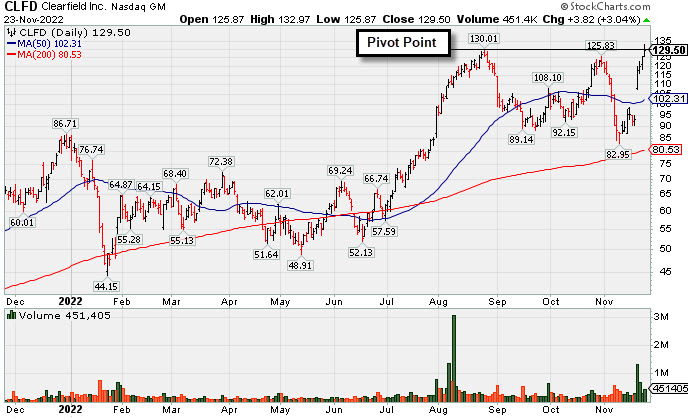
Hit New High But Encountered Distributional Pressure
Kenneth J. Gruneisen - Passed the CAN SLIM® Master's Exam
Clearfield Inc (CLFD +$3.82 or +3.04% to $129.50) was highlighted again in yellow with pivot point cited based on its 8/25/22 high plus 10 cents in the earlier mid-day report (read here). It hit a new all-time high with today's 5th consecutive gain backed by +62% above average volume, however it encountered some distributional pressure, ending near the middle of the intra-day range and below the pivot point. Subsequent gains and close above the pivot point backed by at least +40% above average volume may trigger a new technical buy signal. It gapped up on 11/18/22 for a considerable gain, rebounding from below its 50-day moving average (DMA) line ($102). Since last shown in this FSU section on 10/27/22 with an annotated graph under the headline "Clearfield Perched -8.6% Off High After Recent Rebound", it slumped but found support above its 200 DMA line and showed resilience.
CLFD reported Sep '22 quarterly earnings +130% on +110% sales revenues versus the year ago period. It has the highest possible Earnings Per Share Rating of 99. Fundamentals have been strong. It reported Jun '22 quarterly earnings +109% on +84% sales revenues above the year ago period. Annual earnings (A criteria) growth has been strong after a downturn in FY '17.
The TELECOMMUNICATIONS - Fiber Optics group is currently ranked 31st on the 197 Industry Groups list (L criteria). There are only 13.8 million shares outstanding (S criteria) which can contribute to greater price volatility in the event of institutional buying or selling. The number of top-rated funds owning its shares rose from 132 in Jun '20 to 315 in Sep '22, a reassuring sign concerning the I criteria. Its current Up/Down Volume Ratio of 1.4 is an unbiased indication its shares have been under accumulation over the past 50 days. Its Accumulation/Distribution Rating is B+, Timeliness Rating is A, and its Sponsorship Rating is B.
|
|
|
Color Codes Explained :
Y - Better candidates highlighted by our
staff of experts.
G - Previously featured
in past reports as yellow but may no longer be buyable under the
guidelines.
***Last / Change / Volume data in this table is the closing quote data***
Symbol/Exchange
Company Name
Industry Group |
PRICE |
CHANGE
(%Change) |
Day High |
Volume
(% DAV)
(% 50 day avg vol) |
52 Wk Hi
% From Hi |
Featured
Date |
Price
Featured |
Pivot Featured |
|
Max Buy |
 ESQ
-
NASDAQ
ESQ
-
NASDAQ
Esquire Financial Hldgs
Finance-Commercial Loans
|
$45.90
|
-0.30
-0.65% |
$48.05
|
46,660
160.90% of 50 DAV
50 DAV is 29,000
|
$48.13
-4.63%
|
10/18/2022
|
$40.02
|
PP = $39.95
|
|
MB = $41.95
|
 Most Recent Note - 11/23/2022 5:46:30 PM
G - Challenged its high today but there was a "negative reversal" and it closed near the session low with a small loss on above average volume. Prior highs and its 50 DMA line coincide in the $41 area defining important near-term support to watch on pullbacks.
>>> FEATURED STOCK ARTICLE : New High With 6th Consecutive Volume-Driven Gain - 10/31/2022 |
View all notes |
Set NEW NOTE alert |
Company Profile |
SEC
News |
Chart |
Request a new note
C
A
S
I |
CCRN
-
NASDAQ
Cross Country Healthcare
DIVERSIFIED SERVICES - Staffing and Outsourcing Service
|
$35.21
|
-0.78
-2.17% |
$36.39
|
382,653
42.42% of 50 DAV
50 DAV is 902,000
|
$40.12
-12.24%
|
9/9/2022
|
$27.32
|
PP = $30.61
|
|
MB = $32.14
|
Most Recent Note - 11/22/2022 6:18:52 PM
Y - Posted a gain today, consolidating above its 50 DMA line ($32.62). Reported Sep '22 quarterly earnings +75% on +70% sales revenues versus the year ago period.
>>> FEATURED STOCK ARTICLE : Consolidating Above Prior Highs and Above 50-Day Moving Average - 11/8/2022 |
View all notes |
Set NEW NOTE alert |
Company Profile |
SEC
News |
Chart |
Request a new note
C
A
S
I |
CMC
-
NYSE
Commercial Metals Co
METALS and MINING - Steel and Iron
|
$48.08
|
-0.50
-1.03% |
$48.30
|
441,236
41.12% of 50 DAV
50 DAV is 1,073,000
|
$49.41
-2.69%
|
10/14/2022
|
$41.61
|
PP = $44.45
|
|
MB = $46.67
|
Most Recent Note - 11/22/2022 6:13:29 PM
G - Posted a gain today with below average for a best-ever close. Fundamentals remain strong. Prior high in the $44 area defines initial support to watch on pullbacks.
>>> FEATURED STOCK ARTICLE : Steel/Metal Products Firm Quietly Perched Near All Time High - 11/7/2022 |
View all notes |
Set NEW NOTE alert |
Company Profile |
SEC
News |
Chart |
Request a new note
C
A
S
I |
VRTX
-
NASDAQ
Vertex Pharmaceuticals
Medical-Biomed/Biotech
|
$316.16
|
-5.32
-1.65% |
$323.61
|
1,040,790
71.43% of 50 DAV
50 DAV is 1,457,000
|
$322.26
-1.89%
|
10/24/2022
|
$308.47
|
PP = $306.05
|
|
MB = $321.35
|
Most Recent Note - 11/18/2022 4:23:00 PM
Y - Posted a 3rd consecutive gain today with light volume yet managed a best-ever close. Its 50 DMA line ($298) defines near-term support above recent intra-day lows in the $287-288 area. Recently reported Sep '22 quarterly earnings +14% on +18% sales revenues versus the year ago period, below the +25% minimum earnings guideline raising fundamental concerns (C criteria). Annual earnings (A criteria) history has been strong.
>>> FEATURED STOCK ARTICLE : Made Little Progress Following Breakout and Latest Earnings News - 11/16/2022 |
View all notes |
Set NEW NOTE alert |
Company Profile |
SEC
News |
Chart |
Request a new note
C
A
S
I |
GPK
-
NYSE
Graphic Packaging Hldg
CONSUMER NON-DURABLES - Packaging and Containers
|
$22.58
|
+0.02
0.09% |
$22.70
|
1,832,680
61.58% of 50 DAV
50 DAV is 2,976,000
|
$24.07
-6.19%
|
10/25/2022
|
$22.75
|
PP = $24.17
|
|
MB = $25.38
|
Most Recent Note - 11/23/2022 5:44:25 PM
Y - Posted a quiet gain today. Volume totals are cooling while consolidating above its 50 DMA line ($21.54). More damaging losses would raise concerns and trigger a technical sell signal. Subsequent gains above the pivot point backed by at least +40% above average volume may trigger a technical buy signal. Fundamentals remain strong.
>>> FEATURED STOCK ARTICLE : Consolidating Above 50-Day Moving Average Still Perched Near High - 11/17/2022 |
View all notes |
Set NEW NOTE alert |
Company Profile |
SEC
News |
Chart |
Request a new note
C
A
S
I |
Symbol/Exchange
Company Name
Industry Group |
PRICE |
CHANGE
(%Change) |
Day High |
Volume
(% DAV)
(% 50 day avg vol) |
52 Wk Hi
% From Hi |
Featured
Date |
Price
Featured |
Pivot Featured |
|
Max Buy |
CBZ
-
NYSE
C B I Z Inc
Comml Svcs-Consulting
|
$49.31
|
-0.31
-0.62% |
$49.88
|
103,836
37.35% of 50 DAV
50 DAV is 278,000
|
$50.57
-2.49%
|
10/26/2022
|
$47.83
|
PP = $48.57
|
|
MB = $51.00
|
Most Recent Note - 11/18/2022 4:21:08 PM
Y - Gapped up today for a small gain with light volume yet rebounded above its pivot point. Its 50 DMA line ($45.85) and recent low define important near-term support. Recently reported Sep '22 quarterly earnings +24% on +28% sales revenues versus the year ago period.
>>> FEATURED STOCK ARTICLE : Gapped Up and Rebounded Above Pivot Point - 11/18/2022 |
View all notes |
Set NEW NOTE alert |
Company Profile |
SEC
News |
Chart |
Request a new note
C
A
S
I |
ENPH
-
NASDAQ
Enphase Energy Inc
Energy-Solar
|
$315.78
|
-4.66
-1.45% |
$324.46
|
2,634,988
64.16% of 50 DAV
50 DAV is 4,107,000
|
$324.84
-2.79%
|
10/26/2022
|
$301.55
|
PP = $324.94
|
|
MB = $341.19
|
Most Recent Note - 11/22/2022 6:22:53 PM
Y - Posted a big gain today with below average volume and closed at the session high, perched within close striking distance of its pivot point. Faces no resistance due to overhead supply. Its 50 DMA line ($283) defines near-term support above the recent low ($262.60 on 11/07/22). Fundamentals remain strong.
>>> FEATURED STOCK ARTICLE : Perched Near High Still Awaiting Technical Breakout - 11/21/2022 |
View all notes |
Set NEW NOTE alert |
Company Profile |
SEC
News |
Chart |
Request a new note
C
A
S
I |
HRMY
-
NASDAQ
Harmony Biosciences Holdings
Medical-Biomed/Biotech
|
$57.50
|
-0.45
-0.78% |
$59.10
|
250,962
47.49% of 50 DAV
50 DAV is 528,400
|
$61.55
-6.58%
|
11/1/2022
|
$55.31
|
PP = $57.23
|
|
MB = $60.09
|
Most Recent Note - 11/18/2022 12:59:28 PM
Y - Managed a "positive reversal" on the prior session after early weakness. Recently testing near prior highs in the $57 area that define initial support to watch above its 50 DMA line ($50.10).
>>> FEATURED STOCK ARTICLE : Volume Heavy Behind Technical Breakout After Earnings - 11/1/2022 |
View all notes |
Set NEW NOTE alert |
Company Profile |
SEC
News |
Chart |
Request a new note
C
A
S
I |
CLH
-
NYSE
Clean Harbors Inc
Pollution Control
|
$122.62
|
+1.90
1.57% |
$122.78
|
225,363
50.19% of 50 DAV
50 DAV is 449,000
|
$124.49
-1.50%
|
11/2/2022
|
$121.59
|
PP = $124.59
|
|
MB = $130.82
|
Most Recent Note - 11/22/2022 6:20:32 PM
Y - Posted a 6th consecutive gain today with lighter than average volume, approaching its prior highs and pivot point. Fundamentals remain strong after reporting Sep '22 quarterly earnings +113% on +43% sales revenues versus the year ago period.
>>> FEATURED STOCK ARTICLE : Testing 50 Day Moving Average Line After Forming New Base - 11/2/2022 |
View all notes |
Set NEW NOTE alert |
Company Profile |
SEC
News |
Chart |
Request a new note
C
A
S
I |
NPO
-
NYSE
Enpro Industries Inc
Machinery-Gen Industrial
|
$118.55
|
-0.05
-0.04% |
$120.31
|
52,356
50.34% of 50 DAV
50 DAV is 104,000
|
$127.67
-7.14%
|
11/4/2022
|
$119.06
|
PP = $117.73
|
|
MB = $123.62
|
Most Recent Note - 11/21/2022 6:51:28 PM
Y - Ended lower with higher volume today for a 4th consecutive small loss, still remaining above its pivot point. Reported Sep '22 quarterly earnings +65% on +34% sales revenues versus the year ago period, its 3rd strong quarterly comparison above the +25% minimum earnings guideline (C criteria), helping it better match the winning models of the fact-based investment system. Annual earnings growth has been steady even through the pandemic.
>>> FEATURED STOCK ARTICLE : Finished Strong After Highlighted in Friday Mid-Day Report - 11/4/2022 |
View all notes |
Set NEW NOTE alert |
Company Profile |
SEC
News |
Chart |
Request a new note
C
A
S
I |
Symbol/Exchange
Company Name
Industry Group |
PRICE |
CHANGE
(%Change) |
Day High |
Volume
(% DAV)
(% 50 day avg vol) |
52 Wk Hi
% From Hi |
Featured
Date |
Price
Featured |
Pivot Featured |
|
Max Buy |
DGII
-
NASDAQ
Digi International Inc
COMPUTER HARDWARE - Networking and Communication Dev
|
$42.16
|
-0.32
-0.75% |
$43.68
|
237,023
57.39% of 50 DAV
50 DAV is 413,000
|
$43.36
-2.77%
|
11/10/2022
|
$41.82
|
PP = $40.96
|
|
MB = $43.01
|
Most Recent Note - 11/21/2022 12:34:55 PM
Y - Hitting another new high with today's gain. Recently wedged above the pivot point cited based on its 10/31/22 high plus 10 cents after forming an advanced "ascending base" pattern. Subsequent gains above the pivot point backed by at least +40% above average volume are needed to confirm a proper technical buy signal. Reported Sep '22 quarterly earnings +80% versus the year ago period, its 3rd strong quarterly comparison well above the +25% minimum earnings guideline (C criteria), helping it better match the fact-based investment system's winning models. Annual earnings (A criteria) history has been strong after a downturn in FY '17-18.
>>> FEATURED STOCK ARTICLE : Finish Below Pivot Point Leaves Disciplined Investors Waiting - 11/10/2022 |
View all notes |
Set NEW NOTE alert |
Company Profile |
SEC
News |
Chart |
Request a new note
C
A
S
I |
GFF
-
NYSE
Griffon Corporation
MATERIALS and CONSTRUCTION - General Building Materials
|
$36.24
|
+0.16
0.44% |
$36.68
|
391,106
107.45% of 50 DAV
50 DAV is 364,000
|
$36.42
-0.49%
|
11/10/2022
|
$34.13
|
PP = $35.02
|
|
MB = $36.77
|
Most Recent Note - 11/23/2022 12:28:42 PM
Y - Perched at its 52-weeek high with today's 2nd small gain backed by above average volume. Rallied above the pivot point with a big volume-driven gain on 11/18/22 backed by +220% above average volume triggering a technical buy signal. Last week it briefly undercut its 50 DMA line ($31.66) which defines important near-term support. Reported Sep '22 quarterly earnings +230% on +24% sales revenues versus the year ago period.
>>> FEATURED STOCK ARTICLE : Griffon Perched Near 52-Week High After 9-Week Base - 11/11/2022 |
View all notes |
Set NEW NOTE alert |
Company Profile |
SEC
News |
Chart |
Request a new note
C
A
S
I |
ANET
-
NYSE
Arista Networks Inc
Computer-Networking
|
$137.19
|
+1.15
0.85% |
$137.39
|
1,520,473
61.14% of 50 DAV
50 DAV is 2,487,000
|
$148.57
-7.66%
|
11/14/2022
|
$132.05
|
PP = $133.70
|
|
MB = $140.39
|
Most Recent Note - 11/18/2022 4:26:30 PM
Y - Posted a gain with light volume for its best close since April 5th, wedging higher after a cup-with-handle base. Subsequent gains and a close above the pivot point backed by at least +40% above average volume are needed to trigger a proper technical buy signal. Faces some resistance due to overhead supply up to the $148 level. Fundamentals are strong.
>>> FEATURED STOCK ARTICLE : Finished in Middle of Intra-Day Range After Challenging Pivot Point - 11/14/2022 |
View all notes |
Set NEW NOTE alert |
Company Profile |
SEC
News |
Chart |
Request a new note
C
A
S
I |
CPRX
-
NASDAQ
Catalyst Pharma Inc
Medical-Biomed/Biotech
|
$17.03
|
-0.48
-2.74% |
$17.76
|
3,802,673
115.20% of 50 DAV
50 DAV is 3,301,000
|
$17.71
-3.84%
|
11/22/2022
|
$17.38
|
PP = $16.66
|
|
MB = $17.49
|
Most Recent Note - 11/23/2022 12:18:59 PM
Y - Pulling back today. Finished strong on the prior session after highlighted in yellow with new pivot point cited based on its 11/11/22 high in the mid-day report. Rallied from a 9-week cup-with-handle base for a new 52-week high with a big gain backed by +90% above average volume. Reported Sep '22 quarterly earnings +86% on +59% sales revenues versus the year ago period. Showed resilience since dropped from the Featured Stocks list on 9/23/22.
>>> FEATURED STOCK ARTICLE : Breakout From Cup-With-Handle With 90% Above Average Volume - 11/22/2022 |
View all notes |
Set NEW NOTE alert |
Company Profile |
SEC
News |
Chart |
Request a new note
C
A
S
I |
CLFD
-
NASDAQ
Clearfield Inc
TELECOMMUNICATIONS - Cables / Satalite Equipment
|
$129.50
|
+3.82
3.04% |
$132.97
|
451,355
163.53% of 50 DAV
50 DAV is 276,000
|
$130.01
-0.39%
|
11/23/2022
|
$131.27
|
PP = $130.11
|
|
MB = $136.62
|
Most Recent Note - 11/23/2022 5:43:15 PM
Y - Color code was changed to yellow with pivot point cited based on its 8/25/22 high plus 10 cents. Hit a new all-time high but encountered distributional pressure. A gain and close above the pivot point backed by at least +40% above average volume may trigger a new technical buy signal. Gapped up on 11/18/22 for a considerable gain, rebounding from below its 50 DMA line ($102). It found support above its 200 DMA line and showed resilience after dropped from the Featured Stocks list on 11/08/22. Reported Sep '22 quarterly earnings +130% on +110% sales revenues versus the year ago period. See the latest FSU analysis for more details and a new annotated graph.
>>> FEATURED STOCK ARTICLE : Hit New High But Encountered Distributional Pressure - 11/23/2022 |
View all notes |
Set NEW NOTE alert |
Company Profile |
SEC
News |
Chart |
Request a new note
C
A
S
I |
Symbol/Exchange
Company Name
Industry Group |
PRICE |
CHANGE
(%Change) |
Day High |
Volume
(% DAV)
(% 50 day avg vol) |
52 Wk Hi
% From Hi |
Featured
Date |
Price
Featured |
Pivot Featured |
|
Max Buy |
|
|
|
THESE ARE NOT BUY RECOMMENDATIONS!
Comments contained in the body of this report are technical
opinions only. The material herein has been obtained
from sources believed to be reliable and accurate, however,
its accuracy and completeness cannot be guaranteed.
This site is not an investment advisor, hence it does
not endorse or recommend any securities or other investments.
Any recommendation contained in this report may not
be suitable for all investors and it is not to be deemed
an offer or solicitation on our part with respect to
the purchase or sale of any securities. All trademarks,
service marks and trade names appearing in this report
are the property of their respective owners, and are
likewise used for identification purposes only.
This report is a service available
only to active Paid Premium Members.
You may opt-out of receiving report notifications
at any time. Questions or comments may be submitted
by writing to Premium Membership Services 665 S.E. 10 Street, Suite 201 Deerfield Beach, FL 33441-5634 or by calling 1-800-965-8307
or 954-785-1121.
|
|
|