You are not logged in.
This means you
CAN ONLY VIEW reports that were published prior to Sunday, April 13, 2025.
You
MUST UPGRADE YOUR MEMBERSHIP if you want to see any current reports.
AFTER MARKET UPDATE - THURSDAY, MAY 13TH, 2021
Previous After Market Report Next After Market Report >>>
|
|
|
|
DOW |
+433.79 |
34,021.45 |
+1.29% |
|
Volume |
1,027,238,118 |
-2% |
|
Volume |
4,664,858,500 |
-1% |
|
NASDAQ |
+93.31 |
13,124.99 |
+0.72% |
|
Advancers |
2,195 |
67% |
|
Advancers |
2,139 |
51% |
|
S&P 500 |
+49.46 |
4,112.50 |
+1.22% |
|
Decliners |
1,067 |
33% |
|
Decliners |
2,024 |
49% |
|
Russell 2000 |
+35.81 |
2,170.95 |
+1.68% |
|
52 Wk Highs |
44 |
|
|
52 Wk Highs |
54 |
|
|
S&P 600 |
+31.20 |
1,325.60 |
+2.41% |
|
52 Wk Lows |
85 |
|
|
52 Wk Lows |
15 |
|
|
 |
Major Indices Posted Solid Gains to Halt Steep Slide
Kenneth J. Gruneisen - Passed the CAN SLIM® Master's Exam
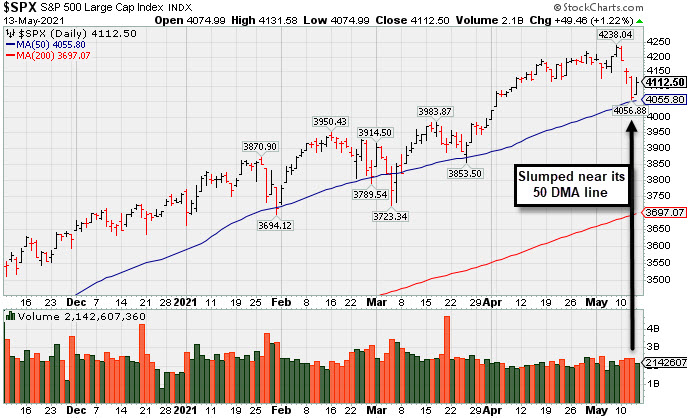
The Dow jumped 433 points, reclaiming positive territory for the month of May. The S&P 500 climbed 1.2% a day after suffering its biggest single session decline since February. The Nasdaq Composite gained 0.7% as tech and related shares got a reprieve from this week's rout. The volume totals reported were lighter than the prior session on the NYSE and on the Nasdaq exchange. Breadth was positive as advancers led decliners by a 2-1 margin on the NYSE but the mix was nearly even on the Nasdaq exchange. There were 15 high-ranked companies from the Leaders List that hit new 52-week highs and were listed on the BreakOuts Page, versus 10 on the prior session, still down abruptly from the total of 171 on Monday's session. New 52-week highs outnumbered new 52-week lows on the Nasdaq exchange but new lows outnumbered new highs on the NYSE. The major indices (M criteria) are in a confirmed uptrend. Investors are reminded to always make buying and selling decisions on case-by-case basis under the strict criteria and rules of the fact-based investment system.
PICTURED: The S&P 500 Index abruptly retreated from its record high with 3 consecutive losses, but halted its slide with Thursday's solid gain after nearly testing its 50-day moving average (DMA) line.
U.S. stocks ended firmly higher on Thursday, as the major averages rebounded from their worst three-day slump since October. Amid the relief rally, the MSCI All-Country World Index snapped a three-session losing streak, which was its longest such stretch since early March.
Another round of inflation data was in focus, with producer prices rising 0.6% in April, doubling expectations, but still easing from the prior 1% jump. The headline figure climbed 6.2% year-over-year, well above March's 4.2% advance. Core PPI (ex-food and energy) increased at an annualized 4.1% pace last month. Separately, initial jobless claims came in at 473,000 in the latest week to a fresh pandemic low. Treasuries strengthened, with the yield on the 10-year note down four basis points to 1.65%, a day after experiencing its biggest single-session increase since March.
Ten of 11 S&P 500 sectors closed in positive territory. The Industrials, Financials and Utilities paced the gains with each group jumping more than 1.5%. Energy shares bucked the uptrend as WTI crude retreated from an eight week high. Oil prices experienced their worst one-day decline since early April following news Colonial Pipeline’s operations were restored after last weekend’s cyberattack. In earnings, Chinese e-commerce giant Alibaba (BABA -5%) fell following a disappointing profit tally. |
 Kenneth J. Gruneisen started out as a licensed stockbroker in August 1987, a couple of months prior to the historic stock market crash that took the Dow Jones Industrial Average down -22.6% in a single day. He has published daily fact-based fundamental and technical analysis on high-ranked stocks online for two decades. Through FACTBASEDINVESTING.COM, Kenneth provides educational articles, news, market commentary, and other information regarding proven investment systems that work in good times and bad.
Comments contained in the body of this report are technical opinions only and are not necessarily those of Gruneisen Growth Corp. The material herein has been obtained from sources believed to be reliable and accurate, however, its accuracy and completeness cannot be guaranteed. Our firm, employees, and customers may effect transactions, including transactions contrary to any recommendation herein, or have positions in the securities mentioned herein or options with respect thereto. Any recommendation contained in this report may not be suitable for all investors and it is not to be deemed an offer or solicitation on our part with respect to the purchase or sale of any securities. |
|
 |
Financial, Retail, Semiconductor, and Networking Indexes Rose
Kenneth J. Gruneisen - Passed the CAN SLIM® Master's Exam
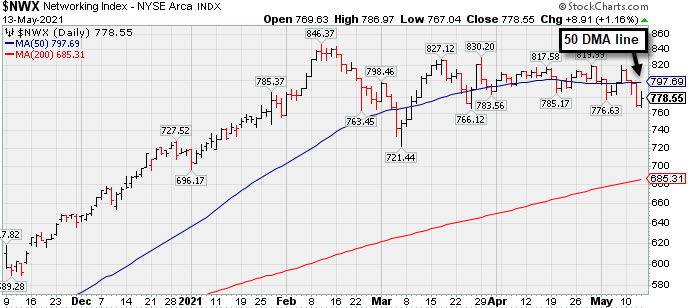
The Broker/Dealer Index ($XBD +2.02%) and Bank Index ($BKX +2.14%) both posted influential gains and the Retail Index ($RLX +1.11%) also rose on Thursday. The Semiconductor Index ($SOX +1.50%) and Networking Index ($NWX +1.16%) both posted solid gains while the Biotech Index ($BTK +0.08%) finished flat. Commodity-linked groups had a negative bias as the Oil Services Index ($OSX -1.03%) and Integrated Oil Index ($XOI -1.77%) both outpaced the Gold & Silver Index ($XAU -0.46%) to the downside.
PICTURED: The Networking Index ($NWX +1.16%) is sputtering below its 50-day moving average (DMA) line.
| Oil Services |
$OSX |
59.60 |
-0.62 |
-1.03% |
+34.46% |
| Integrated Oil |
$XOI |
1,061.25 |
-19.18 |
-1.77% |
+33.92% |
| Semiconductor |
$SOX |
2,893.94 |
+42.79 |
+1.50% |
+3.52% |
| Networking |
$NWX |
778.55 |
+8.91 |
+1.16% |
+8.57% |
| Broker/Dealer |
$XBD |
457.42 |
+9.04 |
+2.02% |
+21.14% |
| Retail |
$RLX |
3,774.36 |
+41.51 |
+1.11% |
+5.92% |
| Gold & Silver |
$XAU |
152.94 |
-0.71 |
-0.46% |
+6.07% |
| Bank |
$BKX |
131.61 |
+2.75 |
+2.14% |
+34.42% |
| Biotech |
$BTK |
5,471.79 |
+4.44 |
+0.08% |
-4.66% |
|
|
|
 |
Homebuilder Pulled Back After Hitting New High
Kenneth J. Gruneisen - Passed the CAN SLIM® Master's Exam
Meritage Homes Corp (MTH +$5.44 or +5.14% to $111.27) posted a gain today with near average volume. It ended near the session low on the prior session after highlighted in yellow in the mid-day report (read here) with pivot point cited based on its 10/05/20 high plus 10 cents. It pulled back for 2 consecutive volume-driven losses after hitting new 52-week highs with volume-driven gains. Subsequent gains above the pivot point with at least +40% above average volume would be a reassuring confirmation of fresh institutional buying demand (N criteria).
The high-ranked Building - Residential/Commercial firm reported earnings +88% on +20% sales revenues for the Mar '21 quarter versus the year ago period, its 7th consecutive strong quarterly comparison above the +25% minimum guideline (C criteria). Annual earnings (A criteria) history has been strong after a downturn in FY '15. It has a 97 Earnings Per Share Rating.
The number of top-rated funds owning its shares rose from 538 in Jun '20 to 616 in Mar '21, a reassuring sign concerning the I criteria. Its small supply of only 37.5 million shares outstanding (S criteria) can contribute to greater price volatility in the event of institutional buying or selling
|
|
|
Color Codes Explained :
Y - Better candidates highlighted by our
staff of experts.
G - Previously featured
in past reports as yellow but may no longer be buyable under the
guidelines.
***Last / Change / Volume data in this table is the closing quote data***
Symbol/Exchange
Company Name
Industry Group |
PRICE |
CHANGE
(%Change) |
Day High |
Volume
(% DAV)
(% 50 day avg vol) |
52 Wk Hi
% From Hi |
Featured
Date |
Price
Featured |
Pivot Featured |
|
Max Buy |
 SIVB
-
NASDAQ
SIVB
-
NASDAQ
S V B Financial Group
BANKING - Regional - Pacific Banks
|
$557.56
|
+10.29
1.88% |
$566.98
|
320,437
56.82% of 50 DAV
50 DAV is 564,000
|
$595.90
-6.43%
|
4/23/2021
|
$579.70
|
PP = $577.16
|
|
MB = $606.02
|
Most Recent Note - 5/11/2021 5:14:38 PM
Y - Perched near its high, it posted another gain today with average volume. Confirming volume-driven gains are still needed to help clinch a convincing technical buy signal. Bullish action came after it reported earnings +293% on +64% sales revenues for the Mar '21 quarter versus the year ago period, its 3rd strong comparison. Completed a new Public Offering on 3/24/21.
>>> FEATURED STOCK ARTICLE : Hit New High But Closed Below Pivot Point - 4/23/2021 |
View all notes |
Set NEW NOTE alert |
Company Profile |
SEC
News |
Chart |
Request a new note
C
A
S
I |
CROX
-
NASDAQ
Crocs Inc
CONSUMER NON-DURABLES - Textile - Apparel Footwear
|
$100.29
|
+2.34
2.39% |
$101.82
|
1,143,528
80.87% of 50 DAV
50 DAV is 1,414,000
|
$109.91
-8.75%
|
4/27/2021
|
$99.81
|
PP = $86.50
|
|
MB = $90.83
|
 Most Recent Note - 5/13/2021 6:03:53 PM
G - Posted a gain today with lighter volume following 3 consecutive losses from its all-time high. It is very extended from the latest base. Prior highs in the $86 area define initial support to watch on pullbacks.
>>> FEATURED STOCK ARTICLE : Powerful "Breakaway Gap" for CROX - 4/27/2021 |
View all notes |
Set NEW NOTE alert |
Company Profile |
SEC
News |
Chart |
Request a new note
C
A
S
I |
RCKY
-
NASDAQ
Rocky Brands Inc
CONSUMER NON-DURABLES - Textile - Apparel Footwear
|
$55.67
|
+0.00
0.00% |
$57.16
|
91,566
104.05% of 50 DAV
50 DAV is 88,000
|
$69.00
-19.32%
|
5/5/2021
|
$61.65
|
PP = $61.55
|
|
MB = $64.63
|
Most Recent Note - 5/12/2021 5:11:08 PM
G - Abruptly pulled back from its all-time high with today's 3rd big volume-driven loss undercutting the prior high in the $61 area raising concerns. Fundamentals remain strong. The 50 DMA line ($53.65) defines the next important support level.
>>> FEATURED STOCK ARTICLE : Rocky Brands Powered Higher After Strong Earnings - 5/5/2021 |
View all notes |
Set NEW NOTE alert |
Company Profile |
SEC
News |
Chart |
Request a new note
C
A
S
I |
CRL
-
NYSE
Charles River Labs Intl
DRUGS - Biotechnology
|
$321.01
|
+4.25
1.34% |
$324.40
|
10,646,779
3,077.10% of 50 DAV
50 DAV is 346,000
|
$349.13
-8.05%
|
12/17/2020
|
$247.06
|
PP = $257.98
|
|
MB = $270.88
|
Most Recent Note - 5/13/2021 12:39:15 PM
G - Extended from any sound base, it abruptly retreated from its all-time high with a spurt of volume-driven losses. Its 50 DMA line ($306) defines near-term support above the prior high ($303). Reported Mar '21 quarterly earnings +38% on +17%v sales revenues versus the year ago period. Two of the past 3 quarterly comparisons have been above the +25% minimum earnings guideline (C criteria).
>>> FEATURED STOCK ARTICLE : Pulling Back From Record High Following Strong Quarterly Report - 5/6/2021 |
View all notes |
Set NEW NOTE alert |
Company Profile |
SEC
News |
Chart |
Request a new note
C
A
S
I |
CAMT
-
NASDAQ
Camtek Ltd
ELECTRONICS - Scientific and Technical Instrum
|
$26.44
|
-0.64
-2.36% |
$28.06
|
388,897
130.07% of 50 DAV
50 DAV is 299,000
|
$36.14
-26.84%
|
4/28/2021
|
$35.03
|
PP = $35.34
|
|
MB = $37.11
|
Most Recent Note - 5/12/2021 5:18:04 PM
G - Color code is changed to green while slumping well below its 50 DMA line raising concerns. A prompt rebound is needed for its outlook to improve. Subsequent gains and a strong close above the pivot point backed by at least +40% above average volume still are needed to trigger a technical buy signal.
>>> FEATURED STOCK ARTICLE : Earnings Acceleration and Perched at High After Ascending Base - 4/28/2021 |
View all notes |
Set NEW NOTE alert |
Company Profile |
SEC
News |
Chart |
Request a new note
C
A
S
I |
Symbol/Exchange
Company Name
Industry Group |
PRICE |
CHANGE
(%Change) |
Day High |
Volume
(% DAV)
(% 50 day avg vol) |
52 Wk Hi
% From Hi |
Featured
Date |
Price
Featured |
Pivot Featured |
|
Max Buy |
BRKS
-
NASDAQ
Brooks Automation
ELECTRONICS - Semiconductor Equipment and Mate
|
$89.58
|
+2.99
3.45% |
$90.74
|
1,213,774
148.93% of 50 DAV
50 DAV is 815,000
|
$108.72
-17.60%
|
4/5/2021
|
$99.31
|
PP = $91.88
|
|
MB = $96.47
|
Most Recent Note - 5/13/2021 5:56:47 PM
G - Posted a volume-driven gain today but it is still sputtering below prior highs in the $91 area and also below its 50 DMA line ($91.12). More damaging losses would raise greater concerns.
>>> FEATURED STOCK ARTICLE : Extended From Base and Consolidating After Recent Rally - 4/30/2021 |
View all notes |
Set NEW NOTE alert |
Company Profile |
SEC
News |
Chart |
Request a new note
C
A
S
I |
OPY
-
NYSE
Oppenheimer Holdings Inc
FINANCIAL SERVICES - Investment Brokerage - Regiona
|
$48.22
|
+0.80
1.69% |
$48.39
|
72,067
61.07% of 50 DAV
50 DAV is 118,000
|
$52.45
-8.06%
|
2/25/2021
|
$38.95
|
PP = $38.11
|
|
MB = $40.02
|
Most Recent Note - 5/10/2021 6:28:26 PM
G - Hovering near its all-time high, very extended from any sound base. Bullish action came after it reported Mar '21 quarterly earnings +402% on +59% sales revenues versus the year ago period. Prior high in the $44 area defines initial support to watch above its 50 DMA line ($43.69).
>>> FEATURED STOCK ARTICLE : Negative Reversal After 7 Consecutive Gains - 4/20/2021 |
View all notes |
Set NEW NOTE alert |
Company Profile |
SEC
News |
Chart |
Request a new note
C
A
S
I |
MTH
-
NYSE
Meritage Homes Corp
MATERIALS and CONSTRUCTION - Residential Construction
|
$111.27
|
+5.44
5.14% |
$111.90
|
444,608
103.90% of 50 DAV
50 DAV is 427,900
|
$120.19
-7.42%
|
10/26/2004
|
$108.84
|
PP = $117.16
|
|
MB = $123.02
|
Most Recent Note - 5/13/2021 5:52:47 PM
Y - Posted a solid gain today, halting its slide following 2 consecutive volume-driven losses after hitting new 52-week highs with volume-driven gains. Subsequent gains above the pivot point with at least +40% above average volume would be a reassuring confirmation of fresh institutional buying demand. Reported earnings +88% on +20% sales revenues for the Mar '21 quarter versus the year ago period, its 7th consecutive strong quarterly comparison above the +25% minimum guideline (C criteria). Annual earnings (A criteria) history has been strong after a downturn in FY '15. See the latest FSU analysis for more details and a new annotated graph.
>>> FEATURED STOCK ARTICLE : Homebuilder Pulled Back After Hitting New High - 5/13/2021 |
View all notes |
Set NEW NOTE alert |
Company Profile |
SEC
News |
Chart |
Request a new note
C
A
S
I |
LAD
-
NYSE
Lithia Motors Inc Cl A
SPECIALTY RETAIL - Auto Dealerships
|
$360.23
|
+9.51
2.71% |
$364.63
|
270,684
91.76% of 50 DAV
50 DAV is 295,000
|
$417.98
-13.82%
|
4/21/2021
|
$377.00
|
PP = $418.08
|
|
MB = $438.98
|
Most Recent Note - 5/11/2021 5:13:05 PM
G - Slumped further below its 50 DMA line ($386) with today's 6th consecutive loss. A prompt rebound above its 50 DMA line is needed for its outlook to improve. Subsequent gains above the pivot point backed by at least +40% above average volume are needed to trigger a technical buy signal.
>>> FEATURED STOCK ARTICLE : Building a Base With Rebound Above 50-Day Moving Average - 4/21/2021 |
View all notes |
Set NEW NOTE alert |
Company Profile |
SEC
News |
Chart |
Request a new note
C
A
S
I |
MED
-
NYSE
Medifast Inc
SPECIALTY RETAIL - Specialty Retail, Other
|
$286.39
|
+12.14
4.43% |
$286.88
|
128,733
104.66% of 50 DAV
50 DAV is 123,000
|
$296.50
-3.41%
|
5/11/2021
|
$285.72
|
PP = $279.56
|
|
MB = $293.54
|
Most Recent Note - 5/13/2021 6:00:16 PM
Y - Posted a big gain today with average volume, rebounding back above the prior high ($279) after briefly slumping back into the prior base.
>>> FEATURED STOCK ARTICLE : Held Ground Following Breakout Gain on Prior Session - 5/11/2021 |
View all notes |
Set NEW NOTE alert |
Company Profile |
SEC
News |
Chart |
Request a new note
C
A
S
I |
Symbol/Exchange
Company Name
Industry Group |
PRICE |
CHANGE
(%Change) |
Day High |
Volume
(% DAV)
(% 50 day avg vol) |
52 Wk Hi
% From Hi |
Featured
Date |
Price
Featured |
Pivot Featured |
|
Max Buy |
CLFD
-
NASDAQ
Clearfield Inc
TELECOMMUNICATIONS - Cables / Satalite Equipment
|
$34.33
|
+0.97
2.91% |
$34.63
|
117,745
84.10% of 50 DAV
50 DAV is 140,000
|
$40.26
-14.73%
|
4/26/2021
|
$39.68
|
PP = $38.85
|
|
MB = $40.79
|
Most Recent Note - 5/13/2021 6:02:11 PM
Y - Posted a solid gain today following 3 consecutive losses with below average volume. Fundamentals remain strong after it reported Mar '21 quarterly earnings +440% on +45% sales revenues versus the year ago period, continuing its strong earnings track record.
>>> FEATURED STOCK ARTICLE : Rallied Straight Up From Bottom of 10-Week Base - 4/26/2021 |
View all notes |
Set NEW NOTE alert |
Company Profile |
SEC
News |
Chart |
Request a new note
C
A
S
I |
EDUC
-
NASDAQ
Educational Development
WHOLESALE - Basic Materials Wholesale
|
$15.50
|
-0.39
-2.45% |
$16.49
|
19,454
75.11% of 50 DAV
50 DAV is 25,900
|
$20.00
-22.50%
|
3/10/2021
|
$17.89
|
PP = $20.10
|
|
MB = $21.11
|
Most Recent Note - 5/13/2021 6:07:22 PM
Slumped below its 200 DMA line ($16.18) with today's 2nd consecutive loss. Its Relative Strength rating has slumped to 74, below the 80+ minimum for buy candidates. A subsequent rebound above the 50 DMA line is needed for its outlook to improve. Met stubborn resistance in the $19-20 area. It will be dropped from the Featured Stocks list tonight.
>>> FEATURED STOCK ARTICLE : Finding Support During Consolidation Above 50-Day Moving Average - 4/16/2021 |
View all notes |
Set NEW NOTE alert |
Company Profile |
SEC
News |
Chart |
Request a new note
C
A
S
I |
SMPL
-
NASDAQ
Simply Good Foods Co
Food-Confectionery
|
$33.18
|
+0.59
1.80% |
$33.35
|
1,476,591
223.39% of 50 DAV
50 DAV is 661,000
|
$35.34
-6.13%
|
12/28/2020
|
$30.40
|
PP = $31.44
|
|
MB = $33.01
|
Most Recent Note - 5/13/2021 1:10:15 PM
G - Undercutting its 50 DMA line ($32.54) with today's loss backed by higher volume raising concerns. Reported Feb '21 quarterly earnings +9% on +2% sales revenues versus the year ago period, below the +25% minimum earnings guideline (C criteria), raising fundamental concerns. Its current Relative Strength Rating is 79, just below the 80+ minimum guideline for buy candidates.
>>> FEATURED STOCK ARTICLE : Hovering Near All-Time High Following Lackluster Quarter - 5/10/2021 |
View all notes |
Set NEW NOTE alert |
Company Profile |
SEC
News |
Chart |
Request a new note
C
A
S
I |
IBP
-
NYSE
"Installed Building Products, Inc"
DIVERSIFIED SERVICES - Business/Management Services
|
$121.00
|
+5.11
4.41% |
$121.63
|
313,720
128.15% of 50 DAV
50 DAV is 244,800
|
$140.58
-13.93%
|
4/19/2021
|
$131.15
|
PP = $130.21
|
|
MB = $136.72
|
Most Recent Note - 5/13/2021 5:58:43 PM
G - Showed resilience today, rebounding near its 50 DMA line ($121). More damaging losses would raise serious concerns. Weak action came after it reported Mar '21 quarterly earnings +15% on +10% sales revenues versus the year ago period, below the +25% minimum earnings guideline (C criteria) raising fundamental concerns.
>>> FEATURED STOCK ARTICLE : Steady Streak of Gains Into New High Territory - 4/19/2021 |
View all notes |
Set NEW NOTE alert |
Company Profile |
SEC
News |
Chart |
Request a new note
C
A
S
I |
QRVO
-
NASDAQ
"Qorvo, Inc"
ELECTRONICS - Semiconductor - Integrated Cir
|
$166.85
|
+1.50
0.91% |
$170.30
|
1,275,011
105.10% of 50 DAV
50 DAV is 1,213,100
|
$201.68
-17.27%
|
4/1/2021
|
$190.48
|
PP = $191.92
|
|
MB = $201.52
|
Most Recent Note - 5/10/2021 2:50:08 PM
G - Color code is changed to green after gapping down today violating its 50 DMA line ($183.60) and undercutting the prior low with a damaging volume-driven loss triggering a technical sell signal. Reported Mar '21 quarterly earnings +75% on +36% sales revenues versus the year ago period, its 3rd very strong quarterly comparison. It stalled after recently wedging up to new highs from a 9-week base. Its Relative Strength Rating is 69, below the 80+ minimum for buy candidates.
>>> FEATURED STOCK ARTICLE : Quiet Gain For Best Ever Close - 4/29/2021 |
View all notes |
Set NEW NOTE alert |
Company Profile |
SEC
News |
Chart |
Request a new note
C
A
S
I |
Symbol/Exchange
Company Name
Industry Group |
PRICE |
CHANGE
(%Change) |
Day High |
Volume
(% DAV)
(% 50 day avg vol) |
52 Wk Hi
% From Hi |
Featured
Date |
Price
Featured |
Pivot Featured |
|
Max Buy |
YETI
-
NYSE
Yeti Holdings Inc
Leisure-Products
|
$85.82
|
+4.40
5.40% |
$85.95
|
3,631,676
281.53% of 50 DAV
50 DAV is 1,290,000
|
$90.65
-5.33%
|
5/13/2021
|
$84.20
|
PP = $90.65
|
|
MB = $95.18
|
Most Recent Note - 5/13/2021 1:25:24 PM
Y - Reported Mar 21 quarterly earnings +245% on +42% sales revenues versus the year ago period, continuing its strong earnings track record. Abruptly retreated from its all-time high with found prompt support near the prior highs in the $80 area and its 50 DMA line ($78.73). Color code is changed to yellow as a valid secondary buy point exists from its 10 WMA line up to 5% above the latest high.
>>> FEATURED STOCK ARTICLE : Hovering Near Record High Following Volume-Driven Gains - 5/3/2021 |
View all notes |
Set NEW NOTE alert |
Company Profile |
SEC
News |
Chart |
Request a new note
C
A
S
I |
MRBK
-
NASDAQ
Meridian Corp
Banks-Northeast
|
$25.93
|
+0.56
2.21% |
$26.64
|
43,313
121.67% of 50 DAV
50 DAV is 35,600
|
$27.96
-7.26%
|
2/22/2021
|
$25.58
|
PP = $26.10
|
|
MB = $27.41
|
Most Recent Note - 5/13/2021 5:54:43 PM
Y - Posted a gain today with slightly above average volume. Consolidating near its 50 DMA line ($25.90), still perched only -7.3% off its 52-week high. Reported Mar '21 earnings +323% on +93% sales revenues versus the year ago period, continuing its strong earnings track record. Recent low ($24.01 on 4/21/21) defines important near-term support where any violation may trigger a worrisome technical sell signal. Its Relative Strength Rating is 78, below the 80 minimum guideline.
>>> FEATURED STOCK ARTICLE : Bank Consolidating Near 50 Day Moving Average Line - 5/7/2021 |
View all notes |
Set NEW NOTE alert |
Company Profile |
SEC
News |
Chart |
Request a new note
C
A
S
I |
CLAR
-
NASDAQ
Clarus Corporation
Leisure-Products
|
$20.90
|
-0.39
-1.83% |
$21.70
|
244,445
145.50% of 50 DAV
50 DAV is 168,000
|
$21.93
-4.70%
|
5/12/2021
|
$21.40
|
PP = $19.73
|
|
MB = $20.72
|
Most Recent Note - 5/12/2021 5:06:34 PM
Y - Held its ground today after highlighted in yellow with pivot point cited based on its 3/09/21 high plus 10 cents. Quickly getting extended from prior highs with today's 4th consecutive gain backed by ever-increasing volume. The Sep, Dec '20 and Mar '21 quarterly results showed very strong earnings increases over the year ago periods with impressive acceleration in sales revenues growth rate. Annual earnings history has been strong. See the latest FSU analysis for more details and a new annotated graph.
>>> FEATURED STOCK ARTICLE : 4 Volume-Driven Gains Into New High Territory - 5/12/2021 |
View all notes |
Set NEW NOTE alert |
Company Profile |
SEC
News |
Chart |
Request a new note
C
A
S
I |
|
|
|
THESE ARE NOT BUY RECOMMENDATIONS!
Comments contained in the body of this report are technical
opinions only. The material herein has been obtained
from sources believed to be reliable and accurate, however,
its accuracy and completeness cannot be guaranteed.
This site is not an investment advisor, hence it does
not endorse or recommend any securities or other investments.
Any recommendation contained in this report may not
be suitable for all investors and it is not to be deemed
an offer or solicitation on our part with respect to
the purchase or sale of any securities. All trademarks,
service marks and trade names appearing in this report
are the property of their respective owners, and are
likewise used for identification purposes only.
This report is a service available
only to active Paid Premium Members.
You may opt-out of receiving report notifications
at any time. Questions or comments may be submitted
by writing to Premium Membership Services 665 S.E. 10 Street, Suite 201 Deerfield Beach, FL 33441-5634 or by calling 1-800-965-8307
or 954-785-1121.
|
|
|