You are not logged in.
This means you
CAN ONLY VIEW reports that were published prior to Friday, April 18, 2025.
You
MUST UPGRADE YOUR MEMBERSHIP if you want to see any current reports.
AFTER MARKET UPDATE - THURSDAY, DECEMBER 29TH, 2022
Previous After Market Report Next After Market Report >>>
|
|
|
|
DOW |
+345.09 |
33,220.80 |
+1.05% |
|
Volume |
682,667,328 |
-78% |
|
Volume |
4,130,947,100 |
+5% |
|
NASDAQ |
+264.80 |
10,478.09 |
+2.59% |
|
Advancers |
2,575 |
84% |
|
Advancers |
3,698 |
81% |
|
S&P 500 |
+66.06 |
3,849.28 |
+1.75% |
|
Decliners |
474 |
16% |
|
Decliners |
867 |
19% |
|
Russell 2000 |
+44.23 |
1,766.25 |
+2.57% |
|
52 Wk Highs |
56 |
|
|
52 Wk Highs |
89 |
|
|
S&P 600 |
+25.03 |
1,162.74 |
+2.20% |
|
52 Wk Lows |
84 |
|
|
52 Wk Lows |
210 |
|
|
The market is in a correction (M criteria). Thin leadership was a recent warning sign as weakness in the major averages was noted.
We have restored our systems after a server failure that over the holiday weekend temporarily disabled some critical website functions. As a consequence we could not publish the usual mid-day and after market reports for Tuesday and Wednesday. We apologize for any inconvenience this may have been to our members and we greatly appreciate your patience and understanding.
|
 |
Breadth Positive as Major Averages Bounce
Kenneth J. Gruneisen - Passed the CAN SLIM® Master's Exam
The Dow added 345 points, while the technology heavy Nasdaq Composite jumped 2.6%. The S&P 500 increased 1.8% with all S&P sectors finishing in positive territory. Volume totals were higher than the prior session on the NYSE and on the Nasdaq exchange. Advancers led decliners by a 5-1 margin on the NYSE and by a 3-1 margin on the Nasdaq exchange. There were 5 high-ranked companies from the Leaders List that hit new 52-week highs and were listed on the BreakOuts Page. New 52-week lows solidly outnumbered new 52-week highs totals on the NYSE and on the Nasdaq exchange. The market is in a correction (M criteria). Disciplined investors know to avoid new buying, reduce exposure and raise cash until a new confirmed rally with a solid follow-through day is noted. Chart courtesy of www.stockcharts.com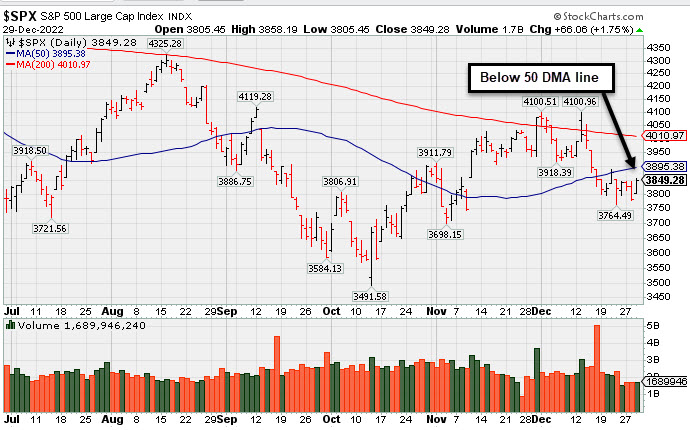 PICTURED: The S&P 500 Index is sputtering below its 50-day moving average (DMA) line.
U.S. equities surged Thursday after the Labor Department reported initial jobless claims increased by 9,000 to 225,000 for the week ended December 24. Meanwhile, continuing claims reached 1.7 million in the week ended December 17, hitting a level not seen since early February. Many analysts forecast the upward spike in claims is suggesting out-of-work individuals are finding it harder to obtain new job opportunities.
Treasuries were mixed with the yield on the benchmark 10-year note decreasing five basis points (0.05%) to 3.83%, while the 30-year bond yield declined five basis points (0.05%) to 3.91%. The yield on the more Federal Reserve (Fed) sensitive two-year note increased one basis point (0.01%) to 4.36%. In commodities, West Texas Intermediate (WTI) crude declined 0.6% to $78.51/barrel as more countries raise concerns over China reopening their borders. Elsewhere, the U.S. Energy Information Administration announced a surprising build in crude inventories for the week ended December 23.
|
 Kenneth J. Gruneisen started out as a licensed stockbroker in August 1987, a couple of months prior to the historic stock market crash that took the Dow Jones Industrial Average down -22.6% in a single day. He has published daily fact-based fundamental and technical analysis on high-ranked stocks online for two decades. Through FACTBASEDINVESTING.COM, Kenneth provides educational articles, news, market commentary, and other information regarding proven investment systems that work in good times and bad.
Comments contained in the body of this report are technical opinions only and are not necessarily those of Gruneisen Growth Corp. The material herein has been obtained from sources believed to be reliable and accurate, however, its accuracy and completeness cannot be guaranteed. Our firm, employees, and customers may effect transactions, including transactions contrary to any recommendation herein, or have positions in the securities mentioned herein or options with respect thereto. Any recommendation contained in this report may not be suitable for all investors and it is not to be deemed an offer or solicitation on our part with respect to the purchase or sale of any securities. |
|
 |
Energy, Tech, Retail, and Financial Indexes Led Gainers
Kenneth J. Gruneisen - Passed the CAN SLIM® Master's Exam
The Retail Index ($RLX +1.97%), Broker/Dealer Index ($XBD +1.78%), and Bank Index ($BKX +1.70%) posted influential gains.The tech sector had a positive bias as the Semiconductor Index ($SOX +3.32%), Networking Index ($NWX +2.75%), and Biotech Index ($BTK +2.29%) rose. The Oil Services Index ($OSX +2.54%) and Integrated Oil Index ($XOI +1.05%) both posted solid gains. The Gold & Silver Index ($XAU +0.46%) edged higher.
PICTURED: The Oil Services Index ($OSX +2.54%) is consolidating near its 50-day moving average (DMA) line.
| Oil Services |
$OSX |
83.41 |
+2.07 |
+2.54% |
+58.22% |
| Integrated Oil |
$XOI |
1,777.77 |
+18.45 |
+1.05% |
+50.89% |
| Semiconductor |
$SOX |
2,534.95 |
+81.45 |
+3.32% |
-35.76% |
| Networking |
$NWX |
782.70 |
+20.95 |
+2.75% |
-19.40% |
| Broker/Dealer |
$XBD |
451.16 |
+7.91 |
+1.78% |
-7.33% |
| Retail |
$RLX |
2,768.63 |
+53.49 |
+1.97% |
-34.49% |
| Gold & Silver |
$XAU |
121.62 |
+0.55 |
+0.46% |
-8.17% |
| Bank |
$BKX |
101.03 |
+1.69 |
+1.70% |
-23.59% |
| Biotech |
$BTK |
5,277.16 |
+118.12 |
+2.29% |
-4.37% |
|
|
|
 |
Featured Stocks
Kenneth J. Gruneisen - Passed the CAN SLIM® Master's Exam
|
|
|
Color Codes Explained :
Y - Better candidates highlighted by our
staff of experts.
G - Previously featured
in past reports as yellow but may no longer be buyable under the
guidelines.
***Last / Change / Volume data in this table is the closing quote data***
Symbol/Exchange
Company Name
Industry Group |
PRICE |
CHANGE
(%Change) |
Day High |
Volume
(% DAV)
(% 50 day avg vol) |
52 Wk Hi
% From Hi |
Featured
Date |
Price
Featured |
Pivot Featured |
|
Max Buy |
 ESQ
-
NASDAQ
ESQ
-
NASDAQ
Esquire Financial Hldgs
Finance-Commercial Loans
|
$42.71
|
+0.86
2.05% |
$42.90
|
10,647
39.43% of 50 DAV
50 DAV is 27,000
|
$48.13
-11.26%
|
10/18/2022
|
$40.02
|
PP = $39.95
|
|
MB = $41.95
|
 Most Recent Note - 12/29/2022 3:29:14 PM
Gains back above the 50 DMA line are needed for its outlook to improve but that short-term average has been acting as resistance. It will be dropped from the Featured Stocks list tonight.
>>> FEATURED STOCK ARTICLE : Found Support Recently Near Pivot Point and Prior Highs - 12/22/2022 |
View all notes |
Set NEW NOTE alert |
Company Profile |
SEC
News |
Chart |
Request a new note
C
A
S
I |
CMC
-
NYSE
Commercial Metals Co
METALS and MINING - Steel and Iron
|
$48.76
|
+0.43
0.89% |
$48.91
|
603,037
59.41% of 50 DAV
50 DAV is 1,015,000
|
$50.83
-4.07%
|
10/14/2022
|
$41.61
|
PP = $44.45
|
|
MB = $46.67
|
Most Recent Note - 12/29/2022 3:21:50 PM
G - Volume totals have been cooling while consolidating above its 50 DMA line ($47.17) and prior highs in the $46 area defining important near-term support to watch. Fundamentals remain strong.
>>> FEATURED STOCK ARTICLE : Wedging Higher With Recent Gains Lacking Great Volume - 12/2/2022 |
View all notes |
Set NEW NOTE alert |
Company Profile |
SEC
News |
Chart |
Request a new note
C
A
S
I |
GPK
-
NYSE
Graphic Packaging Hldg
CONSUMER NON-DURABLES - Packaging and Containers
|
$22.34
|
+0.33
1.50% |
$22.42
|
1,166,731
37.52% of 50 DAV
50 DAV is 3,110,000
|
$24.07
-7.19%
|
10/25/2022
|
$22.75
|
PP = $24.17
|
|
MB = $25.38
|
Most Recent Note - 12/29/2022 3:31:29 PM
G - Consolidating near its 50 DMA line ($22.33). Faces resistance due to overhead supply up to the $24level. Fundamentals remain strong.
>>> FEATURED STOCK ARTICLE : Violated 50-Day Moving Average After Recently Failing to Break Out - 12/15/2022 |
View all notes |
Set NEW NOTE alert |
Company Profile |
SEC
News |
Chart |
Request a new note
C
A
S
I |
CBZ
-
NYSE
C B I Z Inc
Comml Svcs-Consulting
|
$47.29
|
+0.70
1.50% |
$47.49
|
109,368
45.19% of 50 DAV
50 DAV is 242,000
|
$51.67
-8.48%
|
10/26/2022
|
$47.83
|
PP = $48.57
|
|
MB = $51.00
|
Most Recent Note - 12/29/2022 3:18:25 PM
Still sputtering below its 50 DMA line ($48.24). A rebound above the 50 DMA line is needed for its outlook to improve. Recently reported Sep '22 quarterly earnings +24% on +28% sales revenues versus the year ago period. It will be dropped from the Featured Stocks list tonight.
>>> FEATURED STOCK ARTICLE : Fourth Straight Loss in Slump Violating 50-Day Moving Average Line - 12/19/2022 |
View all notes |
Set NEW NOTE alert |
Company Profile |
SEC
News |
Chart |
Request a new note
C
A
S
I |
ENPH
-
NASDAQ
Enphase Energy Inc
Energy-Solar
|
$265.49
|
-1.89
-0.71% |
$274.44
|
3,297,896
90.35% of 50 DAV
50 DAV is 3,650,000
|
$339.92
-21.90%
|
10/26/2022
|
$301.55
|
PP = $324.94
|
|
MB = $341.19
|
Most Recent Note - 12/29/2022 3:28:08 PM
Slumped well below its 50 DMA line ($299.49) during a streak of 5 consecutive losses. A rebound above the 50 DMA line is needed for its outlook to improve. It will be dropped from the Featured Stocks list tonight. Fundamentals remain strong.
>>> FEATURED STOCK ARTICLE : Found Support With a Solid Gain at 50-Day Moving Average Line - 12/21/2022 |
View all notes |
Set NEW NOTE alert |
Company Profile |
SEC
News |
Chart |
Request a new note
C
A
S
I |
Symbol/Exchange
Company Name
Industry Group |
PRICE |
CHANGE
(%Change) |
Day High |
Volume
(% DAV)
(% 50 day avg vol) |
52 Wk Hi
% From Hi |
Featured
Date |
Price
Featured |
Pivot Featured |
|
Max Buy |
HRMY
-
NASDAQ
Harmony Biosciences Holdings
Medical-Biomed/Biotech
|
$55.16
|
+1.11
2.05% |
$56.16
|
208,336
45.83% of 50 DAV
50 DAV is 454,600
|
$62.09
-11.16%
|
11/1/2022
|
$55.31
|
PP = $57.23
|
|
MB = $60.09
|
Most Recent Note - 12/29/2022 3:33:34 PM
G - Color code is changed to green after slumping below its 50 DMA line ($56.63). More damaging losses below yesterday's low ($53.39) would raise serious concerns and trigger a worrisome technical sell signal.
>>> FEATURED STOCK ARTICLE : Finding Support Near Prior Highs and 50-Day Moving Average Line - 12/23/2022 |
View all notes |
Set NEW NOTE alert |
Company Profile |
SEC
News |
Chart |
Request a new note
C
A
S
I |
CLH
-
NYSE
Clean Harbors Inc
Pollution Control
|
$115.09
|
+1.95
1.72% |
$115.76
|
193,695
49.92% of 50 DAV
50 DAV is 388,000
|
$125.41
-8.23%
|
11/2/2022
|
$121.59
|
PP = $124.59
|
|
MB = $130.82
|
Most Recent Note - 12/29/2022 3:20:39 PM
It will be dropped from the Featured Stocks list tonight. A rebound above the 50 DMA line ($117) is needed for its outlook to improve. Fundamentals remain strong.
>>> FEATURED STOCK ARTICLE : Volume-Driven Losses Undercut 50-Day Moving Average - 11/29/2022 |
View all notes |
Set NEW NOTE alert |
Company Profile |
SEC
News |
Chart |
Request a new note
C
A
S
I |
GFF
-
NYSE
Griffon Corporation
MATERIALS and CONSTRUCTION - General Building Materials
|
$34.80
|
+0.12
0.35% |
$35.40
|
470,349
113.61% of 50 DAV
50 DAV is 414,000
|
$37.69
-7.67%
|
11/10/2022
|
$34.13
|
PP = $35.02
|
|
MB = $36.77
|
Most Recent Note - 12/29/2022 3:30:10 PM
Y - Slumping near prior highs in the $34 area and its 50 DMA line ($33.98) defining important near-term support. Reported Sep '22 quarterly earnings +230% on +24% sales revenues versus the year ago period.
>>> FEATURED STOCK ARTICLE : No Meaningful Progress After Breakout 3 Weeks Ago - 12/7/2022 |
View all notes |
Set NEW NOTE alert |
Company Profile |
SEC
News |
Chart |
Request a new note
C
A
S
I |
CPRX
-
NASDAQ
Catalyst Pharma Inc
Medical-Biomed/Biotech
|
$18.34
|
+0.21
1.16% |
$19.00
|
1,613,153
67.78% of 50 DAV
50 DAV is 2,380,000
|
$19.78
-7.28%
|
11/22/2022
|
$17.38
|
PP = $16.66
|
|
MB = $17.49
|
Most Recent Note - 12/29/2022 3:25:06 PM
G - Volume totals have been cooling while consolidating above its "max buy" level. Found prompt support near the prior high and well above its 50 DMA line ($15.99).
>>> FEATURED STOCK ARTICLE : Powerful Rally to New High for Catalyst - 12/20/2022 |
View all notes |
Set NEW NOTE alert |
Company Profile |
SEC
News |
Chart |
Request a new note
C
A
S
I |
TITN
-
NASDAQ
Titan Machinery Inc
SPECIALTY RETAIL
|
$39.84
|
+0.61
1.55% |
$40.17
|
114,736
54.12% of 50 DAV
50 DAV is 212,000
|
$44.35
-10.17%
|
11/30/2022
|
$40.10
|
PP = $38.68
|
|
MB = $40.61
|
Most Recent Note - 12/29/2022 3:35:52 PM
Y - Found support when recently consolidating near the prior high in the $38 area which defines initial support to watch above its 50 DMA line ($36.57). Fundamentals remain strong after reporting Oct '22 quarterly earnings +91% on +47% sales revenues.
>>> FEATURED STOCK ARTICLE : Gap Up and Big Volume-Driven Breakout Gain - 11/30/2022 |
View all notes |
Set NEW NOTE alert |
Company Profile |
SEC
News |
Chart |
Request a new note
C
A
S
I |
Symbol/Exchange
Company Name
Industry Group |
PRICE |
CHANGE
(%Change) |
Day High |
Volume
(% DAV)
(% 50 day avg vol) |
52 Wk Hi
% From Hi |
Featured
Date |
Price
Featured |
Pivot Featured |
|
Max Buy |
MYE
-
NYSE
Myers Industries Inc
Containers/Packaging
|
$22.61
|
+0.34
1.53% |
$22.72
|
79,776
47.20% of 50 DAV
50 DAV is 169,000
|
$25.55
-11.51%
|
12/8/2022
|
$23.94
|
PP = $25.65
|
|
MB = $26.93
|
Most Recent Note - 12/29/2022 3:34:16 PM
Y - Still faces resistance due to overhead supply up to the $25.50 level. Disciplined investors will note that it has failed thus far to produce the gains above the pivot point backed by at least +40% above average volume necessary to trigger a technical buy signal.
>>> FEATURED STOCK ARTICLE : Myers Industries on Track for 9th Straight Weekly Gain - 12/8/2022 |
View all notes |
Set NEW NOTE alert |
Company Profile |
SEC
News |
Chart |
Request a new note
C
A
S
I |
BOX
-
NYSE
Box Inc Cl A
Computer Sftwr-Database
|
$31.40
|
+1.01
3.32% |
$31.49
|
869,103
77.53% of 50 DAV
50 DAV is 1,121,000
|
$33.04
-4.96%
|
12/12/2022
|
$29.83
|
PP = $29.57
|
|
MB = $31.05
|
Most Recent Note - 12/29/2022 3:16:59 PM
G - Still consolidating in a tight range near its "max buy" level. Faces little very resistance due to overhead supply up to the $33 level. Quarterly and annual earnings increases have been strong and steady.
>>> FEATURED STOCK ARTICLE : Volume Heavy Behind Breakout for Box Inc - 12/12/2022 |
View all notes |
Set NEW NOTE alert |
Company Profile |
SEC
News |
Chart |
Request a new note
C
A
S
I |
STRL
-
NASDAQ
Sterling Infrastructure
MATERIALS and; CONSTRUCTION - Heavy Construction
|
$32.66
|
+0.54
1.68% |
$32.82
|
103,867
52.72% of 50 DAV
50 DAV is 197,000
|
$33.62
-2.86%
|
12/14/2022
|
$32.41
|
PP = $33.72
|
|
MB = $35.41
|
Most Recent Note - 12/29/2022 3:35:07 PM
Y - Perched within striking distance of its 52-week high. Highlighted in yellow with pivot point cited based on its 11/08/22 high plus 10 cents in the 12/14/22 mid-day report. Faces very little resistance due to overhead supply. Subsequent gains above the pivot point backed by at least +40% above average volume are needed to trigger a proper technical buy signal.
>>> FEATURED STOCK ARTICLE : Sterling Infrastructure Forming Orderly Base Pattern - 12/14/2022 |
View all notes |
Set NEW NOTE alert |
Company Profile |
SEC
News |
Chart |
Request a new note
C
A
S
I |
|
|
|
THESE ARE NOT BUY RECOMMENDATIONS!
Comments contained in the body of this report are technical
opinions only. The material herein has been obtained
from sources believed to be reliable and accurate, however,
its accuracy and completeness cannot be guaranteed.
This site is not an investment advisor, hence it does
not endorse or recommend any securities or other investments.
Any recommendation contained in this report may not
be suitable for all investors and it is not to be deemed
an offer or solicitation on our part with respect to
the purchase or sale of any securities. All trademarks,
service marks and trade names appearing in this report
are the property of their respective owners, and are
likewise used for identification purposes only.
This report is a service available
only to active Paid Premium Members.
You may opt-out of receiving report notifications
at any time. Questions or comments may be submitted
by writing to Premium Membership Services 665 S.E. 10 Street, Suite 201 Deerfield Beach, FL 33441-5634 or by calling 1-800-965-8307
or 954-785-1121.
|
|
|


