You are not logged in.
This means you
CAN ONLY VIEW reports that were published prior to Tuesday, March 25, 2025.
You
MUST UPGRADE YOUR MEMBERSHIP if you want to see any current reports.
AFTER MARKET UPDATE - FRIDAY, DECEMBER 30TH, 2022
Previous After Market Report Next After Market Report >>>
|
|
|
|
DOW |
-73.55 |
33,147.25 |
-0.22% |
|
Volume |
756,584,200 |
+11% |
|
Volume |
3,903,776,500 |
-5% |
|
NASDAQ |
-11.61 |
10,466.48 |
-0.11% |
|
Advancers |
1,345 |
45% |
|
Advancers |
2,224 |
48% |
|
S&P 500 |
-9.78 |
3,839.50 |
-0.25% |
|
Decliners |
1,649 |
55% |
|
Decliners |
2,370 |
52% |
|
Russell 2000 |
-5.00 |
1,761.25 |
-0.28% |
|
52 Wk Highs |
49 |
|
|
52 Wk Highs |
101 |
|
|
S&P 600 |
-5.21 |
1,157.53 |
-0.45% |
|
52 Wk Lows |
72 |
|
|
52 Wk Lows |
181 |
|
|
The market is in a correction (M criteria). Thin leadership was a recent warning sign as weakness in the major averages was noted. Disciplined investors know to avoid new buying, reduce exposure and raise cash until a new confirmed rally with a solid follow-through day is noted.
|
 |
Major Averages Finish a Tough Year Still Sputtering
Kenneth J. Gruneisen - Passed the CAN SLIM® Master's Exam
The Dow lost 73 points, while the Nasdaq Composite declined 0.1%. The S&P 500 decreased 0.3%. Volume totals were mixed, higher than the prior session on the NYSE and lighter on the Nasdaq exchange. Decliners narrowly led advancers on the NYSE and on the Nasdaq exchange. There were 5 high-ranked companies from the Leaders List that hit new 52-week highs and were listed on the BreakOuts Page matching the total of 5 on the prior session. New 52-week lows outnumbered new 52-week highs totals on the NYSE and on the Nasdaq exchange. The market is in a correction (M criteria). Disciplined investors know to avoid new buying, reduce exposure and raise cash until a new confirmed rally with a solid follow-through day is noted.
Chart courtesy of www.stockcharts.com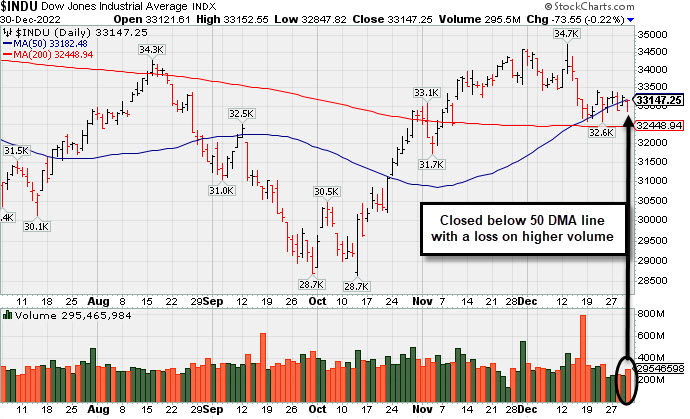 PICTURED: The Dow Jones Industrial Average closed below its 50-day moving average (DMA) line with a loss on higher volume.
U.S. equities finished in the red Friday, snapping a three-year winning streak, as investors continue to forecast an inevitable recession in 2023. Nine of the 11 sectors in the S&P 500 finished the week in negative territory, with Materials leading laggards. Wrapping up 2022, Energy was the only sector to obtain a yearly gain with a 59% return while Communication Services was the biggest laggard with a 40% loss.
On the data front, December’s MNI Chicago Purchasing Managers’ Index (PMI) came in 4.9 points higher than the forecasted 40, improving from November’s 37.2 print. However, a reading under 50 still indicates the economy is still in a contractionary state.
Treasury yields edge higher Friday as investors look to wrap up the worst year for Treasuries ever recorded. The yield on the 10-year note added 4 basis points (0.04%) to 3.87% after starting the year around 1.5%, while the 30-year bond yield increased 5 basis points (0.05%) to 3.96%. The two-year note yield gained seven basis points (0.07%) to 4.43%. In commodities, West Texas Intermediate (WTI) crude climbed 2.5% to $80.37/barrel on Friday to finish the year with its second straight annual gain after a volatile year of tight supplies due to the Russia/Ukraine war, weakening demand from top importers, and fears over a gloomy economic contraction. In the metals complex, Gold increased 0.2% Friday to end the fourth quarter with its best quarterly performance since June 2020.
|
 Kenneth J. Gruneisen started out as a licensed stockbroker in August 1987, a couple of months prior to the historic stock market crash that took the Dow Jones Industrial Average down -22.6% in a single day. He has published daily fact-based fundamental and technical analysis on high-ranked stocks online for two decades. Through FACTBASEDINVESTING.COM, Kenneth provides educational articles, news, market commentary, and other information regarding proven investment systems that work in good times and bad.
Comments contained in the body of this report are technical opinions only and are not necessarily those of Gruneisen Growth Corp. The material herein has been obtained from sources believed to be reliable and accurate, however, its accuracy and completeness cannot be guaranteed. Our firm, employees, and customers may effect transactions, including transactions contrary to any recommendation herein, or have positions in the securities mentioned herein or options with respect thereto. Any recommendation contained in this report may not be suitable for all investors and it is not to be deemed an offer or solicitation on our part with respect to the purchase or sale of any securities. |
|
 |
Energy Indexes Edged Higher on Mostly Quiet Session
Kenneth J. Gruneisen - Passed the CAN SLIM® Master's Exam
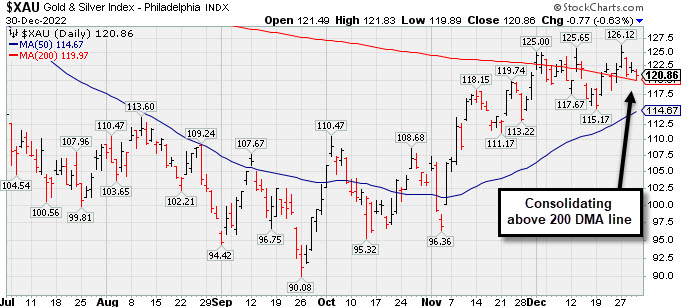
Modest losses for the Retail Index ($RLX -0.53%), Broker/Dealer Index ($XBD -0.45%), and Bank Index ($BKX -0.17%) created a drag on the major averages. The tech sector was indecisive as the Semiconductor Index ($SOX -0.11%), Biotech Index ($BTK +0.07%), and Networking Index ($NWX +0.08%) all were little changed. The Oil Services Index ($OSX +0.53%) and Integrated Oil Index ($XOI +0.53%) both posted small gains while the Gold & Silver Index ($XAU -0.63%) edged lower.
PICTURED: The Gold & Silver Index ($XAU -0.63%) is consolidating above its 200-day moving average (DMA) line.
| Oil Services |
$OSX |
83.86 |
+0.44 |
+0.53% |
+59.06% |
| Integrated Oil |
$XOI |
1,787.25 |
+9.48 |
+0.53% |
+51.69% |
| Semiconductor |
$SOX |
2,532.11 |
-2.83 |
-0.11% |
-35.83% |
| Networking |
$NWX |
783.31 |
+0.61 |
+0.08% |
-19.34% |
| Broker/Dealer |
$XBD |
449.13 |
-2.03 |
-0.45% |
-7.75% |
| Retail |
$RLX |
2,754.00 |
-14.63 |
-0.53% |
-34.84% |
| Gold & Silver |
$XAU |
120.86 |
-0.77 |
-0.63% |
-8.75% |
| Bank |
$BKX |
100.85 |
-0.17 |
-0.17% |
-23.72% |
| Biotech |
$BTK |
5,281.01 |
+3.85 |
+0.07% |
-4.30% |
|
|
|
 |
Found Support Near Prior High Following Breakout
Kenneth J. Gruneisen - Passed the CAN SLIM® Master's Exam
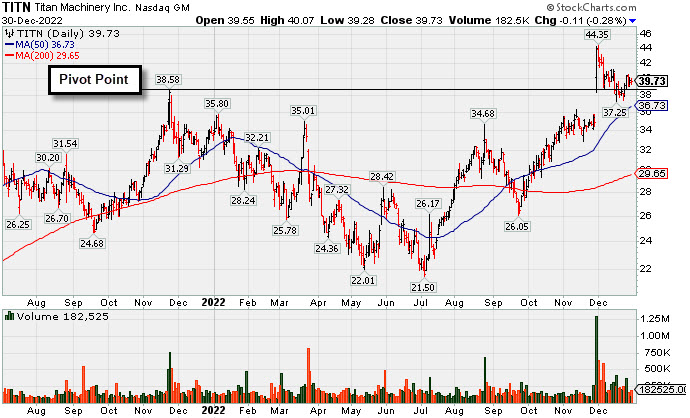
Titan Machinery Inc (TITN -$0.11 or -0.28% to $39.73) recently found support when consolidating near the prior high in the $38 area. The next important support to watch is its 50-day moving average (DMA) line ($36.73).
Fundamentals remain strong after reporting Oct '22 quarterly earnings +91% on +47% sales revenues. It currently has the highest possible earnings Per Share Rating of 99. Following years of losses it has shown strong earnings growth for FY '19-22. TITN was highlighted in yellow with pivot point cited based on its 11/23/21 high plus 10 cents in the 11/30/22 mid-day report (read here). It was shown in greater detail that evening with an annotated graph under the headline, "Gap Up and Big Volume-Driven Breakout Gain".
The small supply of only 22.7 million shares outstanding (S criteria) can contribute to greater price volatility in the event of institutional buying or selling. The number of top-rated funds owning its shares rose from 241 in Dec '20 to 348 in Sep '22, a reassuring sign concerning the I criteria. Its current Up/Down Volume Ratio of 1.2 is an unbiased indication its shares have been under slight accumulation over the past 50 days.
|
|
|
Color Codes Explained :
Y - Better candidates highlighted by our
staff of experts.
G - Previously featured
in past reports as yellow but may no longer be buyable under the
guidelines.
***Last / Change / Volume data in this table is the closing quote data***
Symbol/Exchange
Company Name
Industry Group |
PRICE |
CHANGE
(%Change) |
Day High |
Volume
(% DAV)
(% 50 day avg vol) |
52 Wk Hi
% From Hi |
Featured
Date |
Price
Featured |
Pivot Featured |
|
Max Buy |
 CMC
-
NYSE
CMC
-
NYSE
Commercial Metals Co
METALS and MINING - Steel and Iron
|
$48.30
|
-0.46
-0.94% |
$48.80
|
740,080
74.31% of 50 DAV
50 DAV is 996,000
|
$50.83
-4.98%
|
10/14/2022
|
$41.61
|
PP = $44.45
|
|
MB = $46.67
|
Most Recent Note - 12/29/2022 3:21:50 PM
G - Volume totals have been cooling while consolidating above its 50 DMA line ($47.17) and prior highs in the $46 area defining important near-term support to watch. Fundamentals remain strong.
>>> FEATURED STOCK ARTICLE : Wedging Higher With Recent Gains Lacking Great Volume - 12/2/2022 |
View all notes |
Set NEW NOTE alert |
Company Profile |
SEC
News |
Chart |
Request a new note
C
A
S
I |
GPK
-
NYSE
Graphic Packaging Hldg
CONSUMER NON-DURABLES - Packaging and Containers
|
$22.25
|
-0.09
-0.40% |
$22.28
|
1,561,806
50.41% of 50 DAV
50 DAV is 3,098,000
|
$24.07
-7.56%
|
10/25/2022
|
$22.75
|
PP = $24.17
|
|
MB = $25.38
|
 Most Recent Note - 12/30/2022 5:05:53 PM
G - Volume totals have been cooling while consolidating below its 50 DMA line ($22.35). Faces resistance due to overhead supply up to the $24 level. Fundamentals remain strong.
>>> FEATURED STOCK ARTICLE : Violated 50-Day Moving Average After Recently Failing to Break Out - 12/15/2022 |
View all notes |
Set NEW NOTE alert |
Company Profile |
SEC
News |
Chart |
Request a new note
C
A
S
I |
HRMY
-
NASDAQ
Harmony Biosciences Holdings
Medical-Biomed/Biotech
|
$55.10
|
-0.06
-0.11% |
$55.11
|
408,929
283.00% of 50 DAV
50 DAV is 144,500
|
$62.09
-11.26%
|
11/1/2022
|
$55.31
|
PP = $57.23
|
|
MB = $60.09
|
Most Recent Note - 12/30/2022 11:58:04 AM
G - Color code was changed to green after slumping below its 50 DMA line ($56.70). A rebound above the 50 DMA line is needed for its outlook to improve. More damaging losses below the 12/28/22 low ($53.79) would raise concerns and trigger a worrisome technical sell signal.
>>> FEATURED STOCK ARTICLE : Finding Support Near Prior Highs and 50-Day Moving Average Line - 12/23/2022 |
View all notes |
Set NEW NOTE alert |
Company Profile |
SEC
News |
Chart |
Request a new note
C
A
S
I |
GFF
-
NYSE
Griffon Corporation
MATERIALS and CONSTRUCTION - General Building Materials
|
$35.79
|
+0.99
2.84% |
$35.97
|
657,632
158.08% of 50 DAV
50 DAV is 416,000
|
$37.69
-5.04%
|
11/10/2022
|
$34.13
|
PP = $35.02
|
|
MB = $36.77
|
Most Recent Note - 12/30/2022 5:04:57 PM
Y - Posted a gain with above average volume finding support near prior highs in the $34 area and its 50 DMA line ($34.10) defining important near-term support. Reported Sep '22 quarterly earnings +230% on +24% sales revenues versus the year ago period.
>>> FEATURED STOCK ARTICLE : No Meaningful Progress After Breakout 3 Weeks Ago - 12/7/2022 |
View all notes |
Set NEW NOTE alert |
Company Profile |
SEC
News |
Chart |
Request a new note
C
A
S
I |
CPRX
-
NASDAQ
Catalyst Pharma Inc
Medical-Biomed/Biotech
|
$18.60
|
+0.26
1.42% |
$18.60
|
1,209,766
50.68% of 50 DAV
50 DAV is 2,387,000
|
$19.78
-5.97%
|
11/22/2022
|
$17.38
|
PP = $16.66
|
|
MB = $17.49
|
Most Recent Note - 12/30/2022 5:03:31 PM
G - Volume totals have been cooling while consolidating above its "max buy" level. Found prompt support near the prior high and well above its 50 DMA line ($16.11).
>>> FEATURED STOCK ARTICLE : Powerful Rally to New High for Catalyst - 12/20/2022 |
View all notes |
Set NEW NOTE alert |
Company Profile |
SEC
News |
Chart |
Request a new note
C
A
S
I |
Symbol/Exchange
Company Name
Industry Group |
PRICE |
CHANGE
(%Change) |
Day High |
Volume
(% DAV)
(% 50 day avg vol) |
52 Wk Hi
% From Hi |
Featured
Date |
Price
Featured |
Pivot Featured |
|
Max Buy |
TITN
-
NASDAQ
Titan Machinery Inc
SPECIALTY RETAIL
|
$39.73
|
-0.11
-0.28% |
$40.07
|
182,514
86.09% of 50 DAV
50 DAV is 212,000
|
$44.35
-10.42%
|
11/30/2022
|
$40.10
|
PP = $38.68
|
|
MB = $40.61
|
Most Recent Note - 12/30/2022 5:02:14 PM
Y - Found support when recently consolidating near the prior high in the $38 area which defines initial support to watch above its 50 DMA line ($36.73). Fundamentals remain strong after reporting Oct '22 quarterly earnings +91% on +47% sales revenues. See the latest FSU analysis for more details and a new annotated graph.
>>> FEATURED STOCK ARTICLE : Found Support Near Prior High Following Breakout - 12/30/2022 |
View all notes |
Set NEW NOTE alert |
Company Profile |
SEC
News |
Chart |
Request a new note
C
A
S
I |
MYE
-
NYSE
Myers Industries Inc
Containers/Packaging
|
$22.23
|
-0.38
-1.68% |
$22.47
|
92,845
55.26% of 50 DAV
50 DAV is 168,000
|
$25.55
-12.99%
|
12/8/2022
|
$23.94
|
PP = $25.65
|
|
MB = $26.93
|
Most Recent Note - 12/30/2022 5:07:29 PM
Y - Pulled back near its 50 DMA line ($21.75) with a loss on light volume. Still faces resistance due to overhead supply up to the $25.50 level. Disciplined investors will note that it has failed thus far to produce the gains above the pivot point backed by at least +40% above average volume necessary to trigger a technical buy signal.
>>> FEATURED STOCK ARTICLE : Myers Industries on Track for 9th Straight Weekly Gain - 12/8/2022 |
View all notes |
Set NEW NOTE alert |
Company Profile |
SEC
News |
Chart |
Request a new note
C
A
S
I |
BOX
-
NYSE
Box Inc Cl A
Computer Sftwr-Database
|
$31.13
|
-0.27
-0.86% |
$31.32
|
1,042,481
93.50% of 50 DAV
50 DAV is 1,115,000
|
$33.04
-5.78%
|
12/12/2022
|
$29.83
|
PP = $29.57
|
|
MB = $31.05
|
Most Recent Note - 12/29/2022 3:16:59 PM
G - Still consolidating in a tight range near its "max buy" level. Faces little very resistance due to overhead supply up to the $33 level. Quarterly and annual earnings increases have been strong and steady.
>>> FEATURED STOCK ARTICLE : Volume Heavy Behind Breakout for Box Inc - 12/12/2022 |
View all notes |
Set NEW NOTE alert |
Company Profile |
SEC
News |
Chart |
Request a new note
C
A
S
I |
STRL
-
NASDAQ
Sterling Infrastructure
MATERIALS and; CONSTRUCTION - Heavy Construction
|
$32.80
|
+0.14
0.43% |
$32.99
|
119,416
60.93% of 50 DAV
50 DAV is 196,000
|
$33.62
-2.44%
|
12/14/2022
|
$32.41
|
PP = $33.72
|
|
MB = $35.41
|
Most Recent Note - 12/30/2022 5:08:31 PM
Y - Volume totals have been cooling while hovering in a tight range near its 52-week high. Highlighted in yellow with pivot point cited based on its 11/08/22 high plus 10 cents in the 12/14/22 mid-day report. Faces very little resistance due to overhead supply. Subsequent gains above the pivot point backed by at least +40% above average volume are needed to trigger a proper technical buy signal.
>>> FEATURED STOCK ARTICLE : Sterling Infrastructure Forming Orderly Base Pattern - 12/14/2022 |
View all notes |
Set NEW NOTE alert |
Company Profile |
SEC
News |
Chart |
Request a new note
C
A
S
I |
|
|
|
THESE ARE NOT BUY RECOMMENDATIONS!
Comments contained in the body of this report are technical
opinions only. The material herein has been obtained
from sources believed to be reliable and accurate, however,
its accuracy and completeness cannot be guaranteed.
This site is not an investment advisor, hence it does
not endorse or recommend any securities or other investments.
Any recommendation contained in this report may not
be suitable for all investors and it is not to be deemed
an offer or solicitation on our part with respect to
the purchase or sale of any securities. All trademarks,
service marks and trade names appearing in this report
are the property of their respective owners, and are
likewise used for identification purposes only.
This report is a service available
only to active Paid Premium Members.
You may opt-out of receiving report notifications
at any time. Questions or comments may be submitted
by writing to Premium Membership Services 665 S.E. 10 Street, Suite 201 Deerfield Beach, FL 33441-5634 or by calling 1-800-965-8307
or 954-785-1121.
|
|
|