You are not logged in.
This means you
CAN ONLY VIEW reports that were published prior to Saturday, April 5, 2025.
You
MUST UPGRADE YOUR MEMBERSHIP if you want to see any current reports.
AFTER MARKET UPDATE - MONDAY, NOVEMBER 7TH, 2022
Previous After Market Report Next After Market Report >>>
|
|
|
|
DOW |
+423.78 |
32,827.00 |
+1.31% |
|
Volume |
917,886,415 |
-16% |
|
Volume |
4,430,237,700 |
-18% |
|
NASDAQ |
+89.27 |
10,564.52 |
+0.85% |
|
Advancers |
1,939 |
63% |
|
Advancers |
2,506 |
55% |
|
S&P 500 |
+36.25 |
3,806.80 |
+0.96% |
|
Decliners |
1,117 |
37% |
|
Decliners |
2,082 |
45% |
|
Russell 2000 |
+9.94 |
1,809.81 |
+0.55% |
|
52 Wk Highs |
79 |
|
|
52 Wk Highs |
100 |
|
|
S&P 600 |
+11.47 |
1,182.83 |
+0.98% |
|
52 Wk Lows |
145 |
|
|
52 Wk Lows |
272 |
|
|
 |
Major Indices Notched Gains With Lighter Volume Totals
Kenneth J. Gruneisen - Passed the CAN SLIM® Master's Exam
The Dow added 423 points, while the Nasdaq Composite climbed 0.9%. The S&P 500 jumped 1%. The volume totals reported were lighter than the prior session on the NYSE and on the Nasdaq exchange, indicative of lackluster institutional buying demand. Breadth was positive as advancers led decliners by almost a 2-1 margin on the NYSE and by about a 5-4 margin on the Nasdaq exchange. There were 54 high-ranked companies from the Leaders List that hit new 52-week highs and were listed on the BreakOuts Page, versus the total of 56 on the prior session. New 52-week lows totals again outnumbered new 52-week highs on the NYSE and on the Nasdaq exchange. The market is in a confirmed uptrend that recently has come under pressure (M criteria). Healthy leadership (new 52-week highs totals) will be essential in the near-term for the rally to be productive. Only stocks meeting all key-criteria of the fact-based investment system should be considered as buy candidates.
Chart courtesy of www.stockcharts.com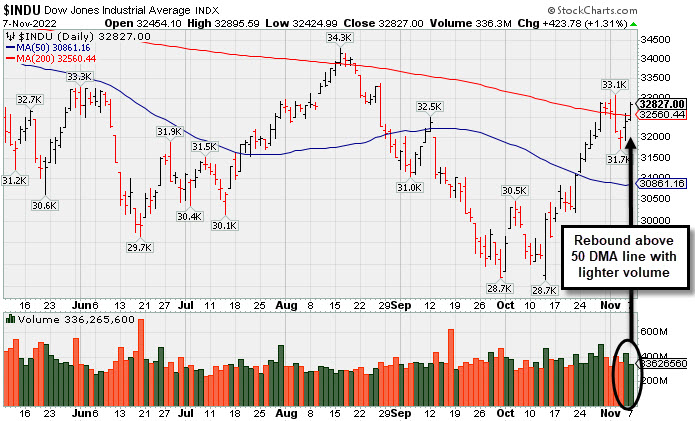 PICTURED: The Dow Jones Industrial Average rebounded above its 50-day moving average (DMA) line with a gain backed by lighter volume.
U.S. equities finished higher Monday to extend Friday’s rally. Trading was volatile throughout the session as investors turned their attention to the midterm elections and October’s inflation report. Eight of 11 S&P 500 sectors finished in positive territory, with Communication Services and Energy pacing gains.
On the data front, all eyes are turned towards the October Consumer Price Index (CPI) report due Thursday morning. The headline figure is expected to come in at 7.9% year-over-year after notching an 8.2% annual gain in September. In corporate news, Apple Inc (AAPL +0.39%) eked out a small gain despite announcing iPhone production has been temporarily reduced amid renewed COVID-19 restrictions in China. Meta Platforms Inc (META +6.53%) rose following reports they will begin large-scale layoffs soon. Carvana Co (CVNA -15.64%) fell after needing to briefly halt trading due to outsized volatility. The decline came after the company had their worst day ever on Friday.
Treasuries weakened, with the yield on the benchmark 10-year note climbing five basis points (0.05%) to 4.22%, while the 30-year bond yield advanced six basis points (0.06%) to 4.33%. The yield on the more policy-sensitive two-year note increased by six basis points (0.06%) to 4.72%. In commodities, West Texas Intermediate (WTI) crude reversed earlier gains to fall 0.7% to $91.93/barrel as market participants weigh a softening U.S. dollar against uncertainty over the future path of China’s zero-COVID policy. The U.S. Dollar Index slid 0.6% as a perceived risk-on mood took hold. |
 Kenneth J. Gruneisen started out as a licensed stockbroker in August 1987, a couple of months prior to the historic stock market crash that took the Dow Jones Industrial Average down -22.6% in a single day. He has published daily fact-based fundamental and technical analysis on high-ranked stocks online for two decades. Through FACTBASEDINVESTING.COM, Kenneth provides educational articles, news, market commentary, and other information regarding proven investment systems that work in good times and bad.
Comments contained in the body of this report are technical opinions only and are not necessarily those of Gruneisen Growth Corp. The material herein has been obtained from sources believed to be reliable and accurate, however, its accuracy and completeness cannot be guaranteed. Our firm, employees, and customers may effect transactions, including transactions contrary to any recommendation herein, or have positions in the securities mentioned herein or options with respect thereto. Any recommendation contained in this report may not be suitable for all investors and it is not to be deemed an offer or solicitation on our part with respect to the purchase or sale of any securities. |
|
 |
Financial, Retail, Tech and Commodity-Linked Groups Rose
Kenneth J. Gruneisen - Passed the CAN SLIM® Master's Exam
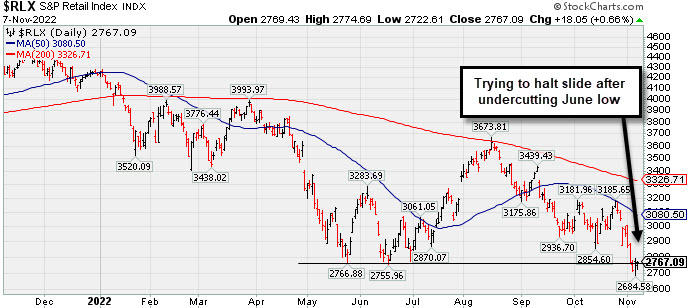
The Bank Index ($BKX +0.70%), Broker/Dealer Index ($XBD +0.68%), and Retail Index ($RLX +0.66%) each posted a small gain. Commodity-linked groups also had a positive bias as the Oil Services Index ($OSX +2.88%) and Integrated Oil Index ($XOI +1.46%) both outpaced the Gold & Silver Index ($XAU +0.32%). The Semiconductor Index ($SOX +2.18%) led the tech sector while the Biotech Index ($BTK +0.66%) posted a smaller gain but the Networking Index ($NWX -0.07%) finished flat.
PICTURED: The Retail Index ($RLX +0.66%) has been trying to halt its slide after undercutting the June low.
| Oil Services |
$OSX |
87.36 |
+2.45 |
+2.88% |
+65.70% |
| Integrated Oil |
$XOI |
1,914.26 |
+27.61 |
+1.46% |
+62.47% |
| Semiconductor |
$SOX |
2,450.62 |
+52.39 |
+2.18% |
-37.90% |
| Networking |
$NWX |
786.31 |
-0.52 |
-0.07% |
-19.03% |
| Broker/Dealer |
$XBD |
473.96 |
+3.18 |
+0.68% |
-2.65% |
| Retail |
$RLX |
2,767.09 |
+18.05 |
+0.66% |
-34.53% |
| Gold & Silver |
$XAU |
106.64 |
+0.34 |
+0.32% |
-19.48% |
| Bank |
$BKX |
104.64 |
+0.73 |
+0.70% |
-20.86% |
| Biotech |
$BTK |
4,963.07 |
+32.57 |
+0.66% |
-10.06% |
|
|
|
 |
Steel/Metal Products Firm Quietly Perched Near All Time High
Kenneth J. Gruneisen - Passed the CAN SLIM® Master's Exam
Commercial Metals Co (CMC -$0.14 or -0.31% to $45.70) ended with a small loss on light volume today. On the prior session with lighter than average volume it just touched a new 52-week high. Recent gains have lacked volume as it has been wedging upward. Additional volume-driven gains would be a reassuring sign of fresh institutional buying demand lurking.
Recently CMC reported Aug '22 quarterly earnings +94% on +19% sales revenues versus the year ago period and prior quarterly comparisons were well above the +25% minimum earnings guideline (C criteria) of the fact-based investment system. Annual earnings growth has been strong. It hails from the Metal Proc & Fabrication group which is currently ranked 24th on the 197 Industry Groups list (L criteria).
The company has 117.3 million shares outstanding (S criteria). The number of top-rated funds owning its shares rose from 586 in Dec '21 to 628 in Sep '22. Its current Up/Down Volume Ratio of 1.1 is an unbiased indication its shares have been under slight accumulation over the past 50 days. It has a Timeliness Rating of A and a Sponsorship Rating of B.
|
|
|
Color Codes Explained :
Y - Better candidates highlighted by our
staff of experts.
G - Previously featured
in past reports as yellow but may no longer be buyable under the
guidelines.
***Last / Change / Volume data in this table is the closing quote data***
Symbol/Exchange
Company Name
Industry Group |
PRICE |
CHANGE
(%Change) |
Day High |
Volume
(% DAV)
(% 50 day avg vol) |
52 Wk Hi
% From Hi |
Featured
Date |
Price
Featured |
Pivot Featured |
|
Max Buy |
 CI
-
NYSE
CI
-
NYSE
Cigna Corp
Medical-Managed Care
|
$324.37
|
+2.24
0.70% |
$327.37
|
1,497,769
74.89% of 50 DAV
50 DAV is 2,000,000
|
$327.00
-0.80%
|
7/7/2022
|
$276.55
|
PP = $273.68
|
|
MB = $287.36
|
Most Recent Note - 11/3/2022 5:08:22 PM
G - Reported Sep '22 quarterly earnings +5% after the close. Perched at its all-time high. Its 50 DMA line ($292.28) defines near-term support to watch. Volume and volatility often increase near earnings news. See the latest FSU analysis for more details and a new annotated graph.
>>> FEATURED STOCK ARTICLE : Cigna Reported Earnings Perched at High - 11/3/2022 |
View all notes |
Set NEW NOTE alert |
Company Profile |
SEC
News |
Chart |
Request a new note
C
A
S
I |
ESQ
-
NASDAQ
Esquire Financial Hldgs
Finance-Commercial Loans
|
$45.46
|
-1.79
-3.79% |
$47.11
|
31,383
112.08% of 50 DAV
50 DAV is 28,000
|
$48.13
-5.55%
|
10/18/2022
|
$40.02
|
PP = $39.95
|
|
MB = $41.95
|
 Most Recent Note - 11/7/2022 5:18:32 PM
G - Pulled back with near average volume today, retreating from a new 52-week high hit on the prior session. It has been noted as extended from the previously noted base. Prior highs in the $41 area define initial support to watch above its 50 DMA line ($39.48).
>>> FEATURED STOCK ARTICLE : New High With 6th Consecutive Volume-Driven Gain - 10/31/2022 |
View all notes |
Set NEW NOTE alert |
Company Profile |
SEC
News |
Chart |
Request a new note
C
A
S
I |
CCRN
-
NASDAQ
Cross Country Healthcare
DIVERSIFIED SERVICES - Staffing and Outsourcing Service
|
$33.45
|
+0.95
2.92% |
$34.36
|
1,043,746
115.33% of 50 DAV
50 DAV is 905,000
|
$38.68
-13.52%
|
9/9/2022
|
$27.32
|
PP = $30.61
|
|
MB = $32.14
|
Most Recent Note - 11/4/2022 5:32:15 PM
G - Suffered a damaging volume-driven loss, abruptly retreating from its new all-time high nearly falling to its "max buy" level. Reported Sep '22 quarterly earnings +75% on +70% sales revenues versus the year ago period. Prior highs in the $30.50 area define important near-term support to watch along with its 50 DMA line ($30.77).
>>> FEATURED STOCK ARTICLE : Healthcare Staffing Firm Hovering Near All-Time High - 10/17/2022 |
View all notes |
Set NEW NOTE alert |
Company Profile |
SEC
News |
Chart |
Request a new note
C
A
S
I |
CMC
-
NYSE
Commercial Metals Co
METALS and MINING - Steel and Iron
|
$45.70
|
-0.14
-0.31% |
$46.64
|
659,593
63.12% of 50 DAV
50 DAV is 1,045,000
|
$46.85
-2.45%
|
10/14/2022
|
$41.61
|
PP = $44.45
|
|
MB = $46.67
|
Most Recent Note - 11/7/2022 5:37:32 PM
Y - Pulled back today with lighter than average volume after touching a new 52-week high on the prior session while recently wedging higher. Fundamentals remain strong. See the latest FSU analysis for more details and a new annotated graph.
>>> FEATURED STOCK ARTICLE : Steel/Metal Products Firm Quietly Perched Near All Time High - 11/7/2022 |
View all notes |
Set NEW NOTE alert |
Company Profile |
SEC
News |
Chart |
Request a new note
C
A
S
I |
VRTX
-
NASDAQ
Vertex Pharmaceuticals
Medical-Biomed/Biotech
|
$303.23
|
-5.59
-1.81% |
$308.80
|
1,515,778
107.35% of 50 DAV
50 DAV is 1,412,000
|
$316.48
-4.19%
|
10/24/2022
|
$308.47
|
PP = $306.05
|
|
MB = $321.35
|
Most Recent Note - 11/7/2022 5:22:52 PM
Y - Pulled back today with near average volume. Its 50 DMA line ($293.81) defines near-term support . Recently reported Sep '22 quarterly earnings +14% on +18% sales revenues versus the year ago period, below the +25% minimum earnings guideline raising concerns (C criteria). Annual earnings (A criteria) history has been strong.
>>> FEATURED STOCK ARTICLE : Volume-Driven Gain Triggered Technical Buy Signal - 10/24/2022 |
View all notes |
Set NEW NOTE alert |
Company Profile |
SEC
News |
Chart |
Request a new note
C
A
S
I |
Symbol/Exchange
Company Name
Industry Group |
PRICE |
CHANGE
(%Change) |
Day High |
Volume
(% DAV)
(% 50 day avg vol) |
52 Wk Hi
% From Hi |
Featured
Date |
Price
Featured |
Pivot Featured |
|
Max Buy |
CLFD
-
NASDAQ
Clearfield Inc
TELECOMMUNICATIONS - Cables / Satalite Equipment
|
$90.65
|
-13.95
-13.34% |
$105.21
|
574,751
246.67% of 50 DAV
50 DAV is 233,000
|
$130.01
-30.27%
|
10/25/2022
|
$117.96
|
PP = $130.11
|
|
MB = $136.62
|
Most Recent Note - 11/7/2022 5:13:40 PM
G - Color code is changed to green after today's damaging 6th consecutive loss was backed by higher volume while decisively violating its 50 DMA line ($103) triggering a technical sell signal. Prior low ($88.57) defines near-term support. A rebound above the 50 DMA line is needed for its outlook to improve. Due to report Sep '22 quarterly results. Volume and volatility often increase near earnings news.
>>> FEATURED STOCK ARTICLE : Clearfield Perched -8.6% Off High After Recent Rebound - 10/27/2022 |
View all notes |
Set NEW NOTE alert |
Company Profile |
SEC
News |
Chart |
Request a new note
C
A
S
I |
GPK
-
NYSE
Graphic Packaging Hldg
CONSUMER NON-DURABLES - Packaging and Containers
|
$22.71
|
-0.08
-0.35% |
$22.98
|
2,079,266
74.21% of 50 DAV
50 DAV is 2,802,000
|
$24.07
-5.65%
|
10/25/2022
|
$22.75
|
PP = $24.17
|
|
MB = $25.38
|
Most Recent Note - 11/3/2022 5:13:54 PM
Y - Halted its slide today with a small gain on lighter volume after 5 consecutive losses. Subsequent gains above the pivot point backed by at least +40% above average volume may trigger a technical buy signal. Reported Sep '22 quarterly earnings +79% on +38% sales revenues versus the year ago period.
>>> FEATURED STOCK ARTICLE : Rebound Above 50-Day Moving Average Helped Outlook Improve - 10/25/2022 |
View all notes |
Set NEW NOTE alert |
Company Profile |
SEC
News |
Chart |
Request a new note
C
A
S
I |
CBZ
-
NYSE
C B I Z Inc
Comml Svcs-Consulting
|
$47.13
|
+0.75
1.62% |
$47.24
|
191,626
71.77% of 50 DAV
50 DAV is 267,000
|
$50.57
-6.80%
|
10/26/2022
|
$47.83
|
PP = $48.57
|
|
MB = $51.00
|
Most Recent Note - 11/4/2022 5:38:49 PM
Y - Pulled back today with below average volume for 5th consecutive loss undercutting the prior high in the $48 area raising some concerns. Its 50 DMA line ($45) defines the next important support. Recently reported Sep '22 quarterly earnings +24% on +28% sales revenues versus the year ago period. Volume and volatility often increase near earnings news.
>>> FEATURED STOCK ARTICLE : Earnings Report Due for Commercial Services and Consulting Firm - 10/26/2022 |
View all notes |
Set NEW NOTE alert |
Company Profile |
SEC
News |
Chart |
Request a new note
C
A
S
I |
ENPH
-
NASDAQ
Enphase Energy Inc
Energy-Solar
|
$268.83
|
-13.61
-4.82% |
$283.38
|
3,768,575
94.21% of 50 DAV
50 DAV is 4,000,000
|
$324.84
-17.24%
|
10/26/2022
|
$301.55
|
PP = $324.94
|
|
MB = $341.19
|
Most Recent Note - 11/7/2022 5:16:18 PM
G - Color code is changed to green after a damaging loss today with average volume violated its 50 DMA line ($282.16) triggering a technical sell signal. A rebound above the 50 DMA line is needed for its outlook to improve. Faces resistance due to overhead supply up to the $324 level. Fundamentals remain strong.
>>> FEATURED STOCK ARTICLE : Enphase Energy Rebound Above 50-Day Moving Average Helped Outlook - 10/28/2022 |
View all notes |
Set NEW NOTE alert |
Company Profile |
SEC
News |
Chart |
Request a new note
C
A
S
I |
HRMY
-
NASDAQ
Harmony Biosciences Hldg
Medical-Biomed/Biotech
|
$57.11
|
-1.74
-2.96% |
$59.44
|
480,678
94.81% of 50 DAV
50 DAV is 507,000
|
$60.66
-5.85%
|
11/1/2022
|
$55.31
|
PP = $57.23
|
|
MB = $60.09
|
Most Recent Note - 11/7/2022 5:20:37 PM
Y - Pulled back today with near average volume and closed below is pivot point raising some concerns. Prior highs in the $57 area define initial support to watch on pullbacks.
>>> FEATURED STOCK ARTICLE : Volume Heavy Behind Technical Breakout After Earnings - 11/1/2022 |
View all notes |
Set NEW NOTE alert |
Company Profile |
SEC
News |
Chart |
Request a new note
C
A
S
I |
Symbol/Exchange
Company Name
Industry Group |
PRICE |
CHANGE
(%Change) |
Day High |
Volume
(% DAV)
(% 50 day avg vol) |
52 Wk Hi
% From Hi |
Featured
Date |
Price
Featured |
Pivot Featured |
|
Max Buy |
CLH
-
NYSE
Clean Harbors Inc
Pollution Control
|
$111.44
|
-0.49
-0.44% |
$113.33
|
392,849
90.73% of 50 DAV
50 DAV is 433,000
|
$124.49
-10.48%
|
11/2/2022
|
$121.59
|
PP = $124.59
|
|
MB = $130.82
|
Most Recent Note - 11/3/2022 11:24:32 AM
G - Violated its 50 DMA line ($116.93) with today's 4th consecutive loss raising concerns and its color code is changed to green. A rebound above the 50 DMA line is needed for its outlook to improve. Showed resilience since dropped from the Featured Stocks list on 9/26/22. Fundamentals remain strong after reporting Sep '22 quarterly earnings +113% on +43% sales revenues versus the year ago period. See the latest FSU analysis for more details and an annotated graph.
>>> FEATURED STOCK ARTICLE : Testing 50 Day Moving Average Line After Forming New Base - 11/2/2022 |
View all notes |
Set NEW NOTE alert |
Company Profile |
SEC
News |
Chart |
Request a new note
C
A
S
I |
NPO
-
NYSE
Enpro Industries Inc
Machinery-Gen Industrial
|
$121.02
|
+0.14
0.12% |
$121.99
|
76,553
82.32% of 50 DAV
50 DAV is 93,000
|
$121.83
-0.66%
|
11/4/2022
|
$119.06
|
PP = $117.73
|
|
MB = $123.62
|
Most Recent Note - 11/4/2022 5:30:35 PM
Y - Finished strong after highlighted in yellow with pivot point cited based on its 1/14/22 high plus 10 cents in the earlier mid-day report. Faces no resistance due to overhead supply. Rallied into new 52-week high territory this week with impressive volume-driven gains after a 9-month consolidation. Reported Sep '22 quarterly earnings +65% on +34% sales revenues versus the year ago period, its 3rd strong quarterly comparison above the +25% minimum earnings guideline (C criteria), helping it better match the winning models of the fact-based investment system. Annual earnings growth has been steady even through the pandemic. See the latest FSU analysis for more details and an new annotated graph.
>>> FEATURED STOCK ARTICLE : Finished Strong After Highlighted in Friday Mid-Day Report - 11/4/2022 |
View all notes |
Set NEW NOTE alert |
Company Profile |
SEC
News |
Chart |
Request a new note
C
A
S
I |
|
|
|
THESE ARE NOT BUY RECOMMENDATIONS!
Comments contained in the body of this report are technical
opinions only. The material herein has been obtained
from sources believed to be reliable and accurate, however,
its accuracy and completeness cannot be guaranteed.
This site is not an investment advisor, hence it does
not endorse or recommend any securities or other investments.
Any recommendation contained in this report may not
be suitable for all investors and it is not to be deemed
an offer or solicitation on our part with respect to
the purchase or sale of any securities. All trademarks,
service marks and trade names appearing in this report
are the property of their respective owners, and are
likewise used for identification purposes only.
This report is a service available
only to active Paid Premium Members.
You may opt-out of receiving report notifications
at any time. Questions or comments may be submitted
by writing to Premium Membership Services 665 S.E. 10 Street, Suite 201 Deerfield Beach, FL 33441-5634 or by calling 1-800-965-8307
or 954-785-1121.
|
|
|