You are not logged in.
This means you
CAN ONLY VIEW reports that were published prior to Saturday, April 5, 2025.
You
MUST UPGRADE YOUR MEMBERSHIP if you want to see any current reports.
AFTER MARKET UPDATE - WEDNESDAY, NOVEMBER 2ND, 2022
Previous After Market Report Next After Market Report >>>
|
|
|
|
DOW |
-505.44 |
32,147.76 |
-1.55% |
|
Volume |
1,061,977,635 |
+13% |
|
Volume |
5,404,642,000 |
+16% |
|
NASDAQ |
-366.05 |
10,524.80 |
-3.36% |
|
Advancers |
586 |
20% |
|
Advancers |
1,169 |
25% |
|
S&P 500 |
-96.41 |
3,759.69 |
-2.50% |
|
Decliners |
2,355 |
80% |
|
Decliners |
3,452 |
75% |
|
Russell 2000 |
-62.25 |
1,789.14 |
-3.36% |
|
52 Wk Highs |
67 |
|
|
52 Wk Highs |
116 |
|
|
S&P 600 |
-40.93 |
1,160.01 |
-3.41% |
|
52 Wk Lows |
142 |
|
|
52 Wk Lows |
250 |
|
|
 |
Breadth Decisively Negative as Major Averages Sank
Kenneth J. Gruneisen - Passed the CAN SLIM® Master's Exam
The Dow lost 505 points, while the S&P 500 shed 2.5%. The Nasdaq Composite fell 3.4%. The volume totals reported were higher than the prior session on the NYSE and on the Nasdaq exchange, indicative of distributional pressure. Breadth was negative as decliners led advancers by about a 4-1 margin on the NYSE and a 3-1 margin on the Nasdaq exchange. There were 36 high-ranked companies from the Leaders List that hit new 52-week highs and were listed on the BreakOuts Page, versus the total of 51 on the prior session. New 52-week lows totals expanded and outnumbered shrinking new 52-week highs on the NYSE and on the Nasdaq exchange. The market is in a confirmed uptrend (M criteria) but encountering some new pressure. Healthy leadership (new 52-week highs totals) will be essential in the near-term for the rally to be productive. Only stocks meeting all key-criteria of the fact-based investment system should be considered as buy candidates.
Chart courtesy of www.stockcharts.com PICTURED: The Dow Jones Industrial Average pulled back with higher volume for a 3rd consecutive loss, slumping back below its 200-day moving average (DMA) line. At its August peak it only traded a few days above the 200 DMA line. Strength to get and stay above the 200 DMA line would be a reassuring sign of a healthier market, while more deterioration could be a worrisome sign.
U.S. equities finished lower in volatile trading Wednesday as Wall Street digested the Federal Reserve’s (Fed) unanimous decision to raise interests rates by another 75 basis points (0.75%). In a statement following the announcement, officials boosted expectations for a downshift in the pace of rate hikes after stating they "will take into account the cumulative tightening of monetary policy, the lags with which monetary policy affects economic activity and inflation." While the Fed’s statement leaned dovish, Fed Chairman Jerome Powell took a more aggressive stance in his press conference. He reinforced expectations the pace of rate hikes could slow "as soon as the next meeting," but said it would be premature to pause as there is "a ways to go" until they reach their 2% inflation target. Powell also noted the terminal interest rate will most likely be higher than previously forecasted as strong data and stubborn inflation increase the need for more rate hikes.
While stocks initially climbed following the announcement, concerns over a higher terminal rate saw them turn lower. Treasuries weakened, with the yield on the benchmark 10-year note up four basis points (0.04%) to 4.08%, while the 30-year bond yield climbed two basis points (0.02%) to 4.12%. The more Fed-sensitive two-year note yield jumped six basis points (0.06%) to 4.60%. In commodities, West Texas Intermediate (WTI) crude climbed 1.1% to $89.30/barrel amid renewed optimism over global demand. The U.S. Dollar Index reversed earlier losses to finish 0.5% higher. |
 Kenneth J. Gruneisen started out as a licensed stockbroker in August 1987, a couple of months prior to the historic stock market crash that took the Dow Jones Industrial Average down -22.6% in a single day. He has published daily fact-based fundamental and technical analysis on high-ranked stocks online for two decades. Through FACTBASEDINVESTING.COM, Kenneth provides educational articles, news, market commentary, and other information regarding proven investment systems that work in good times and bad.
Comments contained in the body of this report are technical opinions only and are not necessarily those of Gruneisen Growth Corp. The material herein has been obtained from sources believed to be reliable and accurate, however, its accuracy and completeness cannot be guaranteed. Our firm, employees, and customers may effect transactions, including transactions contrary to any recommendation herein, or have positions in the securities mentioned herein or options with respect thereto. Any recommendation contained in this report may not be suitable for all investors and it is not to be deemed an offer or solicitation on our part with respect to the purchase or sale of any securities. |
|
 |
Commodity, Financial, Retail, and Tech Indexes Fell
Kenneth J. Gruneisen - Passed the CAN SLIM® Master's Exam
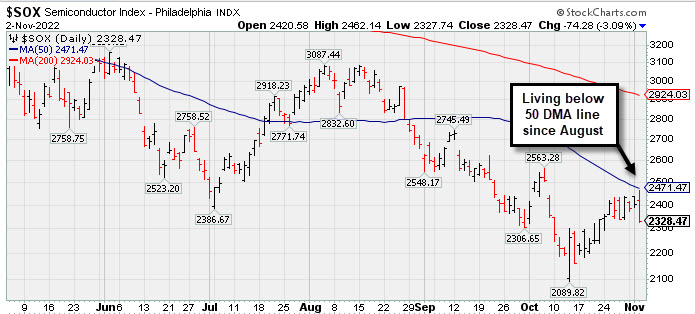
The Retail Index ($RLX -3.72%) created a big drag on the major averages as the Bank Index ($BKX -1.97%) and Broker/Dealer Index ($XBD -1.43%) also fell. The tech sector saw unanimous losses from the Semiconductor Index ($SOX -3.09%), Networking Index ($NWX -3.27%), and the Biotech Index ($BTK -0.80%). The Gold & Silver Index ($XAU -5.88%) was a standout decliner and the Oil Services Index ($OSX -1.88%) and Integrated Oil Index ($XOI -2.12%) also slumped on the widely negative session.
PICTURED: The Semiconductor Index ($SOX -3.09%),has been living below its 50-day moving average (DMA) line since late August. Any technical improvement would be a reassuring sign for the current market uptrend.
| Oil Services |
$OSX |
80.70 |
-1.55 |
-1.88% |
+53.08% |
| Integrated Oil |
$XOI |
1,827.58 |
-39.59 |
-2.12% |
+55.12% |
| Semiconductor |
$SOX |
2,328.47 |
-74.28 |
-3.09% |
-40.99% |
| Networking |
$NWX |
815.66 |
-27.57 |
-3.27% |
-16.00% |
| Broker/Dealer |
$XBD |
461.54 |
-6.68 |
-1.43% |
-5.20% |
| Retail |
$RLX |
2,769.48 |
-107.06 |
-3.72% |
-34.47% |
| Gold & Silver |
$XAU |
99.24 |
-6.20 |
-5.88% |
-25.08% |
| Bank |
$BKX |
102.78 |
-2.07 |
-1.97% |
-22.27% |
| Biotech |
$BTK |
4,927.22 |
-39.93 |
-0.80% |
-10.71% |
|
|
|
 |
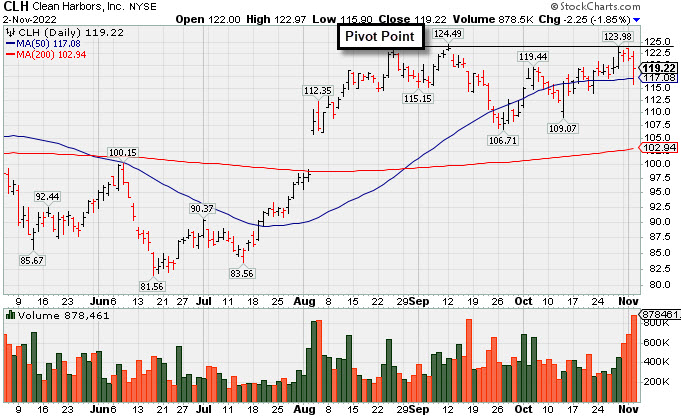
Testing 50 Day Moving Average Line After Forming New Base
Kenneth J. Gruneisen - Passed the CAN SLIM® Master's Exam
Clean Harbors Inc (CLH -$2.25 or -1.85% to $119.22) encountered distributional pressure and finished with a loss today with twice average volume after highlighted in yellow with new pivot point cited based on its 9/12/22 high plus 10 cents in the earlier mid-day report (read here). Subsequent gains above the pivot point backed by at least +40% above average volume may trigger a technical buy signal. It showed resilience since dropped from the Featured Stocks list on 9/26/22. Today's low and its 50-day moving average (DMA) line ($117) define important near-term support to watch.
Fundamentals remain strong after reporting Sep '22 quarterly earnings +113% on +43% sales revenues versus the year ago period. It has a highest possible Earnings Per Share Rating of 99.Prior quarters showed a strong earnings track record with earnings above the +25% minimum guideline (C criteria). Annual earnings (A criteria) growth has been strong and steady.
There are only 54.1 million shares outstanding (S criteria), which can contribute to greater price volatility in the event of institutional buying or selling. The number of top-rated funds owning its shares rose from 590 in Sep '21 to 624 in Sep '22, a reassuring sign concerning the I criteria. The current Up/Down Volume Ratio of 0.9 is an unbiased indication its shares have been under slight distributional pressure over the past 50 days. It has a Timeliness Rating of A and a Sponsorship rating of B.
|
|
|
Color Codes Explained :
Y - Better candidates highlighted by our
staff of experts.
G - Previously featured
in past reports as yellow but may no longer be buyable under the
guidelines.
***Last / Change / Volume data in this table is the closing quote data***
Symbol/Exchange
Company Name
Industry Group |
PRICE |
CHANGE
(%Change) |
Day High |
Volume
(% DAV)
(% 50 day avg vol) |
52 Wk Hi
% From Hi |
Featured
Date |
Price
Featured |
Pivot Featured |
|
Max Buy |
 CI
-
NYSE
CI
-
NYSE
Cigna Corp
Medical-Managed Care
|
$320.86
|
-4.26
-1.31% |
$328.60
|
2,190,114
112.66% of 50 DAV
50 DAV is 1,944,000
|
$326.32
-1.67%
|
7/7/2022
|
$276.55
|
PP = $273.68
|
|
MB = $287.36
|
Most Recent Note - 11/1/2022 6:32:31 PM
G - Posted a gain today with below average volume for yet another new all-time high. Its 50 DMA line ($292.28) defines near-term support to watch above the recent low ($283.79 on 10/10/22). Due to report Sep '22 quarterly results on 11/03/22. Volume and volatility often increase near earnings news.
>>> FEATURED STOCK ARTICLE : No Resistance Remains Due to Overhead Supply - 10/4/2022 |
View all notes |
Set NEW NOTE alert |
Company Profile |
SEC
News |
Chart |
Request a new note
C
A
S
I |
ESQ
-
NASDAQ
Esquire Financial Hldgs
Finance-Commercial Loans
|
$44.90
|
-1.15
-2.50% |
$46.25
|
26,569
98.40% of 50 DAV
50 DAV is 27,000
|
$46.92
-4.30%
|
10/18/2022
|
$40.02
|
PP = $39.95
|
|
MB = $41.95
|
Most Recent Note - 10/31/2022 4:34:16 PM
G - Hit yet another new 52-week high with today's 6th consecutive volume-driven gain, getting extended from the previously noted base. Prior highs in the $41 area define initial support to watch on pullbacks. See the latest FSU analysis for more details and a new annotated graph.
>>> FEATURED STOCK ARTICLE : New High With 6th Consecutive Volume-Driven Gain - 10/31/2022 |
View all notes |
Set NEW NOTE alert |
Company Profile |
SEC
News |
Chart |
Request a new note
C
A
S
I |
CCRN
-
NASDAQ
Cross Country Healthcare
DIVERSIFIED SERVICES - Staffing and Outsourcing Service
|
$35.07
|
-2.64
-7.00% |
$37.45
|
872,947
100.45% of 50 DAV
50 DAV is 869,000
|
$38.68
-9.33%
|
9/9/2022
|
$27.32
|
PP = $30.61
|
|
MB = $32.14
|
 Most Recent Note - 11/2/2022 6:11:52 PM
G - Suffered a big loss today after repeatedly noted as "extended from the previously noted base". Prior highs in the $30.50 area define important near-term support to watch along with its 50 DMA line ($30.42).
>>> FEATURED STOCK ARTICLE : Healthcare Staffing Firm Hovering Near All-Time High - 10/17/2022 |
View all notes |
Set NEW NOTE alert |
Company Profile |
SEC
News |
Chart |
Request a new note
C
A
S
I |
CMC
-
NYSE
Commercial Metals Co
METALS and MINING - Steel and Iron
|
$43.33
|
-2.43
-5.31% |
$45.66
|
1,017,003
98.36% of 50 DAV
50 DAV is 1,034,000
|
$46.68
-7.18%
|
10/14/2022
|
$41.61
|
PP = $44.45
|
|
MB = $46.67
|
Most Recent Note - 11/2/2022 6:13:49 PM
Y - Suffered a big loss today with higher (near average) volume and slumped back below the pivot point raising concerns. Reported Aug '22 quarterly earnings +94% on +19% sales revenues versus the year ago period and prior quarterly comparisons were well above the +25% minimum earnings guideline (C criteria) of the fact-based investment system. Annual earnings growth has been strong.
>>> FEATURED STOCK ARTICLE : Little Resistance Remains for Strong Steel/Metal Products Firm - 10/14/2022 |
View all notes |
Set NEW NOTE alert |
Company Profile |
SEC
News |
Chart |
Request a new note
C
A
S
I |
VRTX
-
NASDAQ
Vertex Pharmaceuticals
Medical-Biomed/Biotech
|
$310.01
|
-4.19
-1.33% |
$318.38
|
1,492,872
106.79% of 50 DAV
50 DAV is 1,398,000
|
$316.48
-2.04%
|
10/24/2022
|
$308.47
|
PP = $306.05
|
|
MB = $321.35
|
Most Recent Note - 10/28/2022 1:43:46 PM
Y - Color code is changed to yellow after quickly rebounding above its 50 DMA line and back above its pivot point with today's big volume-driven gain. Reported Sep '22 quarterly earnings +14% on +18% sales revenues versus the year ago period, below the +25% minimum earnings guideline raising concerns (C criteria). Annual earnings (A criteria) history has been strong.
>>> FEATURED STOCK ARTICLE : Volume-Driven Gain Triggered Technical Buy Signal - 10/24/2022 |
View all notes |
Set NEW NOTE alert |
Company Profile |
SEC
News |
Chart |
Request a new note
C
A
S
I |
Symbol/Exchange
Company Name
Industry Group |
PRICE |
CHANGE
(%Change) |
Day High |
Volume
(% DAV)
(% 50 day avg vol) |
52 Wk Hi
% From Hi |
Featured
Date |
Price
Featured |
Pivot Featured |
|
Max Buy |
CLFD
-
NASDAQ
Clearfield Inc
TELECOMMUNICATIONS - Cables / Satalite Equipment
|
$115.86
|
-2.89
-2.43% |
$122.67
|
146,574
61.85% of 50 DAV
50 DAV is 237,000
|
$130.01
-10.88%
|
10/25/2022
|
$117.96
|
PP = $130.11
|
|
MB = $136.62
|
Most Recent Note - 11/1/2022 6:35:21 PM
Y - Pulled back today with near average volume, yet still perched within striking distance of its 52-week high. New pivot point was cited based on its 8/25/22 high plus 10 cents. Subsequent gains above the pivot point backed by at least +40% above average volume may trigger a technical buy signal. Due to report Sep '22 quarterly results on 11/04/22. Volume and volatility often increase near earnings news.
>>> FEATURED STOCK ARTICLE : Clearfield Perched -8.6% Off High After Recent Rebound - 10/27/2022 |
View all notes |
Set NEW NOTE alert |
Company Profile |
SEC
News |
Chart |
Request a new note
C
A
S
I |
GPK
-
NYSE
Graphic Packaging Hldg
CONSUMER NON-DURABLES - Packaging and Containers
|
$22.33
|
-0.60
-2.62% |
$22.99
|
1,989,086
71.09% of 50 DAV
50 DAV is 2,798,000
|
$24.07
-7.23%
|
10/25/2022
|
$22.75
|
PP = $24.17
|
|
MB = $25.38
|
Most Recent Note - 10/31/2022 2:18:04 PM
Y - Pulling back today for a 3rd consecutive loss after spiking higher last week challenging its 52-week high. Subsequent gains above the pivot point backed by at least +40% above average volume may trigger a technical buy signal. Reported Sep '22 quarterly earnings +79% on +38% sales revenues versus the year ago period.
>>> FEATURED STOCK ARTICLE : Rebound Above 50-Day Moving Average Helped Outlook Improve - 10/25/2022 |
View all notes |
Set NEW NOTE alert |
Company Profile |
SEC
News |
Chart |
Request a new note
C
A
S
I |
CBZ
-
NYSE
C B I Z Inc
Comml Svcs-Consulting
|
$47.26
|
-1.54
-3.16% |
$49.17
|
329,033
128.03% of 50 DAV
50 DAV is 257,000
|
$50.57
-6.55%
|
10/26/2022
|
$47.83
|
PP = $48.57
|
|
MB = $51.00
|
Most Recent Note - 11/1/2022 6:11:52 PM
Y - Pulled back today with above average volume for a 2nd session. Prior high in the $48 area defines initial support to watch above its 50 DMA line ($45). Recently reported Sep '22 quarterly earnings +24% on +28% sales revenues versus the year ago period. Volume and volatility often increase near earnings news.
>>> FEATURED STOCK ARTICLE : Earnings Report Due for Commercial Services and Consulting Firm - 10/26/2022 |
View all notes |
Set NEW NOTE alert |
Company Profile |
SEC
News |
Chart |
Request a new note
C
A
S
I |
ENPH
-
NASDAQ
Enphase Energy Inc
Energy-Solar
|
$289.50
|
-9.98
-3.33% |
$306.78
|
3,530,871
90.17% of 50 DAV
50 DAV is 3,916,000
|
$324.84
-10.88%
|
10/26/2022
|
$301.55
|
PP = $324.94
|
|
MB = $341.19
|
Most Recent Note - 11/2/2022 6:15:36 PM
Y - Consolidating since highlighted in yellow in the 10/26/22 mid-day report with new pivot point cited based on its 9/08/22 high plus 10 cents. Rebound above its 50 DMA line ($282.84) helped its outlook improve. Still faces some resistance due to overhead supply up to the $324 level. Reported Sep '22 quarterly earnings +108% on +81% sales revenues versus the year ago period, continuing its strong earnings history above the +25% minimum guideline (C criteria).
>>> FEATURED STOCK ARTICLE : Enphase Energy Rebound Above 50-Day Moving Average Helped Outlook - 10/28/2022 |
View all notes |
Set NEW NOTE alert |
Company Profile |
SEC
News |
Chart |
Request a new note
C
A
S
I |
HRMY
-
NASDAQ
Harmony Biosciences Hldg
Medical-Biomed/Biotech
|
$58.49
|
-0.77
-1.30% |
$59.84
|
938,418
199.24% of 50 DAV
50 DAV is 471,000
|
$59.27
-1.32%
|
11/1/2022
|
$55.31
|
PP = $57.23
|
|
MB = $60.09
|
Most Recent Note - 11/2/2022 12:19:02 PM
Y - Finished strong after highlighted in yellow with new pivot point cited based on its 7/07/22 high plus 10 cents in the 11/01/22 mid-day report. Fundamentals remain strong after it reported Sep '22 quarterly earnings +132% on +45% sales revenues versus the year ago period. Powered to a new 52-week high with a big gain and strong close above the pivot point backed by +200% above average volume triggering a technical buy signal. Rebounded above its 200 and 50-day moving average (DMA) lines after sputtering since dropped from the Featured Stocks list on 8/24/22. See the latest FSU analysis for more details and an annotated graph.
>>> FEATURED STOCK ARTICLE : Volume Heavy Behind Technical Breakout After Earnings - 11/1/2022 |
View all notes |
Set NEW NOTE alert |
Company Profile |
SEC
News |
Chart |
Request a new note
C
A
S
I |
Symbol/Exchange
Company Name
Industry Group |
PRICE |
CHANGE
(%Change) |
Day High |
Volume
(% DAV)
(% 50 day avg vol) |
52 Wk Hi
% From Hi |
Featured
Date |
Price
Featured |
Pivot Featured |
|
Max Buy |
CLH
-
NYSE
Clean Harbors Inc
Pollution Control
|
$119.22
|
-2.25
-1.85% |
$122.97
|
878,465
211.17% of 50 DAV
50 DAV is 416,000
|
$124.49
-4.23%
|
11/2/2022
|
$121.59
|
PP = $124.59
|
|
MB = $130.82
|
Most Recent Note - 11/2/2022 6:18:13 PM
Y - Encountered distributional pressure today with a 3rd consecutive volume-driven loss. Color code was changed to yellow with new pivot point cited based on its 9/12/22 high plus 10 cents. Subsequent gains above the pivot point backed by at least +40% above average volume may trigger a technical buy signal. Showed resilience since dropped from the Featured Stocks list on 9/26/22. Today's los and its 50 DMA line ($117) define imporatant near-term support to watch. Fundamentals remain strong after reporting Sep '22 quarterly earnings +113% on +43% sales revenues versus the year ago period. See the latest FSU analysis for more details and a new annotated graph.
>>> FEATURED STOCK ARTICLE : Testing 50 Day Moving Average Line After Forming New Base - 11/2/2022 |
View all notes |
Set NEW NOTE alert |
Company Profile |
SEC
News |
Chart |
Request a new note
C
A
S
I |
|
|
|
THESE ARE NOT BUY RECOMMENDATIONS!
Comments contained in the body of this report are technical
opinions only. The material herein has been obtained
from sources believed to be reliable and accurate, however,
its accuracy and completeness cannot be guaranteed.
This site is not an investment advisor, hence it does
not endorse or recommend any securities or other investments.
Any recommendation contained in this report may not
be suitable for all investors and it is not to be deemed
an offer or solicitation on our part with respect to
the purchase or sale of any securities. All trademarks,
service marks and trade names appearing in this report
are the property of their respective owners, and are
likewise used for identification purposes only.
This report is a service available
only to active Paid Premium Members.
You may opt-out of receiving report notifications
at any time. Questions or comments may be submitted
by writing to Premium Membership Services 665 S.E. 10 Street, Suite 201 Deerfield Beach, FL 33441-5634 or by calling 1-800-965-8307
or 954-785-1121.
|
|
|