***Last / Change / Volume data in this table is the closing quote data***
Symbol/Exchange
Company Name
Industry Group |
PRICE |
CHANGE
(%Change) |
Day High |
Volume
(% DAV)
(% 50 day avg vol) |
52 Wk Hi
% From Hi |
Featured
Date |
Price
Featured |
Pivot Featured |
|
Max Buy |
OSBC
-
NASDAQ
Old Second Bancorp Inc
BANKING - Regional - Midwest Banks
|
$15.26
|
+0.16
1.06% |
$15.27
|
106,567
107.10% of 50 DAV
50 DAV is 99,500
|
$16.30
-6.38%
|
9/24/2018
|
$15.38
|
PP = $16.40
|
|
MB = $17.22
|
Most Recent Note - 10/3/2018 6:23:03 PM
Y - Rebounded above its 50 DMA line ($15.36) with today's solid volume-driven gain. Prior lows and its 200 DMA line define additional near-term support. Its Relative Strength Rating is 77, below the 80+ minimum guideline for buy candidates. Met stubborn resistance after hitting a new high on 7/26/18 with a big volume-driven gain. Fundamentals remain strong.
>>> FEATURED STOCK ARTICLE : Bank Perched Less Than -5% Off Record High - 8/23/2018 |
View all notes |
Set NEW NOTE alert |
Company Profile |
SEC
News |
Chart |
Request a new note
C
A
S
I |
SIVB
-
NASDAQ
S V B Financial Group
BANKING - Regional - Pacific Banks
|
$318.37
|
-1.34
-0.42% |
$320.00
|
357,576
87.86% of 50 DAV
50 DAV is 407,000
|
$333.74
-4.61%
|
8/6/2018
|
$314.77
|
PP = $329.75
|
|
MB = $346.24
|
Most Recent Note - 10/2/2018 11:44:47 AM
G - Color code is changed to green while slumping below its 50 DMA line ($319) and below the prior low raising concerns. A prompt rebound above the 50 DMA line is needed for its outlook to improve. Subsequent gains above the pivot point backed by at least +40% above average volume are necessary to trigger a convincing new technical buy signal.
>>> FEATURED STOCK ARTICLE : Bank Posted Quiet Gain for a Best-Ever Close - 8/27/2018 |
View all notes |
Set NEW NOTE alert |
Company Profile |
SEC
News |
Chart |
Request a new note
C
A
S
I |
GMED
-
NYSE
Globus Medical Inc Cl A
CHEMICALS - Specialty Chemicals
|
$50.19
|
-1.16
-2.26% |
$51.40
|
593,646
98.45% of 50 DAV
50 DAV is 603,000
|
$57.55
-12.79%
|
9/26/2018
|
$56.11
|
PP = $57.65
|
|
MB = $60.53
|
Most Recent Note - 10/2/2018 6:10:48 PM
Y - Big loss today on higher volume was action indicative of distributional pressure. It was highlighted in yellow with pivot point cited based on its 6/06/18 high plus 10 cents in the 9/26/18 mid-day report. Subsequent gains above the pivot point backed by more than +40% above average volume are needed to trigger a proper technical buy signal. Reported earnings +38% on +14% sales revenues for the Jun '18 quarter. The Medical - Products firm has technology to treat patients with spine disorders. Reported earnings +38% on +14% sales revenues for the Jun '18 quarter, its 2nd strong quarterly comparison above the +25% minimum guideline (C criteria). Annual earnings (A criteria) growth has been steady.
>>> FEATURED STOCK ARTICLE : Rallying Near Pivot Point With Volume-Driven Gains - 9/26/2018 |
View all notes |
Set NEW NOTE alert |
Company Profile |
SEC
News |
Chart |
Request a new note
C
A
S
I |
ZBRA
-
NASDAQ
Zebra Tech Corp Cl A
COMPUTER HARDWARE - Computer Peripherals
|
$158.50
|
-3.73
-2.30% |
$164.06
|
451,104
119.34% of 50 DAV
50 DAV is 378,000
|
$179.47
-11.68%
|
8/7/2018
|
$164.26
|
PP = $161.82
|
|
MB = $169.91
|
 Most Recent Note - 10/8/2018 6:53:29 PM
G - Violated its 50 DMA line ($165) and slumped below the prior high ($161) with damaging losses triggering technical sell signals. Only a prompt rebound above the 50 DMA line would help its outlook improve.
>>> FEATURED STOCK ARTICLE : Hovering Near All-Time High With Strong Fundamentals - 9/24/2018 |
View all notes |
Set NEW NOTE alert |
Company Profile |
SEC
News |
Chart |
Request a new note
C
A
S
I |
EPAM
-
NYSE
Epam Systems Inc
COMPUTER SOFTWARE and SERVICES - Information Technology Service
|
$129.21
|
-3.41
-2.57% |
$131.88
|
278,982
66.27% of 50 DAV
50 DAV is 421,000
|
$144.19
-10.39%
|
7/5/2018
|
$123.70
|
PP = $131.85
|
|
MB = $138.44
|
Most Recent Note - 10/5/2018 5:46:57 PM
G - Violated its 50 DMA line ($136) and recent low triggering technical sell signals this week. Only a prompt rebound above the 50 DMA line would help its outlook improve. See the latest FSU analysis for more details and a new annotated graph.
>>> FEATURED STOCK ARTICLE : Slump Below 50-Day Moving Average Raised Concerns - 10/5/2018 |
View all notes |
Set NEW NOTE alert |
Company Profile |
SEC
News |
Chart |
Request a new note
C
A
S
I |
Symbol/Exchange
Company Name
Industry Group |
PRICE |
CHANGE
(%Change) |
Day High |
Volume
(% DAV)
(% 50 day avg vol) |
52 Wk Hi
% From Hi |
Featured
Date |
Price
Featured |
Pivot Featured |
|
Max Buy |
IRBT
-
NASDAQ
Irobot Corp
CONSUMER DURABLES - Electronic Equipment
|
$97.01
|
-9.06
-8.54% |
$104.00
|
1,579,121
195.92% of 50 DAV
50 DAV is 806,000
|
$118.75
-18.31%
|
8/29/2018
|
$112.07
|
PP = $109.88
|
|
MB = $115.37
|
Most Recent Note - 10/8/2018 11:35:02 AM
G - Gapped down today violating both its 50 DMA line ($101.25) and the prior low ($99.73 on 9/07/18) triggering technical sell signals. Color code is changed to green. Only a prompt rebound above the 50 DMA line would help its outlook improve.
>>> FEATURED STOCK ARTICLE : Household Appliance Maker Rallied From Choppy Base - 8/29/2018 |
View all notes |
Set NEW NOTE alert |
Company Profile |
SEC
News |
Chart |
Request a new note
C
A
S
I |
TSC
-
NASDAQ
TriState Capital Hld Inc
CONSUMER NON-DURABLES - Personal Products
|
$28.11
|
-0.10
-0.35% |
$28.22
|
178,152
91.36% of 50 DAV
50 DAV is 195,000
|
$30.10
-6.61%
|
9/11/2018
|
$29.75
|
PP = $30.20
|
|
MB = $31.71
|
Most Recent Note - 10/3/2018 12:55:35 PM
G - A rebound above the 50 DMA line ($29.00) still is needed for its outlook to improve. Its Relative Strength Rating has improved to 83. Found support near prior highs in the $27 area. While rebounding it faces resistance due to overhead supply up to the $30 level.
>>> FEATURED STOCK ARTICLE : TriState Bank Perched Near All-Time High - 9/11/2018 |
View all notes |
Set NEW NOTE alert |
Company Profile |
SEC
News |
Chart |
Request a new note
C
A
S
I |
CME
-
NASDAQ
C M E Group Inc
DIVERSIFIED SERVICES - Business/Management Services
|
$180.91
|
-0.78
-0.43% |
$181.63
|
1,213,862
93.02% of 50 DAV
50 DAV is 1,305,000
|
$182.97
-1.13%
|
10/4/2018
|
$179.29
|
PP = $177.45
|
|
MB = $186.32
|
Most Recent Note - 10/4/2018 5:55:27 PM
Y - Finished strong after highlighted in yellow with pivot point cited based on its 9/05/18 high plus 10 cents. Hit a new all-time high with +80% above average volume behind today's 4th consecutive gain while clearing a brief consolidation above its 50 DMA line. Earnings increases in the Mar and Jun '18 quarters were above the +25% minimum guideline (C criteria) with solid sales revenues increases. Annual earnings (A criteria) growth has been steady. See the latest FSU analysis for more details and a new annotated graph.
>>> FEATURED STOCK ARTICLE : CME Group Blasted to New Record High - 10/4/2018 |
View all notes |
Set NEW NOTE alert |
Company Profile |
SEC
News |
Chart |
Request a new note
C
A
S
I |
FLT
-
NYSE
Fleetcor Technologies
DIVERSIFIED SERVICES - Business/Management Services
|
$216.81
|
-1.64
-0.75% |
$219.66
|
534,246
101.57% of 50 DAV
50 DAV is 526,000
|
$230.24
-5.83%
|
9/12/2018
|
$221.01
|
PP = $226.02
|
|
MB = $237.32
|
Most Recent Note - 10/2/2018 11:16:44 AM
Y - Perched near its record high following recent volume-driven gains. Its 50 DMA line ($218.87) defines near-term support to watch on pullbacks. New pivot point cited was based on its 7/25/18 high plus 10 cents. Subsequent volume-driven gains above the pivot point may trigger a new (or add-on) technical buy signal.
>>> FEATURED STOCK ARTICLE : Perched Within Close Striking Distance of New Pivot Point - 9/20/2018 |
View all notes |
Set NEW NOTE alert |
Company Profile |
SEC
News |
Chart |
Request a new note
C
A
S
I |
MA
-
NYSE
Mastercard Inc Cl A
Finance-CrdtCard/PmtPr
|
$208.26
|
-5.00
-2.34% |
$211.80
|
5,610,029
179.58% of 50 DAV
50 DAV is 3,124,000
|
$225.35
-7.58%
|
7/11/2018
|
$203.84
|
PP = $204.10
|
|
MB = $214.31
|
Most Recent Note - 10/8/2018 12:48:23 PM
G - Violated the prior high ($214) and also violated its 50 DMA line ($211) with today's 3rd consecutive volume-driven loss, triggering technical sell signals. Only a prompt rebound above the 50 DMA line would help its outlook improve.
>>> FEATURED STOCK ARTICLE : Hovering Near High, Extended From Any Sound Base - 9/27/2018 |
View all notes |
Set NEW NOTE alert |
Company Profile |
SEC
News |
Chart |
Request a new note
C
A
S
I |
Symbol/Exchange
Company Name
Industry Group |
PRICE |
CHANGE
(%Change) |
Day High |
Volume
(% DAV)
(% 50 day avg vol) |
52 Wk Hi
% From Hi |
Featured
Date |
Price
Featured |
Pivot Featured |
|
Max Buy |
V
-
NYSE
Visa Inc Cl A
Finance-CrdtCard/PmtPr
|
$141.89
|
-3.47
-2.39% |
$145.01
|
11,595,470
161.16% of 50 DAV
50 DAV is 7,195,000
|
$151.56
-6.38%
|
4/26/2018
|
$126.68
|
PP = $126.98
|
|
MB = $133.33
|
Most Recent Note - 10/8/2018 1:05:35 PM
G - Violated its 50 DMA line ($144) and recent low ($142.55 on 9/050/18) triggering technical sell signals. Only a rebound above the 50 DMA line would help its outlook improve.
>>> FEATURED STOCK ARTICLE : Visa Near Record but Endured Distributional Pressure - 9/13/2018 |
View all notes |
Set NEW NOTE alert |
Company Profile |
SEC
News |
Chart |
Request a new note
C
A
S
I |
ENV
-
NYSE
Envestnet Inc
FINANCIAL SERVICES - Diversified Investments
|
$60.16
|
-1.22
-1.99% |
$61.14
|
188,560
75.42% of 50 DAV
50 DAV is 250,000
|
$64.80
-7.16%
|
6/15/2018
|
$57.85
|
PP = $60.37
|
|
MB = $63.39
|
Most Recent Note - 10/8/2018 6:47:11 PM
G - Sputtering below its 50 DMA line ($61.15) again. A rebound is needed for its outlook to improve. Its Relative Strength Rating is 79, below the 80+ minimum guideline for buy candidates. Fundamentals remain strong.
>>> FEATURED STOCK ARTICLE : Found Recent Support at 50-Day Moving Average - 9/21/2018 |
View all notes |
Set NEW NOTE alert |
Company Profile |
SEC
News |
Chart |
Request a new note
C
A
S
I |
TPL
-
NYSE
Texas Pacific Land Trust
Real Estate Dvlpmt/Ops
|
$842.06
|
-14.95
-1.74% |
$857.90
|
16,609
127.76% of 50 DAV
50 DAV is 13,000
|
$877.97
-4.09%
|
9/14/2018
|
$820.45
|
PP = $874.10
|
|
MB = $917.81
|
Most Recent Note - 10/5/2018 1:00:05 PM
Y - Perched near its all-time high, holding its ground in a very tight range in recent weeks. New pivot point cited was based on its 8/27/18 high plus 10 cents. Subsequent gains above the pivot point back by at least +40% above average volume may trigger a new (or add-on) technical buy signal. The 50 DMA line ($823) and recent low ($818 on 9/17/18) define important near-term support to watch on pullbacks.
>>> FEATURED STOCK ARTICLE : Best Ever Close After a Solid Gain on Higher Volume - 9/4/2018 |
View all notes |
Set NEW NOTE alert |
Company Profile |
SEC
News |
Chart |
Request a new note
C
A
S
I |
ABMD
-
NASDAQ
Abiomed Inc
HEALTH SERVICES - Medical Instruments and Supplies
|
$399.01
|
-16.70
-4.02% |
$415.55
|
783,741
129.76% of 50 DAV
50 DAV is 604,000
|
$459.75
-13.21%
|
9/25/2018
|
$441.96
|
PP = $451.03
|
|
MB = $473.58
|
Most Recent Note - 10/8/2018 7:03:29 PM
Y - Tallied 6 consecutive losses since a "negative reversal" on 10/01/18 at its all-time high. Its 50 DMA line ($390) defines important support.
>>> FEATURED STOCK ARTICLE : Quick Rebound Near Prior High - 9/25/2018 |
View all notes |
Set NEW NOTE alert |
Company Profile |
SEC
News |
Chart |
Request a new note
C
A
S
I |
ODFL
-
NASDAQ
Old Dominion Fght Line
TRANSPORTATION - Trucking
|
$150.75
|
-1.12
-0.74% |
$152.47
|
468,786
86.49% of 50 DAV
50 DAV is 542,000
|
$170.22
-11.44%
|
9/6/2018
|
$163.11
|
PP = $164.20
|
|
MB = $172.41
|
Most Recent Note - 10/8/2018 6:51:42 PM
G - Color code is changed to green after slumping below its 50 DMA line ($154) raising concerns and triggering a technical sell signal. Only a prompt rebound would help its outlook improve. Its 200 DMA line ($147) defines near-term support above prior lows.
>>> FEATURED STOCK ARTICLE : Trucking Firm Perched at All-Time High - 9/7/2018 |
View all notes |
Set NEW NOTE alert |
Company Profile |
SEC
News |
Chart |
Request a new note
C
A
S
I |
Symbol/Exchange
Company Name
Industry Group |
PRICE |
CHANGE
(%Change) |
Day High |
Volume
(% DAV)
(% 50 day avg vol) |
52 Wk Hi
% From Hi |
Featured
Date |
Price
Featured |
Pivot Featured |
|
Max Buy |
DPZ
-
NYSE
Dominos Pizza Inc
Retail-Restaurants
|
$280.24
|
-2.67
-0.94% |
$282.29
|
341,658
66.34% of 50 DAV
50 DAV is 515,000
|
$305.34
-8.22%
|
8/13/2018
|
$288.60
|
PP = $293.91
|
|
MB = $308.61
|
Most Recent Note - 10/3/2018 10:08:37 AM
Y - Consolidating near its 50 DMA line ($285) but again sputtering below the previously cited pivot point. The recent low ($273.63 on 9/17/18) defines important near-term support to watch.
>>> FEATURED STOCK ARTICLE : Pulling Back After Wedging Gains for Highs Lacked Great Volume - 9/5/2018 |
View all notes |
Set NEW NOTE alert |
Company Profile |
SEC
News |
Chart |
Request a new note
C
A
S
I |
FIVE
-
NASDAQ
Five Below Inc
Retail-DiscountandVariety
|
$120.55
|
+2.96
2.52% |
$120.85
|
1,116,358
123.49% of 50 DAV
50 DAV is 904,000
|
$136.13
-11.45%
|
7/6/2018
|
$98.90
|
PP = $104.09
|
|
MB = $109.29
|
Most Recent Note - 10/2/2018 6:05:26 PM
G - Slumped to a 3 week low. Still consolidating well above its 50 DMA line ($114.81) and prior high ($109.09 on 7/19/18) defining near-term support to watch. Earnings rose +40% on +23% sales revenues for the Jul '18 quarter, continuing its strong earnings track record. See the latest FSU analysis for more details and a new annotated graph.
>>> FEATURED STOCK ARTICLE : Retreating After +138% Rally in Under 12 Months - 10/2/2018 |
View all notes |
Set NEW NOTE alert |
Company Profile |
SEC
News |
Chart |
Request a new note
C
A
S
I |
NOW
-
NYSE
Servicenow Inc
Computer Sftwr-Enterprse
|
$180.26
|
-6.34
-3.40% |
$185.81
|
2,625,277
143.61% of 50 DAV
50 DAV is 1,828,000
|
$206.30
-12.62%
|
8/24/2018
|
$193.83
|
PP = $194.91
|
|
MB = $204.66
|
Most Recent Note - 10/4/2018 12:45:13 PM
G - Color code is changed to green while slumping below its 50 DMA line ($190) with today's loss on higher volume raising concerns. Recent low ($182.73 on 9/19/18) defines important near-term support above its 200 DMA line. Fundamentals remain strong. See the latest FSU analysis for more details and an annotated graph.
>>> FEATURED STOCK ARTICLE : Found Support at 50-Day Average After Slump Into Prior Base - 10/3/2018 |
View all notes |
Set NEW NOTE alert |
Company Profile |
SEC
News |
Chart |
Request a new note
C
A
S
I |
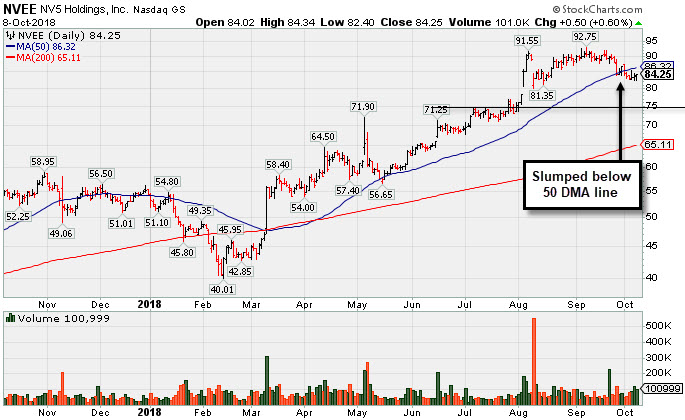
NVEE
-
NASDAQ
N V 5 Global Inc
Comml Svcs-Consulting
|
$84.25
|
+0.50
0.60% |
$84.34
|
100,999
116.09% of 50 DAV
50 DAV is 87,000
|
$92.75
-9.16%
|
6/15/2018
|
$7,070.00
|
PP = $72.00
|
|
MB = $75.60
|
Most Recent Note - 10/8/2018 6:55:02 PM
G - Still sputtering below its 50 DMA line ($86.32). A rebound above the 50 DMA line is needed for its outlook to improve. See the latest FSU analysis for more details and a new annotated graph.
>>> FEATURED STOCK ARTICLE : Recently Slumped Below 50-Day Moving Average Line - 10/8/2018 |
View all notes |
Set NEW NOTE alert |
Company Profile |
SEC
News |
Chart |
Request a new note
C
A
S
I |
PANW
-
NYSE
Palo Alto Networks
Computer Sftwr-Security
|
$212.38
|
-3.33
-1.54% |
$216.81
|
1,327,544
106.72% of 50 DAV
50 DAV is 1,244,000
|
$239.50
-11.32%
|
6/12/2018
|
$206.55
|
PP = $214.69
|
|
MB = $225.42
|
Most Recent Note - 10/2/2018 6:14:02 PM
Y - Color code is changed to yellow after pulling back below its "max buy" level with a streak of 6 consecutive losses on lighter volume. Its 50 DMA line ($220.31) and prior high ($219.38 on 7/13/18) define important near term support to watch where subsequent violations would raise greater concerns. Fundamentals remain strong.
>>> FEATURED STOCK ARTICLE : Perched Near All-Time High With Volume Totals Cooling - 9/17/2018 |
View all notes |
Set NEW NOTE alert |
Company Profile |
SEC
News |
Chart |
Request a new note
C
A
S
I |
Symbol/Exchange
Company Name
Industry Group |
PRICE |
CHANGE
(%Change) |
Day High |
Volume
(% DAV)
(% 50 day avg vol) |
52 Wk Hi
% From Hi |
Featured
Date |
Price
Featured |
Pivot Featured |
|
Max Buy |
QLYS
-
NASDAQ
Qualys Inc
Computer Sftwr-Security
|
$77.60
|
-4.37
-5.33% |
$81.30
|
702,583
209.10% of 50 DAV
50 DAV is 336,000
|
$98.30
-21.06%
|
8/31/2018
|
$91.05
|
PP = $98.40
|
|
MB = $103.32
|
Most Recent Note - 10/8/2018 6:58:55 PM
Violated its 200 DMA line ($79.38) with a big volume-driven loss today raising greater concerns. Faces resistance due to overhead supply up to the $98 level. It will be dropped from the Featured Stocks list tonight.
>>> FEATURED STOCK ARTICLE : Cloud Security Firm Faces Some Near Term Resistance - 9/3/2018 |
View all notes |
Set NEW NOTE alert |
Company Profile |
SEC
News |
Chart |
Request a new note
C
A
S
I |
PAYC
-
NYSE
Paycom Software Inc
COMPUTER SOFTWARE and SERVICES - Application Software
|
$134.77
|
-4.28
-3.08% |
$138.50
|
801,545
96.57% of 50 DAV
50 DAV is 830,000
|
$164.08
-17.86%
|
8/1/2018
|
$122.87
|
PP = $118.55
|
|
MB = $124.48
|
Most Recent Note - 10/4/2018 3:04:33 PM
G - Violated its 50 DMA line ($144.60) with today's big volume-driven loss triggering a technical sell signal. Only a prompt rebound above the 50 DMA line would help its outlook improve.
>>> FEATURED STOCK ARTICLE : Very Extended From Base After Impressive Rally - 9/18/2018 |
View all notes |
Set NEW NOTE alert |
Company Profile |
SEC
News |
Chart |
Request a new note
C
A
S
I |
GRUB
-
NYSE
Grubhub Inc
INTERNET - Content
|
$126.70
|
-3.14
-2.42% |
$129.67
|
1,404,565
120.46% of 50 DAV
50 DAV is 1,166,000
|
$149.35
-15.17%
|
8/24/2018
|
$138.44
|
PP = $141.16
|
|
MB = $148.22
|
Most Recent Note - 10/4/2018 3:11:01 PM
G - Color code is changed to green while slumping below its 50 DMA line ($135.46) and below the recent low ($132.15 on 9/24/18) with a big loss raising concerns and triggering technical sell signals. Recent gains lacked great volume conviction. Only a prompt rebound would help its outlook improve.
>>> FEATURED STOCK ARTICLE : Wedged Higher Then Fell Below Pivot Point With Heavier Volume - 9/19/2018 |
View all notes |
Set NEW NOTE alert |
Company Profile |
SEC
News |
Chart |
Request a new note
C
A
S
I |
HQY
-
NASDAQ
Healthequity Inc
COMPUTER SOFTWARE and SERVICES - Healthcare Information Service
|
$88.02
|
-1.47
-1.64% |
$89.49
|
580,122
78.39% of 50 DAV
50 DAV is 740,000
|
$99.99
-11.97%
|
8/13/2018
|
$82.39
|
PP = $83.44
|
|
MB = $87.61
|
Most Recent Note - 10/8/2018 6:48:54 PM
G - Quietly slumped below its 50 DMA line ($89.05) today raising concerns. More damaging losses would raise greater concerns. Prior highs in the $82-83 area define the next important support to watch.
>>> FEATURED STOCK ARTICLE : Very Extended From Any Sound Base After Streak of Gains - 9/10/2018 |
View all notes |
Set NEW NOTE alert |
Company Profile |
SEC
News |
Chart |
Request a new note
C
A
S
I |
PYPL
-
NASDAQ
Paypal Holdings Inc
Finance-CrdtCard/PmtPr
|
$80.55
|
-2.63
-3.16% |
$82.89
|
16,860,748
223.14% of 50 DAV
50 DAV is 7,556,000
|
$93.70
-14.03%
|
7/23/2018
|
$89.24
|
PP = $87.55
|
|
MB = $91.93
|
Most Recent Note - 10/8/2018 12:52:27 PM
G - Violated its 200 DMA line ($82.20) and undercut prior lows in the $80-81 area with today's 3rd consecutive loss triggering a worrisome technical sell signal. A rebound above the 50 DMA line ($87.94) is needed for its outlook to improve.
>>> FEATURED STOCK ARTICLE : Consolidating Above 50-Day Moving Average Near High - 9/12/2018 |
View all notes |
Set NEW NOTE alert |
Company Profile |
SEC
News |
Chart |
Request a new note
C
A
S
I |
Symbol/Exchange
Company Name
Industry Group |
PRICE |
CHANGE
(%Change) |
Day High |
Volume
(% DAV)
(% 50 day avg vol) |
52 Wk Hi
% From Hi |
Featured
Date |
Price
Featured |
Pivot Featured |
|
Max Buy |
OLLI
-
NASDAQ
Ollie's Bargain Outlet
Retail-DiscountandVariety
|
$89.38
|
+1.38
1.57% |
$89.77
|
985,748
154.75% of 50 DAV
50 DAV is 637,000
|
$97.61
-8.43%
|
7/12/2018
|
$74.43
|
PP = $77.60
|
|
MB = $81.48
|
Most Recent Note - 10/8/2018 12:49:02 PM
G - Very extended from any sound base. Its 50 DMA line ($83.59) defines near-term support above prior highs in the $77 area. Fundamentals remain strong.
>>> FEATURED STOCK ARTICLE : Hitting New Highs With More Volume-Driven Gains - 8/22/2018 |
View all notes |
Set NEW NOTE alert |
Company Profile |
SEC
News |
Chart |
Request a new note
C
A
S
I |
TEAM
-
NASDAQ
Atlassian Corp Plc Cl A
Comp Sftwr-Spec Enterprs
|
$81.09
|
-4.27
-5.00% |
$84.71
|
3,316,224
213.40% of 50 DAV
50 DAV is 1,554,000
|
$98.21
-17.43%
|
7/27/2018
|
$73.73
|
PP = $68.85
|
|
MB = $72.29
|
Most Recent Note - 10/8/2018 7:01:19 PM
G - Violated its 50 DMA line ($85.23) triggering a technical sell signal with above average volume behind today's 6th consecutive loss. Only a prompt rebound above the 50 DMA line would help its outlook improve.
>>> FEATURED STOCK ARTICLE : Extended From Base and Hitting Another New High - 9/14/2018 |
View all notes |
Set NEW NOTE alert |
Company Profile |
SEC
News |
Chart |
Request a new note
C
A
S
I |
SEND
-
NYSE
Sendgrid Inc
INTERNET - Content
|
$32.46
|
-1.46
-4.30% |
$34.28
|
826,748
92.48% of 50 DAV
50 DAV is 894,000
|
$38.66
-16.04%
|
8/13/2018
|
$32.20
|
PP = $32.13
|
|
MB = $33.74
|
Most Recent Note - 10/8/2018 11:37:18 AM
G - Violated its 50 DMA line ($33.83) and prior highs in the $32 area with a big loss today triggering technical signals. Only a prompt rebound above the 50 DMA line would help its outlook improve.
>>> FEATURED STOCK ARTICLE : Extended From Prior Base Following Rally - 10/1/2018 |
View all notes |
Set NEW NOTE alert |
Company Profile |
SEC
News |
Chart |
Request a new note
C
A
S
I |