You are not logged in.
This means you
CAN ONLY VIEW reports that were published prior to Thursday, March 20, 2025.
You
MUST UPGRADE YOUR MEMBERSHIP if you want to see any current reports.
AFTER MARKET UPDATE - TUESDAY, AUGUST 8TH, 2023
Previous After Market Report Next After Market Report >>>
|
|
|
|
DOW |
-158.64 |
35,314.49 |
-0.45% |
|
Volume |
849,547,526 |
+10% |
|
Volume |
5,342,559,800 |
+8% |
|
NASDAQ |
-110.07 |
13,884.32 |
-0.79% |
|
Advancers |
1,054 |
37% |
|
Advancers |
1,689 |
39% |
|
S&P 500 |
-19.06 |
4,499.38 |
-0.42% |
|
Decliners |
1,759 |
63% |
|
Decliners |
2,642 |
61% |
|
Russell 2000 |
-11.52 |
1,947.42 |
-0.59% |
|
52 Wk Highs |
61 |
|
|
52 Wk Highs |
63 |
|
|
S&P 600 |
-8.36 |
1,258.40 |
-0.66% |
|
52 Wk Lows |
59 |
|
|
52 Wk Lows |
203 |
|
|
 |
Major Indices Endure Greater Distributional Pressure
Kenneth J. Gruneisen - Passed the CAN SLIM® Master's Exam
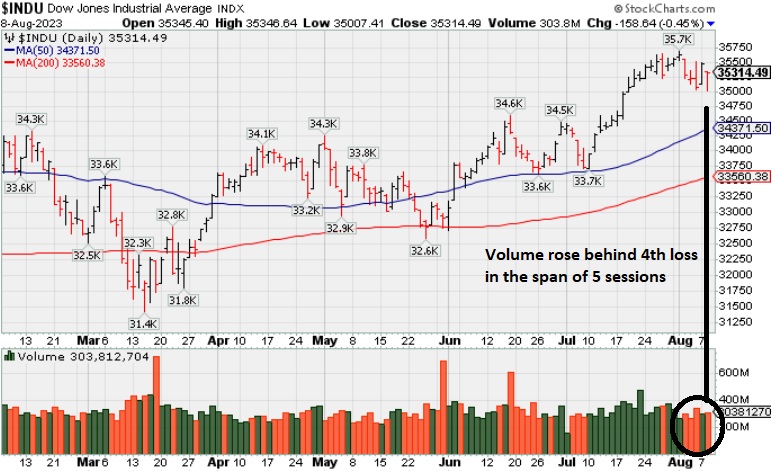
The S&P 500, Dow Jones Industrial Average, and Nasdaq Composite had been down as much as 1.2%, 1.3%, and 1.6%, respectively, at their morning lows, but ultimately finished down just 0.4%, 0.5%, 0.8%. Volume totals reported were higher than the prior session totals on the NYSE and on the Nasdaq exchange versus the prior session, action indicative of increasing institutional selling pressure. Decliners led advancers by a 9-5 margin on the NYSE and by 3-2 on the Nasdaq exchange. There were 32 high-ranked companies from the Leaders List that hit a new 52-week high and were listed on the BreakOuts Page, down from the total of 54 on the prior session. New 52-week highs narrowly outnumbered new 52-week lows on the NYSE but for a 5th consecutive session new lows more convincingly outnumbered new highs on the Nasdaq exchange. The major indices are in an uptrend that is under pressure (M criteria), Healthy leadership is crucial to any sustained rally. Appropriate new buying efforts may still be considered under the fact-based investment system. Greater caution may be necessary in the event of a more serious correction.
PICTURED: The Dow Jones Industrial Average saw volume rise behind a 4th loss in the span of 5 sessions. It is consolidating well above its 50-day moving average (DMA) line.
Stocks had a negative bias and yet the major indices all closed near their highs of the session. There was comparable weakness by market cap, with losses in eight out of 11 S&P 500 sectors and 21 of 30 Dow components. The S&P 500 financials sector (-0.9%), materials (-1.1%), and consumer discretionary (-0.9%) each ended lower.
Concerns about global growth were stirred by weaker than expected trade data out of China for July that featured a 14.5% year-over-year decline in exports and a 12.4% year-over-year decline in imports. The latter marked the fastest contraction in over two years.
Weak bank stocks contributed to the negative bias after Moody's downgraded the credit ratings for 10 smaller U.S. banks and put some bigger banks on watch for downgrade. United Parcel Service (UPS -0.88%) issued disappointing FY23 revenue outlook, citing weakening e-commerce demand and an expectation for lower volumes following the improved labor contract for the lowered guidance. The health care sector (+0.8%) logged the biggest gain, helped by a big move higher in Eli Lilly (LLY +14.87%) after topping Q2 expectations and raising FY23 guidance.
Philadelphia Fed President Harker (FOMC voter) suggested in a speech that the Fed could be done raising rates, but if so, would likely need to hold them where they are for a while and that he doesn't see any likely circumstance for an immediate easing of the policy rate. The 2-yr Treasury note yield, which hit 4.72% earlier, fell two basis points to 4.75%. The 10-yr note yield, which slipped to 3.98%, fell five basis points to 4.03%.
|
 Kenneth J. Gruneisen started out as a licensed stockbroker in August 1987, a couple of months prior to the historic stock market crash that took the Dow Jones Industrial Average down -22.6% in a single day. He has published daily fact-based fundamental and technical analysis on high-ranked stocks online for two decades. Through FACTBASEDINVESTING.COM, Kenneth provides educational articles, news, market commentary, and other information regarding proven investment systems that work in good times and bad.
Comments contained in the body of this report are technical opinions only and are not necessarily those of Gruneisen Growth Corp. The material herein has been obtained from sources believed to be reliable and accurate, however, its accuracy and completeness cannot be guaranteed. Our firm, employees, and customers may effect transactions, including transactions contrary to any recommendation herein, or have positions in the securities mentioned herein or options with respect thereto. Any recommendation contained in this report may not be suitable for all investors and it is not to be deemed an offer or solicitation on our part with respect to the purchase or sale of any securities. |
|
 |
Energy-Linked Groups and Biotech Index Posted Gains
Kenneth J. Gruneisen - Passed the CAN SLIM® Master's Exam
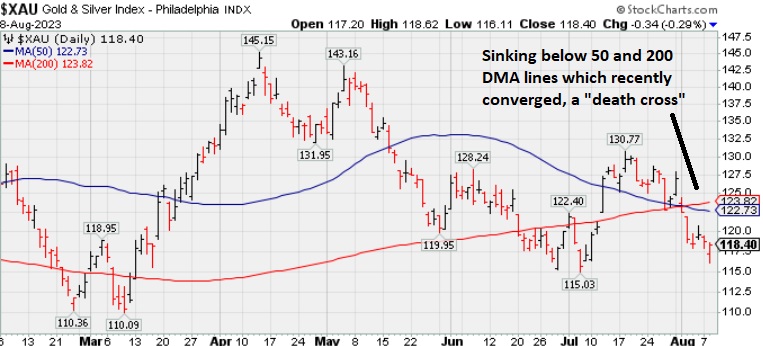
The Retail Index ($RLX -1.12%), Bank Index ($BKX -1.21%) and the Broker/Dealer Index ($XBD -1.41%) each lost ground. The tech sector was led lower by the Semiconductor Index ($SOX -1.60%) while the Networking Index ($NWX -0.31%) edged lower and the Biotech Index ($BTK +0.52%) eked out a small gain. The Gold & Silver Index ($XAU -0.29%) ended slightly in the red while the Oil Services Index ($OSX +0.83%) and the Integrated Oil Index ($XOI +0.61%) both posted small gains.
PICTURED: The Gold & Silver Index ($XAU -0.29%) has been recently sinking below its 50-day and 200-day moving average (DMA) lines which recently converged, a bearish technical signal termed a "death cross".
| Oil Services |
$OSX |
93.09 |
+0.76 |
+0.83% |
+11.01% |
| Integrated Oil |
$XOI |
1,846.87 |
+11.27 |
+0.61% |
+3.34% |
| Semiconductor |
$SOX |
3,679.42 |
-59.99 |
-1.60% |
+45.31% |
| Networking |
$NWX |
791.48 |
-2.49 |
-0.31% |
+1.04% |
| Broker/Dealer |
$XBD |
503.60 |
-7.19 |
-1.41% |
+12.13% |
| Retail |
$RLX |
3,638.74 |
-41.38 |
-1.12% |
+32.13% |
| Gold & Silver |
$XAU |
118.40 |
-0.34 |
-0.29% |
-2.03% |
| Bank |
$BKX |
87.63 |
-1.07 |
-1.21% |
-13.11% |
| Biotech |
$BTK |
5,179.05 |
+26.84 |
+0.52% |
-1.93% |
|
|
|
 |
ePLUS Gapped Up but Ended in Lower Half of Intra-Day Range
Kenneth J. Gruneisen - Passed the CAN SLIM® Master's Exam
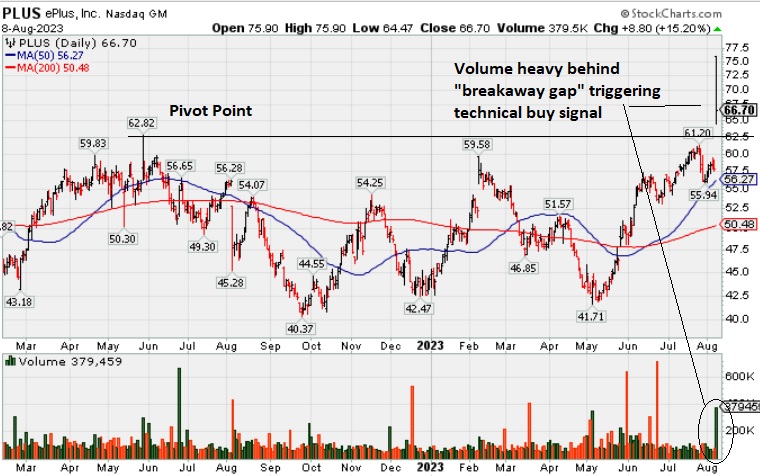
ePlus (PLUS +$8.80 or +15.20% to $66.70) was highlighted in yellow with pivot point cited based on its may '22 high plus 10 cents (read here). There was a "breakaway gap" and it hit a new all-time high with today's big volume-driven gain triggering a technical buy signal.
Bullish action came after it reported earnings +42% on +25% sales revenues for the Jun '23 quarter versus the year ago period, its 3rd consecutive quarterly earnings increase above the +25% minimum guideline (C criteria), helping it better match the winning models of the fact-based investment system. Annual earnings growth (A criteria) has been strong. It has a 97 earnings Per Share rating.
It hails from the Computer-Tech Services group which is currently ranked 86th on the 197 Industry Groups list. The small supply of only 26.8 million shares outstanding (S criteria) can contribute to greater price volatility in the event of institutional buying or selling. The number of top-rated funds owning its shares reportedly fell from 422 in Sep '22 to 404 in Jun '23, not a reassuring sign concerning the I criteria. Meanwhile, its current Up/Down Volume ratio of 0.9 is an unbiased indication its shares have been under slight distributional pressure over the past 50 days. |
|
|
Color Codes Explained :
Y - Better candidates highlighted by our
staff of experts.
G - Previously featured
in past reports as yellow but may no longer be buyable under the
guidelines.
***Last / Change / Volume data in this table is the closing quote data***
Symbol/Exchange
Company Name
Industry Group |
PRICE |
CHANGE
(%Change) |
Day High |
Volume
(% DAV)
(% 50 day avg vol) |
52 Wk Hi
% From Hi |
Featured
Date |
Price
Featured |
Pivot Featured |
|
Max Buy |
 STRL
-
NASDAQ
STRL
-
NASDAQ
Sterling Construction Co
MATERIALS and; CONSTRUCTION - Heavy Construction
|
$75.58
|
+13.77
22.28% |
$75.95
|
1,609,016
468.96% of 50 DAV
50 DAV is 343,100
|
$63.21
19.57%
|
12/14/2022
|
$32.41
|
PP = $33.72
|
|
MB = $35.41
|
 Most Recent Note - 8/8/2023 1:25:18 PM
G - Gapped up today for a considerable volume-driven gain and new all-time high. It is very extended from any sound base. Bullish action came after it reported Jun '23 quarterly earnings +37% on +13% sales revenues versus the year-ago period, a solid increase after the Mar '23 earnings were below the +25% minimum guideline (C criteria).
>>> FEATURED STOCK ARTICLE : Streak of Gains Lifts Sterling Infrastructure to New Highs - 7/3/2023 |
View all notes |
Set NEW NOTE alert |
Company Profile |
SEC
News |
Chart |
Request a new note
C
A
S
I |
FIX
-
NYSE
Comfort Systems USA
Bldg-A/C and Heating Prds
|
$181.04
|
-0.11
-0.06% |
$182.94
|
254,578
115.19% of 50 DAV
50 DAV is 221,000
|
$182.12
-0.59%
|
4/27/2023
|
$148.85
|
PP = $152.23
|
|
MB = $159.84
|
Most Recent Note - 8/7/2023 6:30:36 PM
G - Hit another new all-time high with light volume behind today's 4th consecutive gain. Its 50 DMA line ($163) defines important near-term support to watch on pullbacks. Reported Jun '23 quarterly earnings +65% on +27% versus the year-ago period.
>>> FEATURED STOCK ARTICLE : Pulled Back From High With Lighter Volume - 7/19/2023 |
View all notes |
Set NEW NOTE alert |
Company Profile |
SEC
News |
Chart |
Request a new note
C
A
S
I |
KOF
-
NYSE
Coca Cola Femsa Sab Ads
FOOD and BEVERAGE - Beverages - Soft Drinks
|
$81.00
|
-1.17
-1.42% |
$81.43
|
150,849
96.70% of 50 DAV
50 DAV is 156,000
|
$91.23
-11.21%
|
6/9/2023
|
$88.61
|
PP = $91.33
|
|
MB = $95.90
|
Most Recent Note - 8/2/2023 6:01:06 PM
G - Reported Jun '23 quarterly earnings +23% on +26% sales revenues versus the year-ago period, below the +25% minimum guideline (C criteria). Its Relative Strength Rating has slumped to 79 while meeting resistance and lingering below its 50 DMA line. A rebound above the 50 DMA line ($84.76) is needed for its outlook to improve.
>>> FEATURED STOCK ARTICLE : Slumping Below 50-Day Moving Average and Below Prior Low - 7/6/2023 |
View all notes |
Set NEW NOTE alert |
Company Profile |
SEC
News |
Chart |
Request a new note
C
A
S
I |
CLH
-
NYSE
Clean Harbors
Pollution Control
|
$170.79
|
+1.90
1.12% |
$171.23
|
391,860
98.46% of 50 DAV
50 DAV is 398,000
|
$174.10
-1.90%
|
3/10/2023
|
$136.89
|
PP = $136.74
|
|
MB = $143.58
|
Most Recent Note - 8/2/2023 5:59:00 PM
G - Hit a new all-time high today while trading higher volume but ending little changed. Reported earnings for the Jun '23 quarter -13% on +3% sales revenues versus the year ago period, below the +25% minimum earnings guideline (C criteria), raising fundamental concerns. , extended from any sound base. Its 50 DMA line ($159) defines important near-term support to watch on pullbacks.
>>> FEATURED STOCK ARTICLE : Negative Reversal at High After +26% Rally in 4 Months - 7/18/2023 |
View all notes |
Set NEW NOTE alert |
Company Profile |
SEC
News |
Chart |
Request a new note
C
A
S
I |
SPSC
-
NASDAQ
SPS Commerce
Comp Sftwr-Spec Enterprs
|
$167.64
|
-1.80
-1.06% |
$168.57
|
115,048
54.27% of 50 DAV
50 DAV is 212,000
|
$196.39
-14.64%
|
4/24/2023
|
$150.01
|
PP = $157.56
|
|
MB = $165.44
|
Most Recent Note - 8/2/2023 6:06:42 PM
G - Suffered a damaging loss and slumped further below its 50 DMA line ($177) and its color code is changed to green. A rebound above the 50 DMA line is needed for its outlook to improve. Reported Jun '23 quarterly earnings +30% on +19% sales revenues versus the year-ago period.
>>> FEATURED STOCK ARTICLE : Pulled Back Abruptly to 50-Day Moving Average Line - 7/24/2023 |
View all notes |
Set NEW NOTE alert |
Company Profile |
SEC
News |
Chart |
Request a new note
C
A
S
I |
Symbol/Exchange
Company Name
Industry Group |
PRICE |
CHANGE
(%Change) |
Day High |
Volume
(% DAV)
(% 50 day avg vol) |
52 Wk Hi
% From Hi |
Featured
Date |
Price
Featured |
Pivot Featured |
|
Max Buy |
HUBB
-
NYSE
Hubbell
Electrical-Power/Equipmt
|
$314.15
|
+4.42
1.43% |
$314.44
|
516,661
119.60% of 50 DAV
50 DAV is 432,000
|
$340.06
-7.62%
|
4/25/2023
|
$262.85
|
PP = $257.51
|
|
MB = $270.39
|
Most Recent Note - 8/4/2023 6:15:19 PM
G - Slumping further below its 50 DMA line ($315.72) with today's loss raising concerns. Fundamentals remain strong after Jun '23 earnings rose +45%. A rebound above the 50 DMA line is needed for its outlook to improve.
>>> FEATURED STOCK ARTICLE : Pulled Back Undercutting 50 Day Moving Average Line - 7/26/2023 |
View all notes |
Set NEW NOTE alert |
Company Profile |
SEC
News |
Chart |
Request a new note
C
A
S
I |
NVR
-
NYSE
N V R Inc
MATERIALS and CONSTRUCTION - Residential Construction
|
$6,348.76
|
-38.98
-0.61% |
$6,369.94
|
15,728
68.98% of 50 DAV
50 DAV is 22,800
|
$6,474.53
-1.94%
|
4/25/2023
|
$5,882.18
|
PP = $5,978.25
|
|
MB = $6,277.16
|
Most Recent Note - 8/7/2023 6:38:19 PM
G - Posted a 2nd consecutive gain today with below-average volume. Reported Jun '23 quarterly earnings -6% on -13% sales revenues raising greater fundamental concerns. Its 50 DMA line ($6,106) defines near-term support watch. See the latest FSU analysis for more details and a new annotated graph.
>>> FEATURED STOCK ARTICLE : Consolidating Above 50 DMA After 2nd Subpar Earnings Report - 8/7/2023 |
View all notes |
Set NEW NOTE alert |
Company Profile |
SEC
News |
Chart |
Request a new note
C
A
S
I |
PHM
-
NYSE
PulteGroup
Bldg-Resident/Comml
|
$86.01
|
+0.38
0.44% |
$86.12
|
1,499,837
54.78% of 50 DAV
50 DAV is 2,738,000
|
$86.01
0.00%
|
4/25/2023
|
$65.17
|
PP = $64.01
|
|
MB = $67.21
|
Most Recent Note - 8/7/2023 6:40:13 PM
G - Posted a gain today with below-average volume for a best-ever close. It is very extended from any sound base. Recently reported earnings +18% for the Jun '23 quarter versus the year-ago period, below the +25% minimum guideline (C criteria) raising concerns. Its 50 DMA line ($76.78) defines important support to watch.
>>> FEATURED STOCK ARTICLE : Reversed After Reaching a New All-Time High - 7/27/2023 |
View all notes |
Set NEW NOTE alert |
Company Profile |
SEC
News |
Chart |
Request a new note
C
A
S
I |
AMPH
-
NASDAQ
Amphastar Pharm
Medical-Biomed/Biotech
|
$65.00
|
+1.92
3.04% |
$65.53
|
436,462
102.22% of 50 DAV
50 DAV is 427,000
|
$64.58
0.65%
|
5/15/2023
|
$43.56
|
PP = $44.15
|
|
MB = $46.36
|
Most Recent Note - 8/8/2023 6:24:56 PM
G - Hit another new all-time high with volume near average behind today's gain. It has not formed a sound new base of sufficient length. Its 50 DMA line ($55.31) defines important support to watch. Fundamentals remain strong.
>>> FEATURED STOCK ARTICLE : 6th Straight Gain for Amphastar - 7/20/2023 |
View all notes |
Set NEW NOTE alert |
Company Profile |
SEC
News |
Chart |
Request a new note
C
A
S
I |
ANET
-
NYSE
Arista Networks
Computer-Networking
|
$180.45
|
+1.18
0.66% |
$181.46
|
2,110,322
56.59% of 50 DAV
50 DAV is 3,729,000
|
$190.65
-5.35%
|
8/1/2023
|
$188.84
|
PP = $178.46
|
|
MB = $187.38
|
Most Recent Note - 8/2/2023 6:04:28 PM
Y - Gapped down today negating a portion of the considerable volume-driven gain on the prior session and slumping near the prior high and pivot point. Color code was changed to yellow with new pivot point cited based on its 5/30/23 high plus 10 cents. Bullish action came after it reported Jun '23 quarterly earnings +40% on +39% sales revenues versus the year-ago period. Volume and volatility often increase near earnings news.
>>> FEATURED STOCK ARTICLE : Wedging Higher After Rebounding Above 50-Day Moving Average - 7/12/2023 |
View all notes |
Set NEW NOTE alert |
Company Profile |
SEC
News |
Chart |
Request a new note
C
A
S
I |
Symbol/Exchange
Company Name
Industry Group |
PRICE |
CHANGE
(%Change) |
Day High |
Volume
(% DAV)
(% 50 day avg vol) |
52 Wk Hi
% From Hi |
Featured
Date |
Price
Featured |
Pivot Featured |
|
Max Buy |
PANW
-
NASDAQ
Palo Alto Networks
Computer Sftwr-Security
|
$211.48
|
-3.76
-1.75% |
$212.90
|
7,532,331
116.74% of 50 DAV
50 DAV is 6,452,000
|
$258.88
-18.31%
|
6/5/2023
|
$228.35
|
PP = $213.73
|
|
MB = $224.42
|
Most Recent Note - 8/4/2023 6:12:42 PM
G - Gapped down today violating its 50 DMA line ($237.84) and undercutting the prior low ($131) triggering a technical sell signal. Fundamentals remain strong after it reported Jun '23 quarterly earnings +83% on +24% sales revenues versus the year ago period.
>>> FEATURED STOCK ARTICLE : Volume Cooling While Hovering Near High - 7/31/2023 |
View all notes |
Set NEW NOTE alert |
Company Profile |
SEC
News |
Chart |
Request a new note
C
A
S
I |
LSCC
-
NASDAQ
Lattice Semiconductor
Elec-Semicondctor Fablss
|
$91.10
|
-2.07
-2.22% |
$91.76
|
1,533,116
70.78% of 50 DAV
50 DAV is 2,166,000
|
$98.18
-7.21%
|
6/13/2023
|
$91.73
|
PP = $96.92
|
|
MB = $101.77
|
Most Recent Note - 8/7/2023 6:35:22 PM
Y - Still consolidating above its 50 DMA line ($88.82). More damaging losses would raise concerns and trigger a technical sell signal. Reported Jun '23 quarterly earnings +24% on +18% sales revenues versus the year-ago period, just below the +25% minimum earnings guideline (C criteria).
>>> FEATURED STOCK ARTICLE : Perched Near Pivot Point After Best-Ever Close - 7/17/2023 |
View all notes |
Set NEW NOTE alert |
Company Profile |
SEC
News |
Chart |
Request a new note
C
A
S
I |
XPEL
-
NASDAQ
XPEL
Auto/Truck-Replace Parts
|
$80.54
|
-0.91
-1.12% |
$81.38
|
72,975
56.57% of 50 DAV
50 DAV is 129,000
|
$87.46
-7.91%
|
6/28/2023
|
$83.14
|
PP = $87.11
|
|
MB = $91.47
|
Most Recent Note - 8/7/2023 6:43:31 PM
Y - Consolidating above its 50 DMA line ($79.50) with volume totals cooling. Stalled after recently hitting a new 52-week high. Due to report Jun '23 quarterly results on 8/09/23. Volume and volatility often increase near earnings news.
>>> FEATURED STOCK ARTICLE : Consolidating After Rebounding Above 50-Day Moving Average - 8/2/2023 |
View all notes |
Set NEW NOTE alert |
Company Profile |
SEC
News |
Chart |
Request a new note
C
A
S
I |
PII
-
NYSE
Polaris
Leisure-Products
|
$126.03
|
-2.79
-2.17% |
$127.50
|
668,898
108.06% of 50 DAV
50 DAV is 619,000
|
$138.49
-9.00%
|
7/11/2023
|
$126.92
|
PP = $123.97
|
|
MB = $130.17
|
Most Recent Note - 8/7/2023 6:41:36 PM
G - Pulled back today for a 3rd consecutive loss with near average volume. Reported Jun '23 quarterly earnings +0% versus the year-ago period, below the +25% minimum earnings guideline (C criteria). Prior highs define initial support to watch coinciding with its 50 DMA line ($123).
>>> FEATURED STOCK ARTICLE : Volume-Driven Breakout for Polaris - 7/11/2023 |
View all notes |
Set NEW NOTE alert |
Company Profile |
SEC
News |
Chart |
Request a new note
C
A
S
I |
ALGM
-
NASDAQ
Allegro MicroSystems
Elec-Semicondctor Fablss
|
$41.34
|
-0.70
-1.67% |
$41.68
|
2,335,178
150.66% of 50 DAV
50 DAV is 1,550,000
|
$53.05
-22.07%
|
7/13/2023
|
$49.86
|
PP = $48.82
|
|
MB = $51.26
|
Most Recent Note - 8/8/2023 6:23:50 PM
G - Volume was above average behind today's 6th consecutive loss. A rebound above the 50 DMA line ($44.12) is needed for its outlook to improve. Reported Jun '23 quarterly earnings +63% versus the year-ago period. Volume and volatility often increase near earnings news. Disciplined investors always limit losses by selling any stock that falls more than -8% from their purchase price.
>>> FEATURED STOCK ARTICLE : Volume Heavy Behind Considerable Breakout Gain - 7/13/2023 |
View all notes |
Set NEW NOTE alert |
Company Profile |
SEC
News |
Chart |
Request a new note
C
A
S
I |
Symbol/Exchange
Company Name
Industry Group |
PRICE |
CHANGE
(%Change) |
Day High |
Volume
(% DAV)
(% 50 day avg vol) |
52 Wk Hi
% From Hi |
Featured
Date |
Price
Featured |
Pivot Featured |
|
Max Buy |
ESQ
-
NASDAQ
Esquire Finl Hldgs
Finance-Commercial Loans
|
$51.72
|
+0.05
0.10% |
$51.97
|
13,470
46.45% of 50 DAV
50 DAV is 29,000
|
$54.03
-4.28%
|
7/14/2023
|
$45.80
|
PP = $48.23
|
|
MB = $50.64
|
Most Recent Note - 8/7/2023 6:28:29 PM
G - Color code is changed to green after rising above its "max buy" level with 4 consecutive gains. Prior highs in the $47 define initial support above its 50 DMA line.
>>> FEATURED STOCK ARTICLE : Esquire Perched Near Prior Highs - 7/14/2023 |
View all notes |
Set NEW NOTE alert |
Company Profile |
SEC
News |
Chart |
Request a new note
C
A
S
I |
MEDP
-
NASDAQ
Medpace Holdings
Medical-Research Eqp/Svc
|
$263.16
|
+2.77
1.06% |
$264.14
|
202,953
52.58% of 50 DAV
50 DAV is 386,000
|
$264.19
-0.39%
|
7/25/2023
|
$196.32
|
PP = $241.57
|
|
MB = $253.65
|
Most Recent Note - 8/7/2023 6:36:54 PM
Y - Posted a small gain with below-average volume today for a 3rd consecutive session, wedging to a new all-time high. Prior highs in the $241 area define support to watch on pullbacks. Reported earnings increases above the +25% minimum earnings guideline (C criteria) in the past 5 quarterly comparisons through Jun '23.
>>> FEATURED STOCK ARTICLE : Medpace Posted a Solid Volume-Driven Gain for a New High - 7/25/2023 |
View all notes |
Set NEW NOTE alert |
Company Profile |
SEC
News |
Chart |
Request a new note
C
A
S
I |
COKE
-
NASDAQ
Coca-Cola Consolidated
Beverages-Non-Alcoholic
|
$703.57
|
-9.59
-1.34% |
$715.78
|
33,393
77.66% of 50 DAV
50 DAV is 43,000
|
$731.90
-3.87%
|
8/3/2023
|
$718.56
|
PP = $694.30
|
|
MB = $729.02
|
Most Recent Note - 8/3/2023 6:04:46 PM
Y - Finished strong after highlighted in yellow with pivot point cited based on its 5/04/23 high plus 10 cents in the earlier mid-day report. Reported Jun '23 quarterly earnings +54% on +9% sales revenues versus the year-ago period, continuing its strong track record. Hitting a new 52-week high with today's big volume-driven gain triggering a technical buy signal, rebounding from below its 50 DMA line ($650). See the latest FSU analysis for more details and an annotated graph.
>>> FEATURED STOCK ARTICLE : Powerful Breakout for COKE - 8/3/2023 |
View all notes |
Set NEW NOTE alert |
Company Profile |
SEC
News |
Chart |
Request a new note
C
A
S
I |
ACLS
-
NASDAQ
Axcelis Technologies
Elec-Semiconductor Equip
|
$177.33
|
-3.51
-1.94% |
$179.13
|
514,960
92.45% of 50 DAV
50 DAV is 557,000
|
$201.00
-11.78%
|
8/4/2023
|
$181.59
|
PP = $201.10
|
|
MB = $211.16
|
Most Recent Note - 8/7/2023 6:45:59 PM
Y - Posted a gain today with lighter volume, finding support at its 50 DMA line ($175). Pivot point cited is based on its 8/01/23 high plus 10 cents after it formed an advanced "ascending base" pattern. Subsequent gains above the pivot point backed by at least +40% above average volume may trigger a technical buy signal. Reported Jun '23 quarterly earnings +41% on +24% sales revenues versus the year-ago period, and 3 of the past 4 quarterly comparisons were above the +25% minimum earnings guideline (C criteria). There was a downturn in FY '19 annual earnings (A criteria) history followed by strong growth.
>>> FEATURED STOCK ARTICLE : Formed Ascending Base and Now Testing 50-Day Moving Average - 8/4/2023 |
View all notes |
Set NEW NOTE alert |
Company Profile |
SEC
News |
Chart |
Request a new note
C
A
S
I |
PLUS
-
NASDAQ
ePlus
Computer-Tech Services
|
$66.70
|
+8.80
15.20% |
$75.90
|
379,459
303.57% of 50 DAV
50 DAV is 125,000
|
$75.90
-12.12%
|
8/8/2023
|
$67.60
|
PP = $62.92
|
|
MB = $66.07
|
Most Recent Note - 8/8/2023 6:21:15 PM
Y - Finished in the lower half of its intra-day range today after highlighted in yellow with pivot point cited based on its may '22 high plus 10 cents. A "breakaway gap" helped it hit a new all-time high with +202% above average volume triggering a technical buy signal. Reported earnings +42% on +25% sales revenues for the Jun '23 quarter versus the year ago period, its 3rd consecutive quarterly earnings increase above the +25% minimum guideline (C criteria) helping iot better match the winning models of the fact-based investment system. Annual earnings growth (A criteria) has been strong. See the latest FSU analysis for more details and a new annotated graph.
>>> FEATURED STOCK ARTICLE : ePLUS Gapped Up but Ended in Lower Half of Intra-Day Range - 8/8/2023 |
View all notes |
Set NEW NOTE alert |
Company Profile |
SEC
News |
Chart |
Request a new note
C
A
S
I |
Symbol/Exchange
Company Name
Industry Group |
PRICE |
CHANGE
(%Change) |
Day High |
Volume
(% DAV)
(% 50 day avg vol) |
52 Wk Hi
% From Hi |
Featured
Date |
Price
Featured |
Pivot Featured |
|
Max Buy |
|
|
|
THESE ARE NOT BUY RECOMMENDATIONS!
Comments contained in the body of this report are technical
opinions only. The material herein has been obtained
from sources believed to be reliable and accurate, however,
its accuracy and completeness cannot be guaranteed.
This site is not an investment advisor, hence it does
not endorse or recommend any securities or other investments.
Any recommendation contained in this report may not
be suitable for all investors and it is not to be deemed
an offer or solicitation on our part with respect to
the purchase or sale of any securities. All trademarks,
service marks and trade names appearing in this report
are the property of their respective owners, and are
likewise used for identification purposes only.
This report is a service available
only to active Paid Premium Members.
You may opt-out of receiving report notifications
at any time. Questions or comments may be submitted
by writing to Premium Membership Services 665 S.E. 10 Street, Suite 201 Deerfield Beach, FL 33441-5634 or by calling 1-800-965-8307
or 954-785-1121.
|
|
|