You are not logged in.
This means you
CAN ONLY VIEW reports that were published prior to Thursday, March 20, 2025.
You
MUST UPGRADE YOUR MEMBERSHIP if you want to see any current reports.
AFTER MARKET UPDATE - THURSDAY, JULY 6TH, 2023
Previous After Market Report Next After Market Report >>>
|
|
|
|
DOW |
-366.38 |
33,922.26 |
-1.07% |
|
Volume |
900,860,546 |
+6% |
|
Volume |
6,134,067,100 |
+11% |
|
NASDAQ |
-112.61 |
13,679.04 |
-0.82% |
|
Advancers |
433 |
15% |
|
Advancers |
1,023 |
23% |
|
S&P 500 |
-35.23 |
4,411.59 |
-0.79% |
|
Decliners |
2,454 |
85% |
|
Decliners |
3,380 |
77% |
|
Russell 2000 |
-30.67 |
1,842.23 |
-1.64% |
|
52 Wk Highs |
26 |
|
|
52 Wk Highs |
37 |
|
|
S&P 600 |
-17.55 |
1,187.92 |
-1.46% |
|
52 Wk Lows |
31 |
|
|
52 Wk Lows |
140 |
|
|
 |
Breadth Negative as Leadership Waned and Major Indices Fell
Kenneth J. Gruneisen - Passed the CAN SLIM® Master's Exam
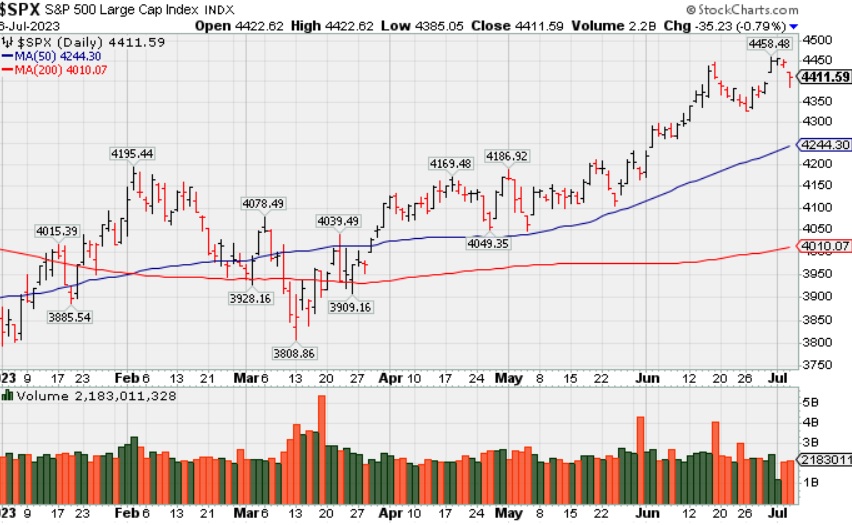
The major indices all registered losses, yet they were able to rebound from intraday lows. The S&P 500, Nasdaq Composite, and Dow Jones Industrial Average had been down as much as 1.4%, 1.6%, and 1.5%, respectively. By the close, their losses ranged from 0.8% to 1.1%. The volume totals reported were higher on the NYSE and on the Nasdaq exchange versus the prior session. Breadth was negative as decliners led advancers by almost a 6-1 margin on the NYSE and by more than a 3-1 margin on the Nasdaq exchange. Leadership thinned as there were 7 high-ranked companies from the Leaders List that hit a new 52-week high and were listed on the BreakOuts Page, versus the total of 21 on the prior session. New 52-week lows totals expanded and outnumbered shrinking new 52-week highs totals on the NYSE and on the Nasdaq exchange. The major indices are in a confirmed uptrend (M criteria). Appropriate new buying efforts may be considered under the fact-based investment system.
PICTURED: The S&P 500 Index pulled back from its 2023 high.
All 11 S&P 500 sectors and 28 of the 30 Dow components closed with losses. Apple (AAPL +0.3%) and Microsoft (MSFT +0.9%) were the lone outperformers to close with a gain from the DJIA.
Rising market rates, the biggest factor driving the market's retreat, created a reason to take more money off the table. The 2-yr note yield rose seven basis points to 5.01% and the 10-yr note yield rose 10 basis points to 4.04%. Those moves were in response to this morning's strong labor data and the stronger-than-expected ISM Non-Manufacturing Index for June.
ADP estimated that 497,000 jobs were added to private sector payrolls in June. According to the CME FedWatch Tool, the probability of a second rate hike in September jumped to 27.7% from 18.1% and the probability of a rate hike in November jumped to 46.7% from 35.9%.
The weekly MBA Mortgage Applications Index fell 4.4% with purchase applications dropping 5.0% and refinance applications falling 4.0%. According to ADP, private sector hiring increased by 497,000 in June following a downwardly revised 267,000 (from 278,000) in May. Separately, initial jobless claims for the week ending July 1 increased by 12,000 to 248,000. Continuing jobless claims for the week ending June 24 decreased by 13,000 to 1.720 million.
The May Trade Balance Report showed a narrowing in the trade deficit to $69.0 billion from an upwardly revised $74.4 billion (from -$74.6 billion) in April. The final IHS Markit Services PMI reading for June fell to 54.4 from 54.9. JOLTS - Job Openings totaled 9.824 million in May following a revised count of 10.320 million in April (from 10.103 million). The ISM Non-Manufacturing Index for June checked in at 53.9%, increasing from 50.3% in May. |
 Kenneth J. Gruneisen started out as a licensed stockbroker in August 1987, a couple of months prior to the historic stock market crash that took the Dow Jones Industrial Average down -22.6% in a single day. He has published daily fact-based fundamental and technical analysis on high-ranked stocks online for two decades. Through FACTBASEDINVESTING.COM, Kenneth provides educational articles, news, market commentary, and other information regarding proven investment systems that work in good times and bad.
Comments contained in the body of this report are technical opinions only and are not necessarily those of Gruneisen Growth Corp. The material herein has been obtained from sources believed to be reliable and accurate, however, its accuracy and completeness cannot be guaranteed. Our firm, employees, and customers may effect transactions, including transactions contrary to any recommendation herein, or have positions in the securities mentioned herein or options with respect thereto. Any recommendation contained in this report may not be suitable for all investors and it is not to be deemed an offer or solicitation on our part with respect to the purchase or sale of any securities. |
|
 |
Retail, Financial, Tech, and Commodity-Linked Groups Fell
Kenneth J. Gruneisen - Passed the CAN SLIM® Master's Exam
The Bank Index ($BKX -1.57%), Broker/Dealer Index ($XBD 1.54%), and the Retail Index ($RLX -1.69%) ended unanimously lower. The tech sector had a negative bias as the Semiconductor Index ($SOX -1.24%), Networking Index ($NWX -0.96%), and Biotech Index ($BTK -1.14%) each lost ground. The Gold & Silver Index ($XAU -2,46%), Integrated Oil Index ($XOI -2.59%) and the Oil Services Index ($OSX -1.34%) rounded out the widely negative session with losses.
PICTURED: The Semiconductor Index ($SOX -1.24%) is consolidating near prior lows and still well above its 50-day moving average (DMA) line.
| Oil Services |
$OSX |
78.75 |
-1.07 |
-1.34% |
-6.10% |
| Integrated Oil |
$XOI |
1,630.03 |
-43.39 |
-2.59% |
-8.80% |
| Semiconductor |
$SOX |
3,577.49 |
-44.83 |
-1.24% |
+41.28% |
| Networking |
$NWX |
844.38 |
-8.39 |
-0.98% |
+7.80% |
| Broker/Dealer |
$XBD |
465.78 |
-7.29 |
-1.54% |
+3.71% |
| Retail |
$RLX |
3,415.08 |
-58.67 |
-1.69% |
+24.00% |
| Gold & Silver |
$XAU |
115.68 |
-2.91 |
-2.46% |
-4.28% |
| Bank |
$BKX |
79.63 |
-1.27 |
-1.57% |
-21.04% |
| Biotech |
$BTK |
5,162.35 |
-59.71 |
-1.14% |
-2.25% |
|
|
|
 |
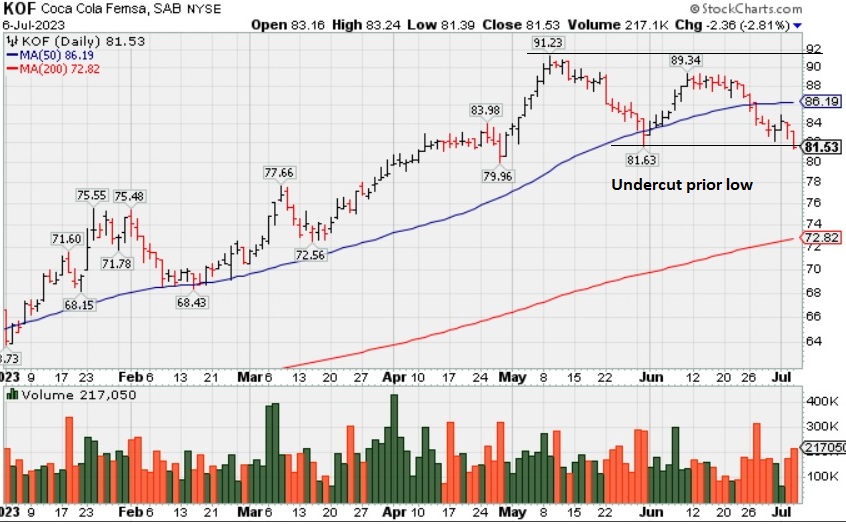
Slumping Below 50-Day Moving Average and Below Prior Low
Kenneth J. Gruneisen - Passed the CAN SLIM® Master's Exam
Coca Cola Femsa Sab Ads (KOF -$1.65 or -1.96% to $82.25) edged lower today, slumping further below its 50-day moving average (DMA) line ($86.31) and undercutting the recent lows in the $81.63 on 5/31/23) raising greater concerns. A rebpund above the 50 day moving average is needed for its outlook to improve.
KOF was highlighted in yellow with pivot point cited based on its 1/24/23 high plus 10 cents in the 3/07/23 mid-day report (read here). It was last shown in great detail on 6/09/23 with an annotated graph under the headline "Coca-Cola Femsa Posts 7th Consecutive Gain". It reported Mar '23 quarterly earnings +53% on +24% sales revenues versus the year-ago period, its 4th quarterly earnings increase above the +25% minimum guideline (C criteria) backed by strong sales revenues growth.. KOF has a 96 Earnings Per Share Rating. Annal earnings had a downturn in FY '20 like many companies during the pandemic.
It hails from the Beverages - Non-Alcoholic group which is currently ranked 26th on the 197 Industry Groups list. There are 857.1 million shares in the public float (S criteria). The number of top-rated funds owning its shares rose from 120 in Mar '22 to 180 in Mar '23, a reassuring sign concerning the I criteria. Its current Up/Down Volume Ratio of 0.8 is an unbiased indication its shares have been under slight distributional pressure over the past 50 days.
|
|
|
Color Codes Explained :
Y - Better candidates highlighted by our
staff of experts.
G - Previously featured
in past reports as yellow but may no longer be buyable under the
guidelines.
***Last / Change / Volume data in this table is the closing quote data***
Symbol/Exchange
Company Name
Industry Group |
PRICE |
CHANGE
(%Change) |
Day High |
Volume
(% DAV)
(% 50 day avg vol) |
52 Wk Hi
% From Hi |
Featured
Date |
Price
Featured |
Pivot Featured |
|
Max Buy |
 STRL
-
NASDAQ
STRL
-
NASDAQ
Sterling Infrastructure
Bldg-Heavy Construction
|
$56.46
|
-1.98
-3.39% |
$58.18
|
518,029
171.53% of 50 DAV
50 DAV is 302,000
|
$59.43
-5.00%
|
12/14/2022
|
$32.41
|
PP = $33.72
|
|
MB = $35.41
|
 Most Recent Note - 7/6/2023 4:57:34 PM
G - Pulled back today following 6 consecutive gains for new all-time highs, very extended from any sound base. Mar '23 quarterly earnings were below the +25% minimum guideline (C criteria) raising fundamental concerns.
>>> FEATURED STOCK ARTICLE : Streak of Gains Lifts Sterling Infrastructure to New Highs - 7/3/2023 |
View all notes |
Set NEW NOTE alert |
Company Profile |
SEC
News |
Chart |
Request a new note
C
A
S
I |
FIX
-
NYSE
Comfort Systems USA
Bldg-A/C and Heating Prds
|
$159.77
|
-2.14
-1.32% |
$161.67
|
163,263
59.37% of 50 DAV
50 DAV is 275,000
|
$167.53
-4.63%
|
4/27/2023
|
$148.85
|
PP = $152.23
|
|
MB = $159.84
|
Most Recent Note - 6/27/2023 5:37:17 PM
G - Volume totals have been cooling while hovering near its all-time high. Extended from the prior base and no resistance remains due to overhead supply. Prior highs in the $152-156 area define initial support to watch above its 50 DMA line ($150.54).
>>> FEATURED STOCK ARTICLE : "Negative Reversal" Following Recent Volume-Driven Gains - 6/16/2023 |
View all notes |
Set NEW NOTE alert |
Company Profile |
SEC
News |
Chart |
Request a new note
C
A
S
I |
KOF
-
NYSE
Coca-Cola Femsa ADR
Beverages-Non-Alcoholic
|
$81.53
|
-2.36
-2.81% |
$83.24
|
217,051
124.74% of 50 DAV
50 DAV is 174,000
|
$91.23
-10.63%
|
6/9/2023
|
$88.61
|
PP = $91.33
|
|
MB = $95.90
|
Most Recent Note - 7/6/2023 4:59:49 PM
G - Today's loss undercut the prior low ($81.63 on 5/31/23) raising greater concerns. A prompt rebound above the 50 DMA line ($86.31) is needed for its outlook to improve. Fundamentals remain strong.
>>> FEATURED STOCK ARTICLE : Slumping Below 50-Day Moving Average and Below Prior Low - 7/6/2023 |
View all notes |
Set NEW NOTE alert |
Company Profile |
SEC
News |
Chart |
Request a new note
C
A
S
I |
CLH
-
NYSE
Clean Harbors
Pollution Control
|
$164.20
|
-0.82
-0.50% |
$165.55
|
320,973
81.47% of 50 DAV
50 DAV is 394,000
|
$165.88
-1.01%
|
3/10/2023
|
$136.89
|
PP = $136.74
|
|
MB = $143.58
|
Most Recent Note - 6/27/2023 5:36:07 PM
G - Volume totals have cooled while hovering near its all-time high, extended from any sound base. Its 50 DMA line ($146.56) and prior high define important near-term support to watch on pullbacks. Fundamentals remain strong.
>>> FEATURED STOCK ARTICLE : Extended From Any Sound Base and Hovering Near High - 6/15/2023 |
View all notes |
Set NEW NOTE alert |
Company Profile |
SEC
News |
Chart |
Request a new note
C
A
S
I |
SPSC
-
NASDAQ
SPS Commerce
Comp Sftwr-Spec Enterprs
|
$186.00
|
-4.08
-2.15% |
$188.51
|
231,266
127.07% of 50 DAV
50 DAV is 182,000
|
$192.67
-3.46%
|
4/24/2023
|
$150.01
|
PP = $157.56
|
|
MB = $165.44
|
Most Recent Note - 6/28/2023 5:13:52 PM
G - Volume was +46% above average behind today's gain while hitting another new 52-week high, getting very extended from the previously noted base. Reported Mar '23 quarterly earnings +22% on +20% versus the year-ago period, below the +25% minimum earnings guideline (C criteria) raising some fundamental concerns.
>>> FEATURED STOCK ARTICLE : Perched Near High Following Noted Volume-Driven Gains - 6/21/2023 |
View all notes |
Set NEW NOTE alert |
Company Profile |
SEC
News |
Chart |
Request a new note
C
A
S
I |
Symbol/Exchange
Company Name
Industry Group |
PRICE |
CHANGE
(%Change) |
Day High |
Volume
(% DAV)
(% 50 day avg vol) |
52 Wk Hi
% From Hi |
Featured
Date |
Price
Featured |
Pivot Featured |
|
Max Buy |
HUBB
-
NYSE
Hubbell
Electrical-Power/Equipmt
|
$326.37
|
-1.28
-0.39% |
$330.16
|
364,131
84.29% of 50 DAV
50 DAV is 432,000
|
$332.76
-1.92%
|
4/25/2023
|
$262.85
|
PP = $257.51
|
|
MB = $270.39
|
Most Recent Note - 6/28/2023 5:10:08 PM
G - Churning above-average volume while recently hovering near its all-time high, very extended from the prior base. Its 50 DMA line ($284) defines initial support to watch on pullbacks. Fundamentals remain strong.
>>> FEATURED STOCK ARTICLE : Hubbell on Track for 11th Weekly Gain - 6/22/2023 |
View all notes |
Set NEW NOTE alert |
Company Profile |
SEC
News |
Chart |
Request a new note
C
A
S
I |
NVR
-
NYSE
NVR
Bldg-Resident/Comml
|
$6,081.20
|
-149.83
-2.40% |
$6,193.29
|
27,791
115.80% of 50 DAV
50 DAV is 24,000
|
$6,386.62
-4.78%
|
4/25/2023
|
$5,882.18
|
PP = $5,978.25
|
|
MB = $6,277.16
|
Most Recent Note - 7/6/2023 5:02:25 PM
G - Pulled back from its all-time high with today's 3rd consecutive loss. Its 50 DMA line ($5,886) defines near-term support watch on pullbacks.
>>> FEATURED STOCK ARTICLE : New High Close for Strong Homebuilder - 6/30/2023 |
View all notes |
Set NEW NOTE alert |
Company Profile |
SEC
News |
Chart |
Request a new note
C
A
S
I |
PHM
-
NYSE
PulteGroup
Bldg-Resident/Comml
|
$75.01
|
-2.11
-2.74% |
$76.29
|
3,157,414
105.25% of 50 DAV
50 DAV is 3,000,000
|
$79.15
-5.23%
|
4/25/2023
|
$65.17
|
PP = $64.01
|
|
MB = $67.21
|
Most Recent Note - 7/6/2023 5:03:23 PM
G - Pulling back from its all-time high after getting very extended from any sound base. Reported earnings +28% for the Mar '23 quarter versus the year-ago period. Important support to watch is defined by its 50 DMA line ($70.51).
>>> FEATURED STOCK ARTICLE : Negative Reversal After Hitting Another New High - 6/26/2023 |
View all notes |
Set NEW NOTE alert |
Company Profile |
SEC
News |
Chart |
Request a new note
C
A
S
I |
COKE
-
NASDAQ
Coca-Cola Consolidated
Beverages-Non-Alcoholic
|
$639.58
|
-5.94
-0.92% |
$644.71
|
17,392
43.48% of 50 DAV
50 DAV is 40,000
|
$694.20
-7.87%
|
5/4/2023
|
$646.66
|
PP = $656.21
|
|
MB = $689.02
|
Most Recent Note - 7/3/2023 4:10:16 PM
Y - Consolidating near its 50 DMA line ($640). More damaging losses would raise concerns and trigger technical sell signals. Fundamentals remain strong.
>>> FEATURED STOCK ARTICLE : Fell Below Pivot Point With Recent Volume-Driven Losses - 6/14/2023 |
View all notes |
Set NEW NOTE alert |
Company Profile |
SEC
News |
Chart |
Request a new note
C
A
S
I |
AMPH
-
NASDAQ
Amphastar Pharm
Medical-Biomed/Biotech
|
$57.18
|
-0.52
-0.90% |
$58.19
|
397,859
83.58% of 50 DAV
50 DAV is 476,000
|
$58.80
-2.76%
|
5/15/2023
|
$43.56
|
PP = $44.15
|
|
MB = $46.36
|
Most Recent Note - 6/30/2023 5:39:45 PM
G - Posted a gain today with below-average volume for a 2nd-best-ever close. Very extended from any sound base. Its 50 DMA line ($45.23) and prior highs in the $44 area define important support to watch on pullbacks. Fundamentals remain strong.
>>> FEATURED STOCK ARTICLE : Hit Another New High With 4th Consecutive Volume-Driven Gain - 6/20/2023 |
View all notes |
Set NEW NOTE alert |
Company Profile |
SEC
News |
Chart |
Request a new note
C
A
S
I |
Symbol/Exchange
Company Name
Industry Group |
PRICE |
CHANGE
(%Change) |
Day High |
Volume
(% DAV)
(% 50 day avg vol) |
52 Wk Hi
% From Hi |
Featured
Date |
Price
Featured |
Pivot Featured |
|
Max Buy |
ANET
-
NYSE
Arista Networks
Computer-Networking
|
$158.90
|
-0.78
-0.49% |
$159.65
|
1,384,864
37.64% of 50 DAV
50 DAV is 3,679,000
|
$178.36
-10.91%
|
5/30/2023
|
$176.35
|
PP = $171.54
|
|
MB = $180.12
|
Most Recent Note - 6/27/2023 5:32:56 PM
G - Rebounded above its 50 DMA line ($152.81) with below-average volume behind today's 2nd consecutive gain helping its outlook improve. Faces near-term resistance due to overhead supply up to the $178 level. Fundamentals remain strong.
>>> FEATURED STOCK ARTICLE : Rebounding Near Recent High With 3 Consecutive Gains - 6/12/2023 |
View all notes |
Set NEW NOTE alert |
Company Profile |
SEC
News |
Chart |
Request a new note
C
A
S
I |
PANW
-
NASDAQ
Palo Alto Networks
Computer Sftwr-Security
|
$253.40
|
-4.48
-1.74% |
$255.54
|
3,123,350
50.58% of 50 DAV
50 DAV is 6,175,000
|
$258.88
-2.12%
|
6/5/2023
|
$228.35
|
PP = $213.73
|
|
MB = $224.42
|
Most Recent Note - 6/27/2023 5:29:16 PM
G - Hit another new all-time high with today's gain. Very extended from the prior high ($213) which defines initial support to watch on pullbacks. Fundamentals remain strong. See the latest FSU analysis for more details and a new annotated graph.
>>> FEATURED STOCK ARTICLE : Strength Continues for Network Security Leader - 6/27/2023 |
View all notes |
Set NEW NOTE alert |
Company Profile |
SEC
News |
Chart |
Request a new note
C
A
S
I |
LSCC
-
NASDAQ
Lattice Semiconductor
Elec-Semicondctor Fablss
|
$91.76
|
-1.55
-1.66% |
$91.82
|
1,531,362
60.34% of 50 DAV
50 DAV is 2,538,000
|
$97.27
-5.66%
|
6/13/2023
|
$91.73
|
PP = $96.92
|
|
MB = $101.77
|
Most Recent Note - 6/30/2023 5:41:52 PM
Y - Posted a 5th consecutive gain today backed by below-average volume and managed a best-ever close. Its 50 DMA line ($84.55) defines near-term support to watch. Subsequent gains above the pivot point backed by at least +40% above average volume may trigger a technical buy signal. Reported Mar '23 quarterly earnings +38% on +22% sales revenues versus the year-ago period, its 9th consecutive strong quarterly comparison above the +25% minimum earnings guideline (C criteria). Annual earnings history (A criteria) has been strong.
>>> FEATURED STOCK ARTICLE : Lattice Posts Volume-Driven Gains Approaching Prior High - 6/13/2023 |
View all notes |
Set NEW NOTE alert |
Company Profile |
SEC
News |
Chart |
Request a new note
C
A
S
I |
XPEL
-
NASDAQ
XPEL
Auto/Truck-Replace Parts
|
$83.67
|
-0.35
-0.42% |
$84.56
|
105,483
81.14% of 50 DAV
50 DAV is 130,000
|
$87.01
-3.84%
|
6/28/2023
|
$83.14
|
PP = $87.11
|
|
MB = $91.47
|
Most Recent Note - 6/28/2023 5:04:54 PM
Y - Color code was changed to yellow with pivot point cited based on its 8/15/23 high plus 10 cents when featured in the earlier mid-day report. Perched within striking distance of its 52-week high after an orderly 10-month base. Reported Mar '23 quarterly earnings +46% on +19% sales revenues versus the year ago period, its 3rd quarterly comparison above the +25% minimum earnings guideline (C criteria), helping it better match the winning models of the fact-based investment system. Annual earnings growth remained strong while it went through a deep consolidation since dropped from the Featured Stocks list on 8/13/21. See the latest FSU analysis for more details and a new annotated graph.
>>> FEATURED STOCK ARTICLE : XPEL Returns to Featured Stocks List After Long Consolidation - 6/28/2023 |
View all notes |
Set NEW NOTE alert |
Company Profile |
SEC
News |
Chart |
Request a new note
C
A
S
I |
|
|
|
THESE ARE NOT BUY RECOMMENDATIONS!
Comments contained in the body of this report are technical
opinions only. The material herein has been obtained
from sources believed to be reliable and accurate, however,
its accuracy and completeness cannot be guaranteed.
This site is not an investment advisor, hence it does
not endorse or recommend any securities or other investments.
Any recommendation contained in this report may not
be suitable for all investors and it is not to be deemed
an offer or solicitation on our part with respect to
the purchase or sale of any securities. All trademarks,
service marks and trade names appearing in this report
are the property of their respective owners, and are
likewise used for identification purposes only.
This report is a service available
only to active Paid Premium Members.
You may opt-out of receiving report notifications
at any time. Questions or comments may be submitted
by writing to Premium Membership Services 665 S.E. 10 Street, Suite 201 Deerfield Beach, FL 33441-5634 or by calling 1-800-965-8307
or 954-785-1121.
|
|
|