You are not logged in.
This means you
CAN ONLY VIEW reports that were published prior to Thursday, March 20, 2025.
You
MUST UPGRADE YOUR MEMBERSHIP if you want to see any current reports.
AFTER MARKET UPDATE - THURSDAY, JULY 13TH, 2023
Previous After Market Report Next After Market Report >>>
|
|
|
|
DOW |
+47.71 |
34,395.14 |
+0.14% |
|
Volume |
835,589,664 |
-5% |
|
Volume |
5,198,892,400 |
-1% |
|
NASDAQ |
+219.61 |
14,138.57 |
+1.58% |
|
Advancers |
2,052 |
71% |
|
Advancers |
2,919 |
65% |
|
S&P 500 |
+37.88 |
4,510.04 |
+0.85% |
|
Decliners |
851 |
29% |
|
Decliners |
1,552 |
35% |
|
Russell 2000 |
+17.51 |
1,950.89 |
+0.91% |
|
52 Wk Highs |
161 |
|
|
52 Wk Highs |
274 |
|
|
S&P 600 |
+7.75 |
1,247.60 |
+0.63% |
|
52 Wk Lows |
12 |
|
|
52 Wk Lows |
47 |
|
|
 |
Breadth Positive as Major Indices Rose with Lighter Volume Totals
Kenneth J. Gruneisen - Passed the CAN SLIM® Master's Exam
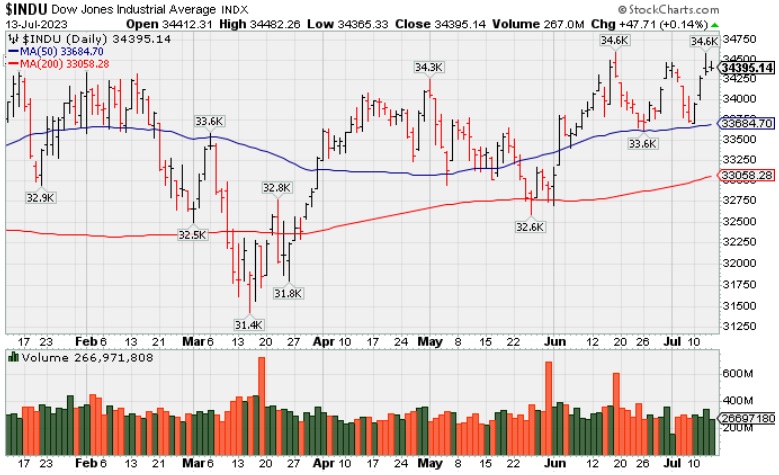
The S&P 500, which closed above 4,500, and the Nasdaq Composite ultimately settled near their highs of the day while the Dow Jones Industrial Average lagged. The volume totals reported were lighter on the NYSE and on the Nasdaq exchange versus the prior session, indicative of less aggressive institutional buying demand. Breadth was solidly positive as advancers led decliners by a 5-2 margin on the NYSE and by almost a 2-1 margin on the Nasdaq exchange. Leadership remained strong as there were 84 high-ranked companies from the Leaders List that hit a new 52-week high and were listed on the BreakOuts Page, versus the total of 105 on the prior session. New 52-week highs totals solidly outnumbered new 52-week lows totals on the NYSE and on the Nasdaq exchange. The major indices are in a confirmed uptrend (M criteria). Appropriate new buying efforts may be considered under the fact-based investment system.
PICTURED: The Dow Jones Industrial Average posted a 4th consecutive gain and is perched at its 2023 high.
Thursday was another strong day for stocks. Mega caps gains boosted index performance, but many stocks participated in the rally. Belief that the economy can avoid a hard landing and that the Fed is close to being done raising rates was supported by better-than-expected economic data on the heels of Wednesday's cooler-than-expected CPI report. The Producer Price Index for final demand increased 0.1% month-over-month in June following a downwardly revised 0.4% decline (from -0.3%) in May. Initial jobless claims for the week ending July 8 decreased by 12,000 to 237,000 while continuing jobless claims for the week ending July 1 increased by 11,000 to 1.729 million.
Treasuries built on their post-CPI gains as the 2-yr note yield dropped 12 basis points to 4.61% and the 10-yr note yield fell 10 basis points to 3.76%. The U.S. Dollar Index slipped below 100.00, falling 0.7% to 99.78.
Positive sentiment was also helped by the better-than-expected results and guidance from Delta Air Lines (DAL -0.5%) and PepsiCo (PEP +2.4%). Exxon Mobil (XOM -1.8%) announced plans to acquire Denbury (DEN -1.3%) in an all-stock transaction.
Semiconductor stocks and small caps were clear pockets of strength today, reflecting the market's positive economic outlook. The PHLX Semiconductor Index rose 2.4% and the Russell 2000 rose 0.9%.
Bank stocks also assumed a leadership position in front of earnings reports from JPMorgan Chase (JPM +0.5%), Wells Fargo (WFC +1.0%), Citigroup (C +0.6%), and others due pre-open on Friday.
Only two of the 11 S&P 500 sectors registered losses, Energy (-0.5%) and Healthcare (-0.01%). Communication services (+2.3%), information technology (+1.5%), and consumer discretionary (+1.1%) sectors were top gainers.
|
 Kenneth J. Gruneisen started out as a licensed stockbroker in August 1987, a couple of months prior to the historic stock market crash that took the Dow Jones Industrial Average down -22.6% in a single day. He has published daily fact-based fundamental and technical analysis on high-ranked stocks online for two decades. Through FACTBASEDINVESTING.COM, Kenneth provides educational articles, news, market commentary, and other information regarding proven investment systems that work in good times and bad.
Comments contained in the body of this report are technical opinions only and are not necessarily those of Gruneisen Growth Corp. The material herein has been obtained from sources believed to be reliable and accurate, however, its accuracy and completeness cannot be guaranteed. Our firm, employees, and customers may effect transactions, including transactions contrary to any recommendation herein, or have positions in the securities mentioned herein or options with respect thereto. Any recommendation contained in this report may not be suitable for all investors and it is not to be deemed an offer or solicitation on our part with respect to the purchase or sale of any securities. |
|
 |
Financial, Retail, Semiconductor, and Commodity-Linked Groups Rose
Kenneth J. Gruneisen - Passed the CAN SLIM® Master's Exam
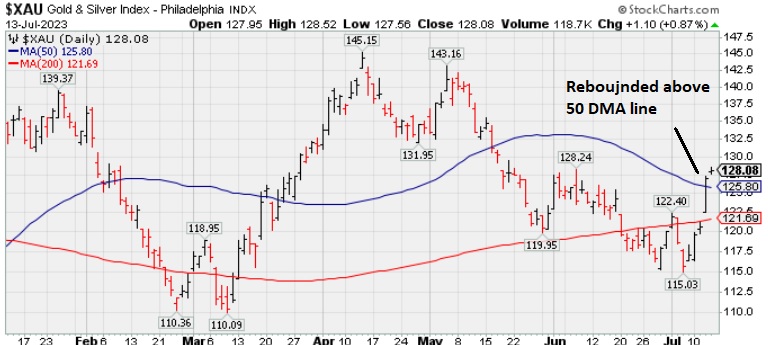
The Bank Index ($BKX +1.33%), Broker/Dealer Index ($XBD +1.36%), and the Retail Index ($RLX +1.10%) posted unanimous gains helping further boost the major averages. The tech sector was led by the Semiconductor Index ($SOX +2.03%) while Biotech Index ($BTK +0.20%) inched higher but the Networking Index ($NWX -1.08%) ended lower. Energy-linked shares had a slightly positive bias as the Integrated Oil Index ($XOI +0.14%) and Oil Services Index ($OSX +0.55%) both posted small gains.
PICTURED: The Gold & Silver Index ($XAU +0.87%) notched a modest gain after rising above its 50-day moving average (DMA) line with a big gain on Wednesday.
|
|
|
 |
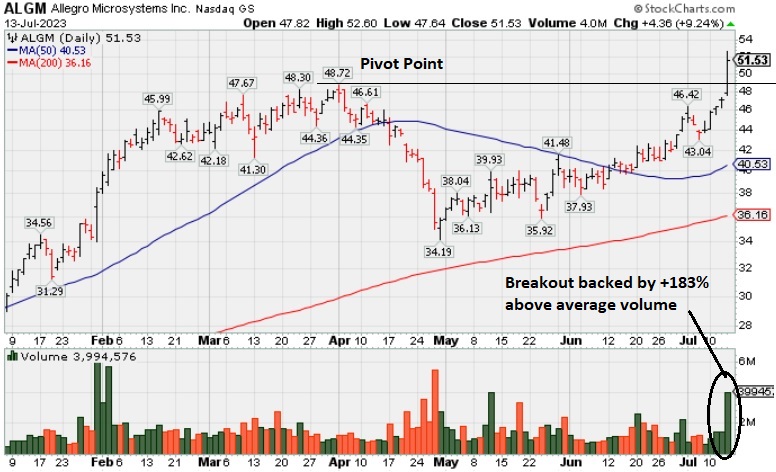
Volume Heavy Behind Considerable Breakout Gain
Kenneth J. Gruneisen - Passed the CAN SLIM® Master's Exam
Allegro Microsystems Inc (ALGM +$4.36 or +9.24% to $51.53) finished strong yellow with pivot point cited based on its 4/03/23 high plus 10 cents in the earlier mid-day report (read here). Today's 5th consecutive gain with ever-increasing volume had it hitting a new all-time high. The gain and strong close above the pivot point was backed by +183% above average volume triggering a proper technical buy signal. It found support above its 200 DMA line since dropped from the Featured Stocks list on 4/25/23.
ALGM was last shown in greater detail on 4/11/23 with an annotated graph under the headline, "Consolidating Near 50 DMA Line After Recent Rally". The company hails from the Elec-Semiconductor Fabless group which is currently ranked 2nd on the 197 Industry Groups list. It has a highest possible 99 Earnings Per Share Rating. Quarterly comparisons through Mar '23 have been above the +25% minimum earnings guideline (C criteria). Annual earnings history has been strong since its $14 IPO in Oct '20. ALGM has a new CEO as of Jun '22.
The number of top-rated funds owning its shares rose from 341 in Mar '22 to 611 in Jun '23, a reassuring sign concerning the I criteria. The current Up/Down Volume Ratio of 1.3 is an unbiased indication its shares have been under accumulation over the past 50 days.
|
|
|
Color Codes Explained :
Y - Better candidates highlighted by our
staff of experts.
G - Previously featured
in past reports as yellow but may no longer be buyable under the
guidelines.
***Last / Change / Volume data in this table is the closing quote data***
Symbol/Exchange
Company Name
Industry Group |
PRICE |
CHANGE
(%Change) |
Day High |
Volume
(% DAV)
(% 50 day avg vol) |
52 Wk Hi
% From Hi |
Featured
Date |
Price
Featured |
Pivot Featured |
|
Max Buy |
 STRL
-
NASDAQ
STRL
-
NASDAQ
Sterling Infrastructure
Bldg-Heavy Construction
|
$58.56
|
+0.49
0.84% |
$59.06
|
296,868
93.06% of 50 DAV
50 DAV is 319,000
|
$59.48
-1.55%
|
12/14/2022
|
$32.41
|
PP = $33.72
|
|
MB = $35.41
|
Most Recent Note - 7/11/2023 8:28:18 PM
G - Posted a 3rd consecutive gain with lighter volume, perched near its all-time high, very extended from any sound base. Mar '23 quarterly earnings were below the +25% minimum guideline (C criteria) raising fundamental concerns.
>>> FEATURED STOCK ARTICLE : Streak of Gains Lifts Sterling Infrastructure to New Highs - 7/3/2023 |
View all notes |
Set NEW NOTE alert |
Company Profile |
SEC
News |
Chart |
Request a new note
C
A
S
I |
FIX
-
NYSE
Comfort Systems USA
Bldg-A/C and Heating Prds
|
$166.16
|
+1.61
0.98% |
$166.76
|
128,779
51.51% of 50 DAV
50 DAV is 250,000
|
$167.53
-0.82%
|
4/27/2023
|
$148.85
|
PP = $152.23
|
|
MB = $159.84
|
Most Recent Note - 7/12/2023 5:09:58 PM
G - Posted a 4th consecutive small gain today with below-average volume. Hovering near its all-time high and above its "max buy" level. No resistance remains due to overhead supply. Its 50 DMA line ($155.72) defines important near-term support to watch.
>>> FEATURED STOCK ARTICLE : "Negative Reversal" Following Recent Volume-Driven Gains - 6/16/2023 |
View all notes |
Set NEW NOTE alert |
Company Profile |
SEC
News |
Chart |
Request a new note
C
A
S
I |
KOF
-
NYSE
Coca-Cola Femsa ADR
Beverages-Non-Alcoholic
|
$84.98
|
+2.22
2.68% |
$85.42
|
163,150
94.31% of 50 DAV
50 DAV is 173,000
|
$91.23
-6.85%
|
6/9/2023
|
$88.61
|
PP = $91.33
|
|
MB = $95.90
|
 Most Recent Note - 7/13/2023 5:26:07 PM
G - Posted a 3rd consecutive gain today approaching its 50 DMA line following a positive reversal. A rebound above the 50 DMA line ($86.18) is needed for its outlook to improve. Fundamentals remain strong.
>>> FEATURED STOCK ARTICLE : Slumping Below 50-Day Moving Average and Below Prior Low - 7/6/2023 |
View all notes |
Set NEW NOTE alert |
Company Profile |
SEC
News |
Chart |
Request a new note
C
A
S
I |
CLH
-
NYSE
Clean Harbors
Pollution Control
|
$165.38
|
-0.75
-0.45% |
$167.27
|
289,483
70.26% of 50 DAV
50 DAV is 412,000
|
$172.54
-4.15%
|
3/10/2023
|
$136.89
|
PP = $136.74
|
|
MB = $143.58
|
Most Recent Note - 7/11/2023 8:32:56 PM
G - Volume was heavy today while there was a "negative reversal" after touching a new all-time high. It is extended from any sound base. Its 50 DMA line ($150.46) and prior high define important near-term support to watch on pullbacks. Fundamentals remain strong.
>>> FEATURED STOCK ARTICLE : Extended From Any Sound Base and Hovering Near High - 6/15/2023 |
View all notes |
Set NEW NOTE alert |
Company Profile |
SEC
News |
Chart |
Request a new note
C
A
S
I |
SPSC
-
NASDAQ
SPS Commerce
Comp Sftwr-Spec Enterprs
|
$188.96
|
+0.84
0.45% |
$191.48
|
129,234
67.66% of 50 DAV
50 DAV is 191,000
|
$192.67
-1.93%
|
4/24/2023
|
$150.01
|
PP = $157.56
|
|
MB = $165.44
|
Most Recent Note - 7/11/2023 8:26:47 PM
G - Posted a 2nd consecutive gain with above average volume. Still very extended from the previously noted base. Reported Mar '23 quarterly earnings +22% on +20% versus the year-ago period, below the +25% minimum earnings guideline (C criteria) raising some fundamental concerns.
>>> FEATURED STOCK ARTICLE : Perched Near High Following Noted Volume-Driven Gains - 6/21/2023 |
View all notes |
Set NEW NOTE alert |
Company Profile |
SEC
News |
Chart |
Request a new note
C
A
S
I |
Symbol/Exchange
Company Name
Industry Group |
PRICE |
CHANGE
(%Change) |
Day High |
Volume
(% DAV)
(% 50 day avg vol) |
52 Wk Hi
% From Hi |
Featured
Date |
Price
Featured |
Pivot Featured |
|
Max Buy |
HUBB
-
NYSE
Hubbell
Electrical-Power/Equipmt
|
$333.07
|
+1.48
0.45% |
$333.61
|
233,693
60.08% of 50 DAV
50 DAV is 389,000
|
$337.23
-1.23%
|
4/25/2023
|
$262.85
|
PP = $257.51
|
|
MB = $270.39
|
Most Recent Note - 7/12/2023 5:14:25 PM
G - Pulled back today for a 2nd consecutive loss with below-average volume. Hovering near its all-time high, very extended from the prior base. Its 50 DMA line ($299.55) defines initial support to watch on pullbacks. Fundamentals remain strong.
>>> FEATURED STOCK ARTICLE : Hubbell on Track for 11th Weekly Gain - 6/22/2023 |
View all notes |
Set NEW NOTE alert |
Company Profile |
SEC
News |
Chart |
Request a new note
C
A
S
I |
NVR
-
NYSE
NVR
Bldg-Resident/Comml
|
$6,325.78
|
-22.91
-0.36% |
$6,391.10
|
14,816
61.73% of 50 DAV
50 DAV is 24,000
|
$6,392.26
-1.04%
|
4/25/2023
|
$5,882.18
|
PP = $5,978.25
|
|
MB = $6,277.16
|
Most Recent Note - 7/11/2023 8:37:54 PM
Y - Color code is changed to yellow after pulling back below its "max buy" level. Its 50 DMA line ($5,911) defines near-term support watch.
>>> FEATURED STOCK ARTICLE : New High Close for Strong Homebuilder - 6/30/2023 |
View all notes |
Set NEW NOTE alert |
Company Profile |
SEC
News |
Chart |
Request a new note
C
A
S
I |
PHM
-
NYSE
PulteGroup
Bldg-Resident/Comml
|
$80.35
|
+0.35
0.44% |
$81.06
|
2,994,443
106.41% of 50 DAV
50 DAV is 2,814,000
|
$80.17
0.22%
|
4/25/2023
|
$65.17
|
PP = $64.01
|
|
MB = $67.21
|
Most Recent Note - 7/10/2023 5:29:29 PM
G - Posted a solid gain today with lighter volume. Extended from any sound base. Reported earnings +28% for the Mar '23 quarter versus the year-ago period. Important support to watch is defined by its 50 DMA line ($70.51).
>>> FEATURED STOCK ARTICLE : Negative Reversal After Hitting Another New High - 6/26/2023 |
View all notes |
Set NEW NOTE alert |
Company Profile |
SEC
News |
Chart |
Request a new note
C
A
S
I |
AMPH
-
NASDAQ
Amphastar Pharm
Medical-Biomed/Biotech
|
$55.28
|
+0.39
0.71% |
$56.00
|
452,402
100.09% of 50 DAV
50 DAV is 452,000
|
$58.80
-5.99%
|
5/15/2023
|
$43.56
|
PP = $44.15
|
|
MB = $46.36
|
Most Recent Note - 7/11/2023 8:30:26 PM
G - Pulled back today with higher (near average) volume, retreating from its all-time high. Extended from any sound base. Its 50 DMA line ($47.21) and prior highs in the $44 area define important support to watch on pullbacks. Fundamentals remain strong.
>>> FEATURED STOCK ARTICLE : Hit Another New High With 4th Consecutive Volume-Driven Gain - 6/20/2023 |
View all notes |
Set NEW NOTE alert |
Company Profile |
SEC
News |
Chart |
Request a new note
C
A
S
I |
ANET
-
NYSE
Arista Networks
Computer-Networking
|
$168.61
|
+4.57
2.79% |
$168.78
|
2,787,734
77.50% of 50 DAV
50 DAV is 3,597,000
|
$178.36
-5.47%
|
5/30/2023
|
$176.35
|
PP = $171.54
|
|
MB = $180.12
|
Most Recent Note - 7/13/2023 5:23:21 PM
G - Posted a 4th consecutive gain today with below-average volume, approaching prior highs. Volume totals have been cooling while consolidating above its 50 DMA line ($153). Faces near-term resistance due to overhead supply up to the $178 level. Fundamentals remain strong. See the latest FSU analysis for more details and an annotated graph.
>>> FEATURED STOCK ARTICLE : Wedging Higher After Rebounding Above 50-Day Moving Average - 7/12/2023 |
View all notes |
Set NEW NOTE alert |
Company Profile |
SEC
News |
Chart |
Request a new note
C
A
S
I |
Symbol/Exchange
Company Name
Industry Group |
PRICE |
CHANGE
(%Change) |
Day High |
Volume
(% DAV)
(% 50 day avg vol) |
52 Wk Hi
% From Hi |
Featured
Date |
Price
Featured |
Pivot Featured |
|
Max Buy |
PANW
-
NASDAQ
Palo Alto Networks
Computer Sftwr-Security
|
$239.01
|
+6.37
2.74% |
$243.70
|
8,352,173
128.22% of 50 DAV
50 DAV is 6,514,000
|
$258.88
-7.68%
|
6/5/2023
|
$228.35
|
PP = $213.73
|
|
MB = $224.42
|
Most Recent Note - 7/13/2023 1:01:49 PM
G - Posting a gain today, halting its slide after abruptly retreating from near its all-time high. Its 50 DMA line ($220.76) and prior high ($213) define near-term support to watch. Fundamentals remain strong.
>>> FEATURED STOCK ARTICLE : Strength Continues for Network Security Leader - 6/27/2023 |
View all notes |
Set NEW NOTE alert |
Company Profile |
SEC
News |
Chart |
Request a new note
C
A
S
I |
LSCC
-
NASDAQ
Lattice Semiconductor
Elec-Semicondctor Fablss
|
$95.93
|
+0.38
0.40% |
$96.77
|
1,884,546
78.36% of 50 DAV
50 DAV is 2,405,000
|
$97.27
-1.38%
|
6/13/2023
|
$91.73
|
PP = $96.92
|
|
MB = $101.77
|
Most Recent Note - 7/10/2023 5:27:07 PM
Y - Posted a solid gain today backed by below-average volume. Its 50 DMA line ($85) defines near-term support to watch. Subsequent gains above the pivot point backed by at least +40% above average volume may trigger a technical buy signal. Fundamentals remain strong.
>>> FEATURED STOCK ARTICLE : Lattice Posts Volume-Driven Gains Approaching Prior High - 6/13/2023 |
View all notes |
Set NEW NOTE alert |
Company Profile |
SEC
News |
Chart |
Request a new note
C
A
S
I |
XPEL
-
NASDAQ
XPEL
Auto/Truck-Replace Parts
|
$83.66
|
-1.81
-2.12% |
$85.87
|
118,770
88.63% of 50 DAV
50 DAV is 134,000
|
$87.46
-4.34%
|
6/28/2023
|
$83.14
|
PP = $87.11
|
|
MB = $91.47
|
Most Recent Note - 7/13/2023 5:28:26 PM
Y - Pulled back today with below-average volume. Perched near the pivot point cited based on its 8/15/23 high plus 10 cents. Within close striking distance of its 52-week high after an orderly 10-month base. Reported Mar '23 quarterly earnings +46% on +19% sales revenues versus the year ago period, its 3rd quarterly comparison above the +25% minimum earnings guideline (C criteria), helping it better match the winning models of the fact-based investment system.
>>> FEATURED STOCK ARTICLE : XPEL Returns to Featured Stocks List After Long Consolidation - 6/28/2023 |
View all notes |
Set NEW NOTE alert |
Company Profile |
SEC
News |
Chart |
Request a new note
C
A
S
I |
FTNT
-
NASDAQ
Fortinet
Computer Sftwr-Security
|
$78.25
|
+1.53
1.99% |
$78.29
|
4,682,714
85.31% of 50 DAV
50 DAV is 5,489,000
|
$79.03
-0.99%
|
7/10/2023
|
$78.29
|
PP = $74.45
|
|
MB = $78.17
|
Most Recent Note - 7/12/2023 5:13:14 PM
Y - Touched a new high but there was a "negative reversal" today with slightly higher volume. Gain and close above the pivot point backed by +51% above average volume on 7/10/23 triggered a proper technical buy signal. Fundamentals remain strong.
>>> FEATURED STOCK ARTICLE : Fortinet Powered to New All-Time High - 7/10/2023 |
View all notes |
Set NEW NOTE alert |
Company Profile |
SEC
News |
Chart |
Request a new note
C
A
S
I |
PII
-
NYSE
Polaris
Leisure-Products
|
$129.71
|
+0.10
0.08% |
$129.81
|
347,666
64.86% of 50 DAV
50 DAV is 536,000
|
$131.09
-1.05%
|
7/11/2023
|
$126.92
|
PP = $123.97
|
|
MB = $130.17
|
Most Recent Note - 7/12/2023 12:37:44 PM
Y - Hit another new high today. Finished strong after highlighted in yellow in the prior mid-day report with pivot point cited based on its 8/16/22 high plus 10 cents. Gain and strong close above the pivot point triggered a technical buy signal. Reported very strong Sep, Dec '22, and Mar '23 quarterly sales revenues and earnings increases above the +25% minimum (C criteria) versus the year ago periods. Annual earnings (A criteria) history had a slight downturn in FY '19 followed by strong growth. See the latest FSU analysis for more details and an annotated graph.
>>> FEATURED STOCK ARTICLE : Volume-Driven Breakout for Polaris - 7/11/2023 |
View all notes |
Set NEW NOTE alert |
Company Profile |
SEC
News |
Chart |
Request a new note
C
A
S
I |
Symbol/Exchange
Company Name
Industry Group |
PRICE |
CHANGE
(%Change) |
Day High |
Volume
(% DAV)
(% 50 day avg vol) |
52 Wk Hi
% From Hi |
Featured
Date |
Price
Featured |
Pivot Featured |
|
Max Buy |
ALGM
-
NASDAQ
Allegro MicroSystems
Elec-Semicondctor Fablss
|
$51.53
|
+4.36
9.24% |
$52.60
|
3,994,439
283.29% of 50 DAV
50 DAV is 1,410,000
|
$48.72
5.77%
|
7/13/2023
|
$49.86
|
PP = $48.82
|
|
MB = $51.26
|
Most Recent Note - 7/13/2023 5:21:49 PM
Y - Finished strong after highlighted in yellow with pivot point cited based on its 4/03/23 high plus 10 cents in the earlier mid-day report. Hit a new all-time high with a considerable gain above the pivot point backed by +183% above average volume triggering a proper technical buy signal. It found support above its 200 DMA line since dropped from the Featured Stocks list on 4/25/23. Fundamentals through the Mar '23 quarter remained strong. See the latest FSU analysis for more details and a new annotated graph.
>>> FEATURED STOCK ARTICLE : Volume Heavy Behind Considerable Breakout Gain - 7/13/2023 |
View all notes |
Set NEW NOTE alert |
Company Profile |
SEC
News |
Chart |
Request a new note
C
A
S
I |
|
|
|
THESE ARE NOT BUY RECOMMENDATIONS!
Comments contained in the body of this report are technical
opinions only. The material herein has been obtained
from sources believed to be reliable and accurate, however,
its accuracy and completeness cannot be guaranteed.
This site is not an investment advisor, hence it does
not endorse or recommend any securities or other investments.
Any recommendation contained in this report may not
be suitable for all investors and it is not to be deemed
an offer or solicitation on our part with respect to
the purchase or sale of any securities. All trademarks,
service marks and trade names appearing in this report
are the property of their respective owners, and are
likewise used for identification purposes only.
This report is a service available
only to active Paid Premium Members.
You may opt-out of receiving report notifications
at any time. Questions or comments may be submitted
by writing to Premium Membership Services 665 S.E. 10 Street, Suite 201 Deerfield Beach, FL 33441-5634 or by calling 1-800-965-8307
or 954-785-1121.
|
|
|