You are not logged in.
This means you
CAN ONLY VIEW reports that were published prior to Thursday, March 20, 2025.
You
MUST UPGRADE YOUR MEMBERSHIP if you want to see any current reports.
AFTER MARKET UPDATE - TUESDAY, JULY 11TH, 2023
Previous After Market Report Next After Market Report >>>
|
|
|
|
DOW |
+317.02 |
34,261.42 |
+0.93% |
|
Volume |
795,691,674 |
-3% |
|
Volume |
4,904,231,800 |
-7% |
|
NASDAQ |
+75.22 |
13,760.70 |
+0.55% |
|
Advancers |
2,213 |
76% |
|
Advancers |
2,807 |
64% |
|
S&P 500 |
+29.73 |
4,439.26 |
+0.67% |
|
Decliners |
688 |
24% |
|
Decliners |
1,600 |
36% |
|
Russell 2000 |
+18.11 |
1,913.36 |
+0.96% |
|
52 Wk Highs |
144 |
|
|
52 Wk Highs |
135 |
|
|
S&P 600 |
+11.48 |
1,226.90 |
+0.94% |
|
52 Wk Lows |
9 |
|
|
52 Wk Lows |
48 |
|
|
 |
Leadership Improved as Major Indices Rallied
Kenneth J. Gruneisen - Passed the CAN SLIM® Master's Exam
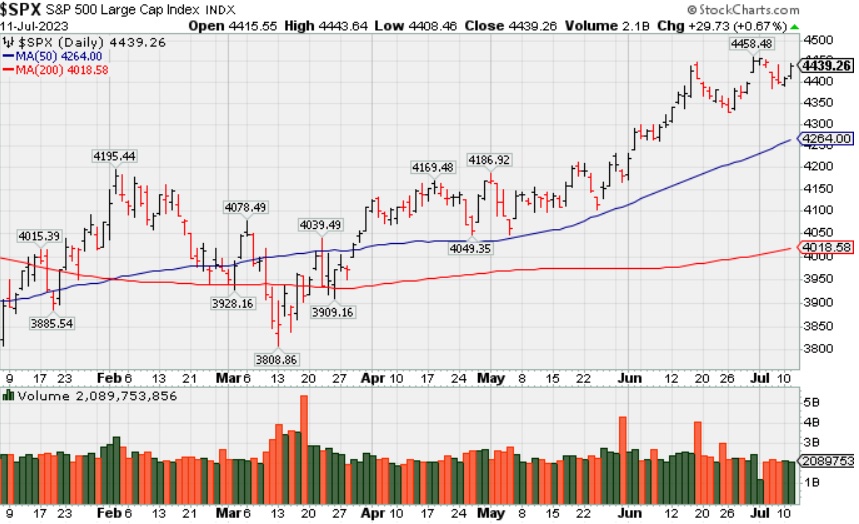
The major indices rose on Tuesday. The volume totals reported were lighter on the NYSE and on the Nasdaq exchange versus the prior session. Breadth was solidly positive as advancers led decliners by more than a 3-1 margin on the NYSE and by a 7-4 margin on the Nasdaq exchange. Leadership improved as there were 78 high-ranked companies from the Leaders List that hit a new 52-week high and were listed on the BreakOuts Page, doubling the total of 39 on the prior session. New 52-week highs totals expanded and solidly outnumbered shrinking new 52-week lows totals on the NYSE and on the Nasdaq exchange. The major indices are in a confirmed uptrend (M criteria). Appropriate new buying efforts may be considered under the fact-based investment system.
PICTURED: The S&P 500 Index posted a solid gain and it is perched within striking distance of its 2023 high.
Ten of the 11 S&P 500 sectors registered gains. In the financial sector, JPMorgan (JPM +1.6%) and American Express (AXP +1.7%) both posted gains on favorable analyst coverage. The positive economic vibe in the market led small caps to outperform large caps and value stocks to outperform growth stocks. The health care sector was the worst performer, closing flat, while the fellow defensive-oriented consumer staples sector (+0.1%) saw the slimmest gain. The countercyclical energy (+2.2%), industrials (+1.2%), and financials (+1.2%) sectors were some of the top performers. The industrials sector was boosted by a nice gain in 3M (MMM +4.9%) after it was upgraded.
Longer dated Treasuries settled with gains following a solid 3-yr note auction and ahead of tomorrow's release of the June Consumer Price Index at 8:30 a.m. ET. The 10-yr note yield fell three basis points to 3.98%. The 2-yr note yield, meanwhile, rose four basis points to 4.89%. |
 Kenneth J. Gruneisen started out as a licensed stockbroker in August 1987, a couple of months prior to the historic stock market crash that took the Dow Jones Industrial Average down -22.6% in a single day. He has published daily fact-based fundamental and technical analysis on high-ranked stocks online for two decades. Through FACTBASEDINVESTING.COM, Kenneth provides educational articles, news, market commentary, and other information regarding proven investment systems that work in good times and bad.
Comments contained in the body of this report are technical opinions only and are not necessarily those of Gruneisen Growth Corp. The material herein has been obtained from sources believed to be reliable and accurate, however, its accuracy and completeness cannot be guaranteed. Our firm, employees, and customers may effect transactions, including transactions contrary to any recommendation herein, or have positions in the securities mentioned herein or options with respect thereto. Any recommendation contained in this report may not be suitable for all investors and it is not to be deemed an offer or solicitation on our part with respect to the purchase or sale of any securities. |
|
 |
Energy, Financial, Retail, and Tech Indexes Led Gainers
Kenneth J. Gruneisen - Passed the CAN SLIM® Master's Exam
The Bank Index ($BKX +1.68%) and Broker/Dealer Index ($XBD +1.69%) both posted solid gains along with the Retail Index ($RLX +1.23%). The tech sector had a slightly positive bias as the Networking Index ($NWX+0.77%) and the Biotech Index ($BTK +0.35%) each posted small gains and the Semiconductor Index ($SOX +0.05%) finished flat. Energy-linked shares were standout gainers as the Integrated Oil Index ($XOI +2.18%) and Oil Services Index ($OSX +3.20%) posted solid gains. The Gold & Silver Index ($XAU +0.82%) rounded out the positive session with gains.
PICTURED: The Oil Services Index ($OSX +3.20%) posted a solid gain rallying toward its March 2023 high.
| Oil Services |
$OSX |
87.21 |
+2.71 |
+3.20% |
+4.00% |
| Integrated Oil |
$XOI |
1,715.78 |
+36.69 |
+2.18% |
-4.00% |
| Semiconductor |
$SOX |
3,653.53 |
+1.93 |
+0.05% |
+44.29% |
| Networking |
$NWX |
872.08 |
+6.64 |
+0.77% |
+11.33% |
| Broker/Dealer |
$XBD |
481.86 |
+8.01 |
+1.69% |
+7.29% |
| Retail |
$RLX |
3,468.45 |
+42.26 |
+1.23% |
+25.94% |
| Gold & Silver |
$XAU |
120.63 |
+0.99 |
+0.82% |
-0.19% |
| Bank |
$BKX |
82.25 |
+1.36 |
+1.68% |
-18.45% |
| Biotech |
$BTK |
5,211.80 |
+18.43 |
+0.35% |
-1.31% |
|
|
|
 |
Volume-Driven Breakout for Polaris
Kenneth J. Gruneisen - Passed the CAN SLIM® Master's Exam
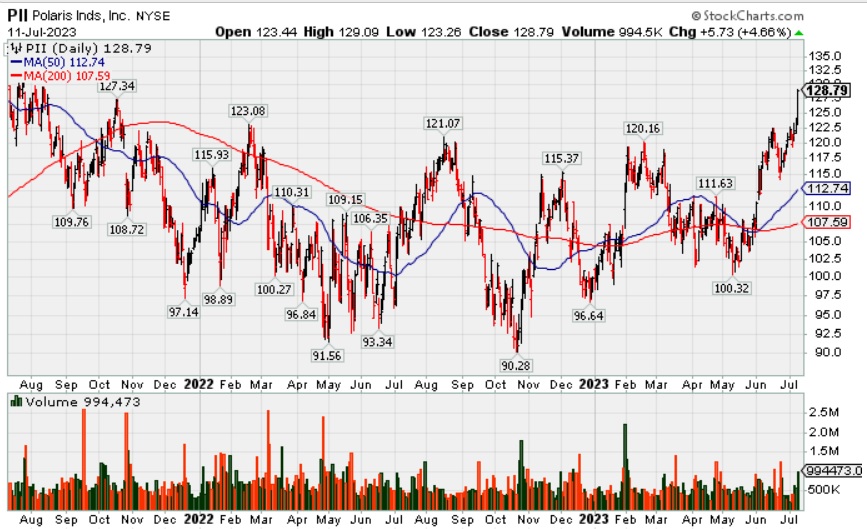
Polaris (PII $128.79 +$5.73 +4.66%) finished strong after highlighted in yellow with pivot point cited based on its 8/16/22 high plus 10 cents in the earlier mid-day report (read here). It hit a new 52-week high today with a strong close above the pivot point backed by +86% above average volume clinching a technical buy signal.
It hails from the Leisure-Products group which is ranked 128th on the 197 Industry Groups list. Reported very strong Sep, Dec '22, and Mar '23 quarterly sales revenues and earnings increases above the +25% minimum (C criteria) versus the year ago periods. Annual earnings (A criteria) history had a slight downturn in FY '19 followed by strong growth.
The number of top-rated funds owning its shares reportedly fell from 613 in Sep '22 to 593 in Mar '23, not a reassuring sign concerning the I criteria. Its current Up/Down Volume Ratio of 1.1 is only a slightly bullish sign of accumulation over the past 50 days. It has an Accumulation/Distribution Rating of B+ and B ratings for both Timeliness and Sponsorship.
|
|
|
Color Codes Explained :
Y - Better candidates highlighted by our
staff of experts.
G - Previously featured
in past reports as yellow but may no longer be buyable under the
guidelines.
***Last / Change / Volume data in this table is the closing quote data***
Symbol/Exchange
Company Name
Industry Group |
PRICE |
CHANGE
(%Change) |
Day High |
Volume
(% DAV)
(% 50 day avg vol) |
52 Wk Hi
% From Hi |
Featured
Date |
Price
Featured |
Pivot Featured |
|
Max Buy |
 STRL
-
NASDAQ
STRL
-
NASDAQ
Sterling Infrastructure
Bldg-Heavy Construction
|
$58.51
|
+0.17
0.29% |
$59.48
|
289,465
91.60% of 50 DAV
50 DAV is 316,000
|
$59.43
-1.55%
|
12/14/2022
|
$32.41
|
PP = $33.72
|
|
MB = $35.41
|
 Most Recent Note - 7/11/2023 8:28:18 PM
G - Posted a 3rd consecutive gain with lighter volume, perched near its all-time high, very extended from any sound base. Mar '23 quarterly earnings were below the +25% minimum guideline (C criteria) raising fundamental concerns.
>>> FEATURED STOCK ARTICLE : Streak of Gains Lifts Sterling Infrastructure to New Highs - 7/3/2023 |
View all notes |
Set NEW NOTE alert |
Company Profile |
SEC
News |
Chart |
Request a new note
C
A
S
I |
FIX
-
NYSE
Comfort Systems USA
Bldg-A/C and Heating Prds
|
$164.00
|
+0.74
0.45% |
$164.57
|
186,765
71.28% of 50 DAV
50 DAV is 262,000
|
$167.53
-2.11%
|
4/27/2023
|
$148.85
|
PP = $152.23
|
|
MB = $159.84
|
Most Recent Note - 7/7/2023 8:52:05 PM
G - Volume totals have been cooling while still hovering near its all-time high and near its "max buy" level. No resistance remains due to overhead supply. Its 50 DMA line ($154.51) defines important near-term support to watch.
>>> FEATURED STOCK ARTICLE : "Negative Reversal" Following Recent Volume-Driven Gains - 6/16/2023 |
View all notes |
Set NEW NOTE alert |
Company Profile |
SEC
News |
Chart |
Request a new note
C
A
S
I |
KOF
-
NYSE
Coca-Cola Femsa ADR
Beverages-Non-Alcoholic
|
$80.95
|
+0.08
0.10% |
$81.08
|
309,363
178.82% of 50 DAV
50 DAV is 173,000
|
$91.23
-11.27%
|
6/9/2023
|
$88.61
|
PP = $91.33
|
|
MB = $95.90
|
Most Recent Note - 7/11/2023 12:44:09 PM
G - Recovered from early lows but today's loss with higher volume adds to damaging losses below the prior low ($81.63 on 5/31/23) which raised greater concerns. A prompt rebound above the 50 DMA line ($86.17) is needed for its outlook to improve. Fundamentals remain strong.
>>> FEATURED STOCK ARTICLE : Slumping Below 50-Day Moving Average and Below Prior Low - 7/6/2023 |
View all notes |
Set NEW NOTE alert |
Company Profile |
SEC
News |
Chart |
Request a new note
C
A
S
I |
CLH
-
NYSE
Clean Harbors
Pollution Control
|
$168.08
|
-3.79
-2.21% |
$172.54
|
670,617
166.82% of 50 DAV
50 DAV is 402,000
|
$172.08
-2.32%
|
3/10/2023
|
$136.89
|
PP = $136.74
|
|
MB = $143.58
|
Most Recent Note - 7/11/2023 8:32:56 PM
G - Volume was heavy today while there was a "negative reversal" after touching a new all-time high. It is extended from any sound base. Its 50 DMA line ($150.46) and prior high define important near-term support to watch on pullbacks. Fundamentals remain strong.
>>> FEATURED STOCK ARTICLE : Extended From Any Sound Base and Hovering Near High - 6/15/2023 |
View all notes |
Set NEW NOTE alert |
Company Profile |
SEC
News |
Chart |
Request a new note
C
A
S
I |
SPSC
-
NASDAQ
SPS Commerce
Comp Sftwr-Spec Enterprs
|
$187.01
|
+5.78
3.19% |
$187.01
|
233,237
124.73% of 50 DAV
50 DAV is 187,000
|
$192.67
-2.94%
|
4/24/2023
|
$150.01
|
PP = $157.56
|
|
MB = $165.44
|
Most Recent Note - 7/11/2023 8:26:47 PM
G - Posted a 2nd consecutive gain with above average volume. Still very extended from the previously noted base. Reported Mar '23 quarterly earnings +22% on +20% versus the year-ago period, below the +25% minimum earnings guideline (C criteria) raising some fundamental concerns.
>>> FEATURED STOCK ARTICLE : Perched Near High Following Noted Volume-Driven Gains - 6/21/2023 |
View all notes |
Set NEW NOTE alert |
Company Profile |
SEC
News |
Chart |
Request a new note
C
A
S
I |
Symbol/Exchange
Company Name
Industry Group |
PRICE |
CHANGE
(%Change) |
Day High |
Volume
(% DAV)
(% 50 day avg vol) |
52 Wk Hi
% From Hi |
Featured
Date |
Price
Featured |
Pivot Featured |
|
Max Buy |
HUBB
-
NYSE
Hubbell
Electrical-Power/Equipmt
|
$332.87
|
-2.56
-0.76% |
$337.23
|
357,677
90.09% of 50 DAV
50 DAV is 397,000
|
$335.55
-0.80%
|
4/25/2023
|
$262.85
|
PP = $257.51
|
|
MB = $270.39
|
Most Recent Note - 7/7/2023 8:53:13 PM
G - Still hovering near its all-time high, very extended from the prior base. Its 50 DMA line ($295.48) defines initial support to watch on pullbacks. Fundamentals remain strong.
>>> FEATURED STOCK ARTICLE : Hubbell on Track for 11th Weekly Gain - 6/22/2023 |
View all notes |
Set NEW NOTE alert |
Company Profile |
SEC
News |
Chart |
Request a new note
C
A
S
I |
NVR
-
NYSE
NVR
Bldg-Resident/Comml
|
$6,204.76
|
-9.04
-0.15% |
$6,270.94
|
12,098
50.41% of 50 DAV
50 DAV is 24,000
|
$6,386.62
-2.85%
|
4/25/2023
|
$5,882.18
|
PP = $5,978.25
|
|
MB = $6,277.16
|
Most Recent Note - 7/11/2023 8:37:54 PM
Y - Color code is changed to yellow after pulling back below its "max buy" level. Its 50 DMA line ($5,911) defines near-term support watch.
>>> FEATURED STOCK ARTICLE : New High Close for Strong Homebuilder - 6/30/2023 |
View all notes |
Set NEW NOTE alert |
Company Profile |
SEC
News |
Chart |
Request a new note
C
A
S
I |
PHM
-
NYSE
PulteGroup
Bldg-Resident/Comml
|
$78.20
|
+0.82
1.06% |
$78.44
|
2,423,444
84.77% of 50 DAV
50 DAV is 2,859,000
|
$79.15
-1.20%
|
4/25/2023
|
$65.17
|
PP = $64.01
|
|
MB = $67.21
|
Most Recent Note - 7/10/2023 5:29:29 PM
G - Posted a solid gain today with lighter volume. Extended from any sound base. Reported earnings +28% for the Mar '23 quarter versus the year-ago period. Important support to watch is defined by its 50 DMA line ($70.51).
>>> FEATURED STOCK ARTICLE : Negative Reversal After Hitting Another New High - 6/26/2023 |
View all notes |
Set NEW NOTE alert |
Company Profile |
SEC
News |
Chart |
Request a new note
C
A
S
I |
COKE
-
NASDAQ
Coca-Cola Consolidated
Beverages-Non-Alcoholic
|
$619.09
|
-14.02
-2.21% |
$636.92
|
38,364
95.91% of 50 DAV
50 DAV is 40,000
|
$694.20
-10.82%
|
5/4/2023
|
$646.66
|
PP = $656.21
|
|
MB = $689.02
|
Most Recent Note - 7/11/2023 8:35:24 PM
Suffered a 4th consecutive loss slumping below its 50 DMA line ($646.72) raising concerns and triggering technical sell signals. It will be dropped from the Featured Stocks list tonight. A rebound above the 50 DMA line is needed for its outlook to improve. Fundamentals remain strong.
>>> FEATURED STOCK ARTICLE : Fell Below Pivot Point With Recent Volume-Driven Losses - 6/14/2023 |
View all notes |
Set NEW NOTE alert |
Company Profile |
SEC
News |
Chart |
Request a new note
C
A
S
I |
AMPH
-
NASDAQ
Amphastar Pharm
Medical-Biomed/Biotech
|
$55.07
|
-1.87
-3.28% |
$57.28
|
492,377
108.21% of 50 DAV
50 DAV is 455,000
|
$58.80
-6.34%
|
5/15/2023
|
$43.56
|
PP = $44.15
|
|
MB = $46.36
|
Most Recent Note - 7/11/2023 8:30:26 PM
G - Pulled back today with higher (near average) volume, retreating from its all-time high. Extended from any sound base. Its 50 DMA line ($47.21) and prior highs in the $44 area define important support to watch on pullbacks. Fundamentals remain strong.
>>> FEATURED STOCK ARTICLE : Hit Another New High With 4th Consecutive Volume-Driven Gain - 6/20/2023 |
View all notes |
Set NEW NOTE alert |
Company Profile |
SEC
News |
Chart |
Request a new note
C
A
S
I |
Symbol/Exchange
Company Name
Industry Group |
PRICE |
CHANGE
(%Change) |
Day High |
Volume
(% DAV)
(% 50 day avg vol) |
52 Wk Hi
% From Hi |
Featured
Date |
Price
Featured |
Pivot Featured |
|
Max Buy |
ANET
-
NYSE
Arista Networks
Computer-Networking
|
$160.17
|
+0.62
0.39% |
$161.76
|
1,614,660
44.80% of 50 DAV
50 DAV is 3,604,000
|
$178.36
-10.20%
|
5/30/2023
|
$176.35
|
PP = $171.54
|
|
MB = $180.12
|
Most Recent Note - 7/7/2023 8:45:45 PM
G - Volume totals have been cooling while consolidating above its 50 DMA line ($153). Faces near-term resistance due to overhead supply up to the $178 level. Fundamentals remain strong.
>>> FEATURED STOCK ARTICLE : Rebounding Near Recent High With 3 Consecutive Gains - 6/12/2023 |
View all notes |
Set NEW NOTE alert |
Company Profile |
SEC
News |
Chart |
Request a new note
C
A
S
I |
PANW
-
NASDAQ
Palo Alto Networks
Computer Sftwr-Security
|
$250.23
|
+2.76
1.12% |
$250.99
|
2,771,386
44.46% of 50 DAV
50 DAV is 6,233,000
|
$258.88
-3.34%
|
6/5/2023
|
$228.35
|
PP = $213.73
|
|
MB = $224.42
|
Most Recent Note - 7/7/2023 8:57:55 PM
G - Pulled back from its all-time high with today's 2nd consecutive loss on light volume. Its 50 DMA line ($216) and prior high ($213) defines near-term support to watch. Fundamentals remain strong.
>>> FEATURED STOCK ARTICLE : Strength Continues for Network Security Leader - 6/27/2023 |
View all notes |
Set NEW NOTE alert |
Company Profile |
SEC
News |
Chart |
Request a new note
C
A
S
I |
LSCC
-
NASDAQ
Lattice Semiconductor
Elec-Semicondctor Fablss
|
$93.61
|
-1.63
-1.71% |
$95.91
|
1,459,975
58.35% of 50 DAV
50 DAV is 2,502,000
|
$97.27
-3.76%
|
6/13/2023
|
$91.73
|
PP = $96.92
|
|
MB = $101.77
|
Most Recent Note - 7/10/2023 5:27:07 PM
Y - Posted a solid gain today backed by below-average volume. Its 50 DMA line ($85) defines near-term support to watch. Subsequent gains above the pivot point backed by at least +40% above average volume may trigger a technical buy signal. Fundamentals remain strong.
>>> FEATURED STOCK ARTICLE : Lattice Posts Volume-Driven Gains Approaching Prior High - 6/13/2023 |
View all notes |
Set NEW NOTE alert |
Company Profile |
SEC
News |
Chart |
Request a new note
C
A
S
I |
XPEL
-
NASDAQ
XPEL
Auto/Truck-Replace Parts
|
$85.14
|
-1.50
-1.73% |
$87.46
|
128,656
96.01% of 50 DAV
50 DAV is 134,000
|
$87.01
-2.15%
|
6/28/2023
|
$83.14
|
PP = $87.11
|
|
MB = $91.47
|
Most Recent Note - 7/10/2023 5:31:10 PM
Y - Posted a solid gain today with +95% above average volume and closed near the sessionm high, rising near the pivot point cited based on its 8/15/23 high plus 10 cents. Perched within striking distance of its 52-week high after an orderly 10-month base. Reported Mar '23 quarterly earnings +46% on +19% sales revenues versus the year ago period, its 3rd quarterly comparison above the +25% minimum earnings guideline (C criteria), helping it better match the winning models of the fact-based investment system.
>>> FEATURED STOCK ARTICLE : XPEL Returns to Featured Stocks List After Long Consolidation - 6/28/2023 |
View all notes |
Set NEW NOTE alert |
Company Profile |
SEC
News |
Chart |
Request a new note
C
A
S
I |
FTNT
-
NASDAQ
Fortinet
Computer Sftwr-Security
|
$78.32
|
+0.46
0.59% |
$78.63
|
4,294,070
78.19% of 50 DAV
50 DAV is 5,492,000
|
$78.66
-0.43%
|
7/10/2023
|
$78.29
|
PP = $74.45
|
|
MB = $78.17
|
Most Recent Note - 7/10/2023 5:26:10 PM
Y - Finished strong after highlighted in yellow in the earlier mid-day report with new pivot point cited based on its 12/29/21 high plus 10 cents. Hit a new all-time high with today's gain and close above the pivot point backed by +51% above average volume triggering a proper technical buy signal. Reported Mar '23 quarterly earnings +79% on +32% sales revenues versus the year-ago period, its 4th strong earnings comparison above the +25% minimum (C criteria). See the latest FSU analysis for more details and a new annotated graph.
>>> FEATURED STOCK ARTICLE : Fortinet Powered to New All-Time High - 7/10/2023 |
View all notes |
Set NEW NOTE alert |
Company Profile |
SEC
News |
Chart |
Request a new note
C
A
S
I |
Symbol/Exchange
Company Name
Industry Group |
PRICE |
CHANGE
(%Change) |
Day High |
Volume
(% DAV)
(% 50 day avg vol) |
52 Wk Hi
% From Hi |
Featured
Date |
Price
Featured |
Pivot Featured |
|
Max Buy |
PII
-
NYSE
Polaris
Leisure-Products
|
$128.79
|
+5.73
4.66% |
$129.09
|
994,473
186.58% of 50 DAV
50 DAV is 533,000
|
$124.21
3.69%
|
7/11/2023
|
$126.92
|
PP = $123.97
|
|
MB = $130.17
|
Most Recent Note - 7/11/2023 12:56:54 PM
Y - Color code is changed to yellow with pivot point cited based on its 8/16/22 high plus 10 cents. Hitting a new 52-week high today, and a strong close above the pivot point backed by at least +40% above average volume may clinch a technical buy signal. Reported very strong Sep, Dec '22, and Mar '23 quarterly sales revenues and earnings increases above the +25% minimum (C criteria) versus the year ago periods. Annual earnings (A criteria) history had a slight downturn in FY '19 followed by strong growth.
>>> FEATURED STOCK ARTICLE : Volume-Driven Breakout for Polaris - 7/11/2023 |
View all notes |
Set NEW NOTE alert |
Company Profile |
SEC
News |
Chart |
Request a new note
C
A
S
I |
|
|
|
THESE ARE NOT BUY RECOMMENDATIONS!
Comments contained in the body of this report are technical
opinions only. The material herein has been obtained
from sources believed to be reliable and accurate, however,
its accuracy and completeness cannot be guaranteed.
This site is not an investment advisor, hence it does
not endorse or recommend any securities or other investments.
Any recommendation contained in this report may not
be suitable for all investors and it is not to be deemed
an offer or solicitation on our part with respect to
the purchase or sale of any securities. All trademarks,
service marks and trade names appearing in this report
are the property of their respective owners, and are
likewise used for identification purposes only.
This report is a service available
only to active Paid Premium Members.
You may opt-out of receiving report notifications
at any time. Questions or comments may be submitted
by writing to Premium Membership Services 665 S.E. 10 Street, Suite 201 Deerfield Beach, FL 33441-5634 or by calling 1-800-965-8307
or 954-785-1121.
|
|
|