You are not logged in.
This means you
CAN ONLY VIEW reports that were published prior to Monday, April 14, 2025.
You
MUST UPGRADE YOUR MEMBERSHIP if you want to see any current reports.
AFTER MARKET UPDATE - WEDNESDAY, AUGUST 2ND, 2023
Previous After Market Report Next After Market Report >>>
|
|
|
|
DOW |
-348.16 |
35,282.52 |
-0.98% |
|
Volume |
953,693,961 |
+9% |
|
Volume |
5,532,634,400 |
+18% |
|
NASDAQ |
-310.47 |
13,973.45 |
-2.17% |
|
Advancers |
627 |
22% |
|
Advancers |
1,276 |
29% |
|
S&P 500 |
-63.34 |
4,513.39 |
-1.38% |
|
Decliners |
2,248 |
78% |
|
Decliners |
3,097 |
71% |
|
Russell 2000 |
-27.33 |
1,966.83 |
-1.37% |
|
52 Wk Highs |
58 |
|
|
52 Wk Highs |
56 |
|
|
S&P 600 |
-11.23 |
1,264.89 |
-0.88% |
|
52 Wk Lows |
33 |
|
|
52 Wk Lows |
121 |
|
|
 |
Indices Fell and Distributional Pressure Raised Concerns
Kenneth J. Gruneisen - Passed the CAN SLIM® Master's Exam
The S&P 500 dropped -1.3%, while the Dow Jones Industrial Average fell nearly 1%, and the tech-heavy Nasdaq Composite slid more than 2%. All 3 major indices clearly lost ground as Wednesday's volume totals reported were higher on the NYSE and on the Nasdaq exchange versus the prior session, action indicative of an increase in institutional selling pressure. Breadth was clearly negative as decliners led advancers by more than a 3-1 margin on the NYSE and by 5-2 on the Nasdaq exchange. There were 31 high-ranked companies from the Leaders List that hit a new 52-week high and were listed on the BreakOuts Page, down from the total of 49 on the prior session. New 52-week highs outnumbered new 52-week lows on the NYSE but new lows outnumbered new highs on the Nasdaq exchange. The major indices are in an uptrend that is encountering pressure (M criteria) while leadership has been waning. Appropriate new buying efforts may still be considered under the fact-based investment system.Greater caution may be necessary in the event of a more serious correction.
PICTURED: The Nasdaq Composite Index is pulling back toward its 50-day moving average (DMA) line.
U.S. stocks plunged after rating agency Fitch downgraded the US government's credit rating, citing fiscal and political instability. The downgrade drew a response from the Biden administration's Treasury Department calling it "arbitrary". Fitch spotlighted the US's growing levels of debt, as well as political instability including the Jan. 6, 2021 events at the Capitol as factors.
Investors also reacted to another full day of earnings while anticipating more throughout the week. Standout decliners included Generac Holdings Inc (GNRC -24.4%), SolarEdge Technologies Inc (SEDG -18.36%), Paycom Software Inc (-19.19%), and Louisiana-Pacific Corp (LPX -11.76%). Meanwhile, great gains came from Vertiv Holdings Co (VRT +29.25%), e.l.f Beauty Inc (ELF +14.33%), and Teva Pharmaceutical Industries Limited (TEVA +11.58%).
|
 Kenneth J. Gruneisen started out as a licensed stockbroker in August 1987, a couple of months prior to the historic stock market crash that took the Dow Jones Industrial Average down -22.6% in a single day. He has published daily fact-based fundamental and technical analysis on high-ranked stocks online for two decades. Through FACTBASEDINVESTING.COM, Kenneth provides educational articles, news, market commentary, and other information regarding proven investment systems that work in good times and bad.
Comments contained in the body of this report are technical opinions only and are not necessarily those of Gruneisen Growth Corp. The material herein has been obtained from sources believed to be reliable and accurate, however, its accuracy and completeness cannot be guaranteed. Our firm, employees, and customers may effect transactions, including transactions contrary to any recommendation herein, or have positions in the securities mentioned herein or options with respect thereto. Any recommendation contained in this report may not be suitable for all investors and it is not to be deemed an offer or solicitation on our part with respect to the purchase or sale of any securities. |
|
 |
Financial, Retail, Tech, and Commodity-Linked Groups Fell
Kenneth J. Gruneisen - Passed the CAN SLIM® Master's Exam
The Retail Index ($RLX -1.99%), Bank Index ($BKX -1.10%) and the Broker/Dealer Index ($XBD -0.51) each lost ground. The tech sector was led lower by the Semiconductor Index ($SOX -3.80%) while the Networking Index ($NWX -0.93%) and the Biotech Index ($BTK -0.76%) each sufffered a smaller loss. Commodity-linked groups had a negative bias as the Gold & Silver Index ($XAU -2.85%) outpaced the Oil Services Index ($OSX -0.76%) and the Integrated Oil Index ($XOI -1.55%) to the downside.
PICTURED: The Biotech Index ($BTK -0.76%) has slumped below its 50-day and 200-day moving average (DMA) lines again.
| Oil Services |
$OSX |
92.41 |
-0.70 |
-0.76% |
+10.20% |
| Integrated Oil |
$XOI |
1,806.22 |
-28.39 |
-1.55% |
+1.06% |
| Semiconductor |
$SOX |
3,711.60 |
-146.61 |
-3.80% |
+46.58% |
| Networking |
$NWX |
818.64 |
-7.76 |
-0.94% |
+4.51% |
| Broker/Dealer |
$XBD |
507.63 |
-2.58 |
-0.51% |
+13.03% |
| Retail |
$RLX |
3,467.85 |
-70.35 |
-1.99% |
+25.92% |
| Gold & Silver |
$XAU |
119.07 |
-3.49 |
-2.85% |
-1.48% |
| Bank |
$BKX |
87.48 |
-0.97 |
-1.10% |
-13.25% |
| Biotech |
$BTK |
5,236.95 |
-40.27 |
-0.76% |
-0.84% |
|
|
|
 |
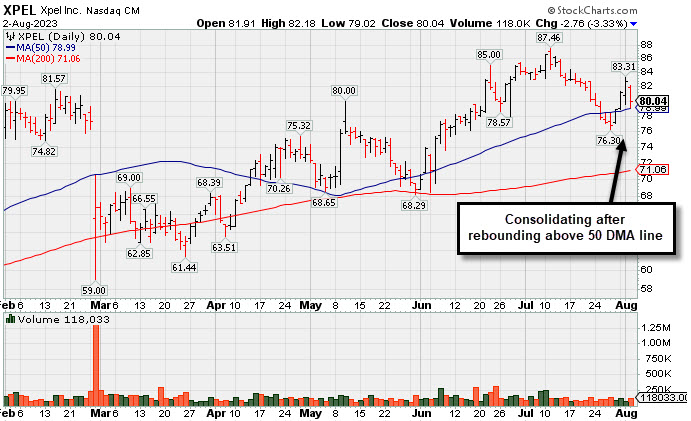
Consolidating After Rebounding Above 50-Day Moving Average
Kenneth J. Gruneisen - Passed the CAN SLIM® Master's Exam
Xpel Inc (XPEL -$2.76 or -3.33% to $80.04) has been consolidating with mostly below averager volume after rebounding back above its 50-day moving average (DMA) line ($78.99). It stalled after recently hitting a new 52-week high and it is perched -9.9% off its 52-week high. Keep in mid it is due to report Jun '23 quarterly earnings on 8/09/23. Volume and volatility often increase near earnings news.
XPEL was highlighted in yellow with pivot point cited based on its 8/15/23 high plus 10 cents in the 6/28/23 mid-day report (read here). It reported Mar '23 quarterly earnings +46% on +19% sales revenues versus the year ago period, its 3rd quarterly comparison above the +25% minimum earnings guideline (C criteria), helping it better match the winning models of the fact-based investment system.
This Auto/Truck - Replacement Parts firm has a 99 Earnings Per Share Rating. It was last shown in this FSU section on 6/28/23 under the headline, "XPEL Returns to Featured Stocks List After Long Consolidation'". Annual earnings growth remained strong while it went through a deep consolidation since dropped from the Featured Stocks list on 8/13/21.
The number of top-rated funds owning its shares rose from 45 in Mar '20 to 342 in Jun '23, a reassuring sign concerning the I criteria. Its current Up/Down Volume Ratio of 0.9 is an unbiased indication its shares have been under slight distributional pressure over the past 50 days. Its small supply of only 27.6 million shares outstanding (S criteria) can contribute to greater volatility in the event of institutional buying or selling.
|
|
|
Color Codes Explained :
Y - Better candidates highlighted by our
staff of experts.
G - Previously featured
in past reports as yellow but may no longer be buyable under the
guidelines.
***Last / Change / Volume data in this table is the closing quote data***
Symbol/Exchange
Company Name
Industry Group |
PRICE |
CHANGE
(%Change) |
Day High |
Volume
(% DAV)
(% 50 day avg vol) |
52 Wk Hi
% From Hi |
Featured
Date |
Price
Featured |
Pivot Featured |
|
Max Buy |
 STRL
-
NASDAQ
STRL
-
NASDAQ
Sterling Infrastructure
Bldg-Heavy Construction
|
$61.75
|
-1.23
-1.95% |
$63.19
|
320,020
94.40% of 50 DAV
50 DAV is 339,000
|
$63.21
-2.31%
|
12/14/2022
|
$32.41
|
PP = $33.72
|
|
MB = $35.41
|
Most Recent Note - 8/1/2023 1:02:46 PM
G - Posting a 6th consecutive gain today for a new all-time high. It is very extended from any sound base and its 50 DMA line ($54) defines near-term support to watch. Mar '23 quarterly earnings were below the +25% minimum guideline (C criteria) raising fundamental concerns.
>>> FEATURED STOCK ARTICLE : Streak of Gains Lifts Sterling Infrastructure to New Highs - 7/3/2023 |
View all notes |
Set NEW NOTE alert |
Company Profile |
SEC
News |
Chart |
Request a new note
C
A
S
I |
FIX
-
NYSE
Comfort Systems USA
Bldg-A/C and Heating Prds
|
$174.76
|
+1.10
0.63% |
$175.84
|
126,032
56.26% of 50 DAV
50 DAV is 224,000
|
$176.27
-0.86%
|
4/27/2023
|
$148.85
|
PP = $152.23
|
|
MB = $159.84
|
Most Recent Note - 7/28/2023 6:00:19 PM
G - Hit a new all-time high today after testing its 50 DMA line ($159) on the prior session. Reported Jun '23 quarterly earnings +65% on +27% versus the year ago period. Volume and volatility often increase near earnings news.
>>> FEATURED STOCK ARTICLE : Pulled Back From High With Lighter Volume - 7/19/2023 |
View all notes |
Set NEW NOTE alert |
Company Profile |
SEC
News |
Chart |
Request a new note
C
A
S
I |
KOF
-
NYSE
Coca-Cola Femsa ADR
Beverages-Non-Alcoholic
|
$82.47
|
-1.23
-1.47% |
$83.45
|
101,940
63.32% of 50 DAV
50 DAV is 161,000
|
$91.23
-9.60%
|
6/9/2023
|
$88.61
|
PP = $91.33
|
|
MB = $95.90
|
 Most Recent Note - 8/2/2023 6:01:06 PM
G - Reported Jun '23 quarterly earnings +23% on +26% sales revenues versus the year-ago period, below the +25% minimum guideline (C criteria). Its Relative Strength Rating has slumped to 79 while meeting resistance and lingering below its 50 DMA line. A rebound above the 50 DMA line ($84.76) is needed for its outlook to improve.
>>> FEATURED STOCK ARTICLE : Slumping Below 50-Day Moving Average and Below Prior Low - 7/6/2023 |
View all notes |
Set NEW NOTE alert |
Company Profile |
SEC
News |
Chart |
Request a new note
C
A
S
I |
CLH
-
NYSE
Clean Harbors
Pollution Control
|
$167.80
|
+1.06
0.64% |
$174.10
|
593,444
153.34% of 50 DAV
50 DAV is 387,000
|
$172.54
-2.75%
|
3/10/2023
|
$136.89
|
PP = $136.74
|
|
MB = $143.58
|
Most Recent Note - 8/2/2023 5:59:00 PM
G - Hit a new all-time high today while trading higher volume but ending little changed. Reported earnings for the Jun '23 quarter -13% on +3% sales revenues versus the year ago period, below the +25% minimum earnings guideline (C criteria), raising fundamental concerns. , extended from any sound base. Its 50 DMA line ($159) defines important near-term support to watch on pullbacks.
>>> FEATURED STOCK ARTICLE : Negative Reversal at High After +26% Rally in 4 Months - 7/18/2023 |
View all notes |
Set NEW NOTE alert |
Company Profile |
SEC
News |
Chart |
Request a new note
C
A
S
I |
SPSC
-
NASDAQ
SPS Commerce
Comp Sftwr-Spec Enterprs
|
$168.80
|
-6.36
-3.63% |
$174.64
|
265,775
126.56% of 50 DAV
50 DAV is 210,000
|
$196.39
-14.05%
|
4/24/2023
|
$150.01
|
PP = $157.56
|
|
MB = $165.44
|
Most Recent Note - 8/2/2023 6:06:42 PM
G - Suffered a damaging loss and slumped further below its 50 DMA line ($177) and its color code is changed to green. A rebound above the 50 DMA line is needed for its outlook to improve. Reported Jun '23 quarterly earnings +30% on +19% sales revenues versus the year-ago period.
>>> FEATURED STOCK ARTICLE : Pulled Back Abruptly to 50-Day Moving Average Line - 7/24/2023 |
View all notes |
Set NEW NOTE alert |
Company Profile |
SEC
News |
Chart |
Request a new note
C
A
S
I |
Symbol/Exchange
Company Name
Industry Group |
PRICE |
CHANGE
(%Change) |
Day High |
Volume
(% DAV)
(% 50 day avg vol) |
52 Wk Hi
% From Hi |
Featured
Date |
Price
Featured |
Pivot Featured |
|
Max Buy |
HUBB
-
NYSE
Hubbell
Electrical-Power/Equipmt
|
$313.19
|
-2.51
-0.80% |
$315.28
|
450,024
105.64% of 50 DAV
50 DAV is 426,000
|
$340.06
-7.90%
|
4/25/2023
|
$262.85
|
PP = $257.51
|
|
MB = $270.39
|
Most Recent Note - 7/26/2023 5:38:35 PM
G - Abruptly retreated from its all-time high with today's 2nd consecutive volume-driven undercutting its 50 DMA line ($311) raising concerns. Fundamentals remain strong after Jun '23 earnings rose +45%. See the latest FSU analysis for more details and a new annotated graph.
>>> FEATURED STOCK ARTICLE : Pulled Back Undercutting 50 Day Moving Average Line - 7/26/2023 |
View all notes |
Set NEW NOTE alert |
Company Profile |
SEC
News |
Chart |
Request a new note
C
A
S
I |
NVR
-
NYSE
N V R Inc
MATERIALS and CONSTRUCTION - Residential Construction
|
$6,303.84
|
-20.16
-0.32% |
$6,326.95
|
18,318
78.62% of 50 DAV
50 DAV is 23,300
|
$6,474.53
-2.64%
|
4/25/2023
|
$5,882.18
|
PP = $5,978.25
|
|
MB = $6,277.16
|
Most Recent Note - 7/27/2023 7:50:27 PM
G - Pulled back today with above average volume. Reported Jun '23 quarterly earnings -6% on -13% sales revenues raising greater fundamental concerns. Its prior low ($6,009 on 7/06) and 50 DMA line ($6,028) define near-term support watch.
>>> FEATURED STOCK ARTICLE : New High Close for Strong Homebuilder - 6/30/2023 |
View all notes |
Set NEW NOTE alert |
Company Profile |
SEC
News |
Chart |
Request a new note
C
A
S
I |
PHM
-
NYSE
PulteGroup
Bldg-Resident/Comml
|
$83.56
|
-1.06
-1.25% |
$84.38
|
2,230,802
80.10% of 50 DAV
50 DAV is 2,785,000
|
$86.01
-2.85%
|
4/25/2023
|
$65.17
|
PP = $64.01
|
|
MB = $67.21
|
Most Recent Note - 7/27/2023 7:42:23 PM
G - There was a "negative reversal" today after hitting another new high. It is very extended from any sound base. Recently reported earnings +18% for the Jun '23 quarter versus the year-ago period, below the +25% minimum guideline (C criteria) raising concerns. Important support to watch is defined by its 50 DMA line ($74.54). See the latest FSU analysis for more details and a new annotated graph.
>>> FEATURED STOCK ARTICLE : Reversed After Reaching a New All-Time High - 7/27/2023 |
View all notes |
Set NEW NOTE alert |
Company Profile |
SEC
News |
Chart |
Request a new note
C
A
S
I |
AMPH
-
NASDAQ
Amphastar Pharm
Medical-Biomed/Biotech
|
$61.69
|
+1.05
1.73% |
$62.96
|
258,189
59.49% of 50 DAV
50 DAV is 434,000
|
$63.72
-3.19%
|
5/15/2023
|
$43.56
|
PP = $44.15
|
|
MB = $46.36
|
Most Recent Note - 8/2/2023 6:02:40 PM
G - Still hovering near its all-time high with volume totals cooling. It has not formed a sound new base of sufficient length. Its 50 DMA line ($53.75) defines important support to watch. Fundamentals remain strong.
>>> FEATURED STOCK ARTICLE : 6th Straight Gain for Amphastar - 7/20/2023 |
View all notes |
Set NEW NOTE alert |
Company Profile |
SEC
News |
Chart |
Request a new note
C
A
S
I |
ANET
-
NYSE
Arista Networks
Computer-Networking
|
$177.28
|
-8.33
-4.49% |
$183.84
|
4,242,933
113.78% of 50 DAV
50 DAV is 3,729,000
|
$190.65
-7.01%
|
8/1/2023
|
$188.84
|
PP = $178.46
|
|
MB = $187.38
|
Most Recent Note - 8/2/2023 6:04:28 PM
Y - Gapped down today negating a portion of the considerable volume-driven gain on the prior session and slumping near the prior high and pivot point. Color code was changed to yellow with new pivot point cited based on its 5/30/23 high plus 10 cents. Bullish action came after it reported Jun '23 quarterly earnings +40% on +39% sales revenues versus the year-ago period. Volume and volatility often increase near earnings news.
>>> FEATURED STOCK ARTICLE : Wedging Higher After Rebounding Above 50-Day Moving Average - 7/12/2023 |
View all notes |
Set NEW NOTE alert |
Company Profile |
SEC
News |
Chart |
Request a new note
C
A
S
I |
Symbol/Exchange
Company Name
Industry Group |
PRICE |
CHANGE
(%Change) |
Day High |
Volume
(% DAV)
(% 50 day avg vol) |
52 Wk Hi
% From Hi |
Featured
Date |
Price
Featured |
Pivot Featured |
|
Max Buy |
PANW
-
NASDAQ
Palo Alto Networks
Computer Sftwr-Security
|
$236.17
|
-17.00
-6.71% |
$249.40
|
6,238,477
95.95% of 50 DAV
50 DAV is 6,502,000
|
$258.88
-8.77%
|
6/5/2023
|
$228.35
|
PP = $213.73
|
|
MB = $224.42
|
Most Recent Note - 7/31/2023 4:58:13 PM
G - Posted a 4th consecutive gain today with light volume. Volume totals have been cooling while consolidating above its 50 DMA line ($234) which defines near-term support to watch. Fundamentals remain strong. See the latest FSU analysis for more details and a new annotated graph.
>>> FEATURED STOCK ARTICLE : Volume Cooling While Hovering Near High - 7/31/2023 |
View all notes |
Set NEW NOTE alert |
Company Profile |
SEC
News |
Chart |
Request a new note
C
A
S
I |
LSCC
-
NASDAQ
Lattice Semiconductor
Elec-Semicondctor Fablss
|
$91.16
|
-1.82
-1.96% |
$92.19
|
3,089,852
138.50% of 50 DAV
50 DAV is 2,231,000
|
$98.18
-7.15%
|
6/13/2023
|
$91.73
|
PP = $96.92
|
|
MB = $101.77
|
Most Recent Note - 7/27/2023 7:44:48 PM
Y - Color code is changed to yellow after today's gap up and big volume-driven gain helped it promptly rebound above the 50 DMA line helping its outlook improve, Due to report Jun '23 quarterly results on 7/31/23.
>>> FEATURED STOCK ARTICLE : Perched Near Pivot Point After Best-Ever Close - 7/17/2023 |
View all notes |
Set NEW NOTE alert |
Company Profile |
SEC
News |
Chart |
Request a new note
C
A
S
I |
XPEL
-
NASDAQ
XPEL
Auto/Truck-Replace Parts
|
$80.04
|
-2.76
-3.33% |
$82.18
|
118,033
90.79% of 50 DAV
50 DAV is 130,000
|
$87.46
-8.48%
|
6/28/2023
|
$83.14
|
PP = $87.11
|
|
MB = $91.47
|
Most Recent Note - 7/31/2023 4:25:08 PM
Y - Color code was changed to yellow after rebounding back above its 50 DMA line ($78.68) with 2 consecutive gains. Stalled after recently hitting a new 52-week high. Reported Mar '23 quarterly earnings +46% on +19% sales revenues versus the year-ago period, its 3rd quarterly comparison above the +25% minimum earnings guideline (C criteria), helping it better match the winning models of the fact-based investment system.
>>> FEATURED STOCK ARTICLE : Consolidating After Rebounding Above 50-Day Moving Average - 8/2/2023 |
View all notes |
Set NEW NOTE alert |
Company Profile |
SEC
News |
Chart |
Request a new note
C
A
S
I |
FTNT
-
NASDAQ
Fortinet
Computer Sftwr-Security
|
$74.32
|
-3.71
-4.75% |
$77.24
|
5,588,633
103.78% of 50 DAV
50 DAV is 5,385,000
|
$81.24
-8.52%
|
7/10/2023
|
$78.29
|
PP = $74.45
|
|
MB = $78.17
|
Most Recent Note - 8/2/2023 6:05:28 PM
Y - Suffered a large loss today with higher (near average) volume. Its prior high in the $74 area defines support above its 50 DMA line ($73.43) Fundamentals remain strong.
>>> FEATURED STOCK ARTICLE : Fortinet Powered to New All-Time High - 7/10/2023 |
View all notes |
Set NEW NOTE alert |
Company Profile |
SEC
News |
Chart |
Request a new note
C
A
S
I |
PII
-
NYSE
Polaris
Leisure-Products
|
$133.50
|
+0.62
0.47% |
$133.73
|
436,861
71.73% of 50 DAV
50 DAV is 609,000
|
$138.49
-3.60%
|
7/11/2023
|
$126.92
|
PP = $123.97
|
|
MB = $130.17
|
Most Recent Note - 7/31/2023 5:06:08 PM
G - Posted a gain today with above average volume. Reported Jun '23 quarterly earnings +0% versus the year ago period, below the +25% minimum earnings guideline (C criteria). On pullbacks, the prior highs define initial support to watch above its 50 DMA line ($120.73).
>>> FEATURED STOCK ARTICLE : Volume-Driven Breakout for Polaris - 7/11/2023 |
View all notes |
Set NEW NOTE alert |
Company Profile |
SEC
News |
Chart |
Request a new note
C
A
S
I |
Symbol/Exchange
Company Name
Industry Group |
PRICE |
CHANGE
(%Change) |
Day High |
Volume
(% DAV)
(% 50 day avg vol) |
52 Wk Hi
% From Hi |
Featured
Date |
Price
Featured |
Pivot Featured |
|
Max Buy |
ALGM
-
NASDAQ
Allegro MicroSystems
Elec-Semicondctor Fablss
|
$43.22
|
-2.02
-4.47% |
$45.00
|
3,136,998
210.96% of 50 DAV
50 DAV is 1,487,000
|
$53.05
-18.53%
|
7/13/2023
|
$49.86
|
PP = $48.82
|
|
MB = $51.26
|
Most Recent Note - 8/1/2023 12:40:58 PM
G - Gapped down today undercutting the prior low with a big volume-driven loss raising concerns and its color code is changed to green. Reported Jun '23 quarterly earnings +63% versus the year-ago period. Volume and volatility often increase near earnings news. Disciplined investors always limit losses by selling any stock that falls more than -8% from their purchase price.
>>> FEATURED STOCK ARTICLE : Volume Heavy Behind Considerable Breakout Gain - 7/13/2023 |
View all notes |
Set NEW NOTE alert |
Company Profile |
SEC
News |
Chart |
Request a new note
C
A
S
I |
ESQ
-
NASDAQ
Esquire Finl Hldgs
Finance-Commercial Loans
|
$49.85
|
+0.01
0.02% |
$49.96
|
28,867
96.22% of 50 DAV
50 DAV is 30,000
|
$54.03
-7.74%
|
7/14/2023
|
$45.80
|
PP = $48.23
|
|
MB = $50.64
|
Most Recent Note - 7/27/2023 7:46:46 PM
Y - Color code is changed to yellow after pulling back below its "max buy" level. Found support above its 50 DMA line on the recent pullback.
>>> FEATURED STOCK ARTICLE : Esquire Perched Near Prior Highs - 7/14/2023 |
View all notes |
Set NEW NOTE alert |
Company Profile |
SEC
News |
Chart |
Request a new note
C
A
S
I |
MEDP
-
NASDAQ
Medpace Holdings
Medical-Research Eqp/Svc
|
$255.29
|
-0.35
-0.14% |
$255.99
|
167,812
42.92% of 50 DAV
50 DAV is 391,000
|
$264.19
-3.37%
|
7/25/2023
|
$196.32
|
PP = $241.57
|
|
MB = $253.65
|
Most Recent Note - 7/27/2023 7:53:30 PM
Y - Pulled back with average volume today for a 2nd consecutive loss after hitting a new all-time high. Prior highs in the $241 area define support to watch on pullbacks. Reported earnings increases above the +25% minimum earnings guideline (C criteria) in the past 5 quarterly comparisons through Jun '23.
>>> FEATURED STOCK ARTICLE : Medpace Posted a Solid Volume-Driven Gain for a New High - 7/25/2023 |
View all notes |
Set NEW NOTE alert |
Company Profile |
SEC
News |
Chart |
Request a new note
C
A
S
I |
|
|
|
THESE ARE NOT BUY RECOMMENDATIONS!
Comments contained in the body of this report are technical
opinions only. The material herein has been obtained
from sources believed to be reliable and accurate, however,
its accuracy and completeness cannot be guaranteed.
This site is not an investment advisor, hence it does
not endorse or recommend any securities or other investments.
Any recommendation contained in this report may not
be suitable for all investors and it is not to be deemed
an offer or solicitation on our part with respect to
the purchase or sale of any securities. All trademarks,
service marks and trade names appearing in this report
are the property of their respective owners, and are
likewise used for identification purposes only.
This report is a service available
only to active Paid Premium Members.
You may opt-out of receiving report notifications
at any time. Questions or comments may be submitted
by writing to Premium Membership Services 665 S.E. 10 Street, Suite 201 Deerfield Beach, FL 33441-5634 or by calling 1-800-965-8307
or 954-785-1121.
|
|
|