You are not logged in.
This means you
CAN ONLY VIEW reports that were published prior to Thursday, March 20, 2025.
You
MUST UPGRADE YOUR MEMBERSHIP if you want to see any current reports.
AFTER MARKET UPDATE - WEDNESDAY, JULY 12TH, 2023
Previous After Market Report Next After Market Report >>>
|
|
|
|
DOW |
+86.01 |
34,347.43 |
+0.25% |
|
Volume |
882,078,868 |
+11% |
|
Volume |
5,236,310,500 |
+7% |
|
NASDAQ |
+158.26 |
13,918.96 |
+1.15% |
|
Advancers |
2,080 |
73% |
|
Advancers |
2,860 |
64% |
|
S&P 500 |
+33.12 |
4,472.38 |
+0.75% |
|
Decliners |
783 |
27% |
|
Decliners |
1,575 |
36% |
|
Russell 2000 |
+20.02 |
1,933.38 |
+1.05% |
|
52 Wk Highs |
205 |
|
|
52 Wk Highs |
225 |
|
|
S&P 600 |
+12.95 |
1,239.85 |
+1.06% |
|
52 Wk Lows |
8 |
|
|
52 Wk Lows |
53 |
|
|
 |
Major Indices Rose With More Leadership and Higher Volume Totals
Kenneth J. Gruneisen - Passed the CAN SLIM® Master's Exam
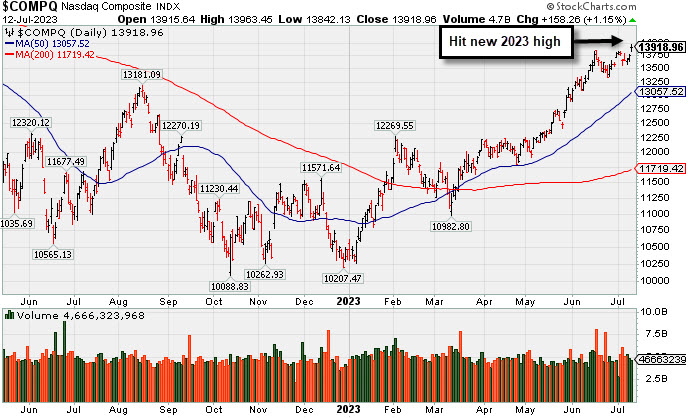
The market-cap weighted S&P 500 rose 0.7%. The volume totals reported were higher on the NYSE and on the Nasdaq exchange versus the prior session, indicative of increasing institutional buying demand. Breadth was solidly positive as advancers led decliners by more than a 5-2 margin on the NYSE and by a 7-4 margin on the Nasdaq exchange. Leadership improved as there were 105 high-ranked companies from the Leaders List that hit a new 52-week high and were listed on the BreakOuts Page, versus the total of 78 on the prior session. New 52-week highs totals expanded and solidly outnumbered new 52-week lows totals on the NYSE and on the Nasdaq exchange. The major indices are in a confirmed uptrend (M criteria). Appropriate new buying efforts may be considered under the fact-based investment system.
PICTURED: The Nasdaq Composite Index posted a solid gain and hit a new 2023 high.
Investors reacted favorably to the June Consumer Price Index (CPI), leading the S&P 500 and Nasdaq Composite to hit new 52-week highs. Total CPI and core CPI, which excludes food and energy, were both up a smaller-than-expected 0.2%, which left their year-over-year rates at 3.0% and 4.8%, respectively, versus 4.0% and 5.3% in May. That is the smallest 12-month increase in total CPI since March 2021.
Two of the S&P 500 sectors declined - health care (-0.3%) and industrials (-0.2%). Communication services (+1.5%), utilities (+1.5%), and the materials (+1.3%) sectors were top gainers.
Treasury yields took a sharp turn lower in response to the data. The 2-yr note yield plunged 16 basis points to 4.73%. The 10-yr note yield dropped 12 basis points to 3.86%. Separately, the $32 billion 10-yr note reopening met lukewarm demand. The U.S. Dollar Index, meanwhile, declined for the fifth consecutive day, falling 1.2% to 100.54.
|
 Kenneth J. Gruneisen started out as a licensed stockbroker in August 1987, a couple of months prior to the historic stock market crash that took the Dow Jones Industrial Average down -22.6% in a single day. He has published daily fact-based fundamental and technical analysis on high-ranked stocks online for two decades. Through FACTBASEDINVESTING.COM, Kenneth provides educational articles, news, market commentary, and other information regarding proven investment systems that work in good times and bad.
Comments contained in the body of this report are technical opinions only and are not necessarily those of Gruneisen Growth Corp. The material herein has been obtained from sources believed to be reliable and accurate, however, its accuracy and completeness cannot be guaranteed. Our firm, employees, and customers may effect transactions, including transactions contrary to any recommendation herein, or have positions in the securities mentioned herein or options with respect thereto. Any recommendation contained in this report may not be suitable for all investors and it is not to be deemed an offer or solicitation on our part with respect to the purchase or sale of any securities. |
|
 |
Gold & Silver Index Led Financial, Retail, Energy, and Tech Indexes
Kenneth J. Gruneisen - Passed the CAN SLIM® Master's Exam
The Bank Index ($BKX +1.10%), Broker/Dealer Index ($XBD +0.86%), and the Retail Index ($RLX +1.21%) posted unanimous gains that helped boost the major averages. The tech sector had a positive bias as the Biotech Index ($BTK +1.27%) and the Semiconductor Index ($SOX +1.865%) both posted solid gains, meanwhile the Networking Index ($NWX -0.24%) edged lower. Energy-linked shares rose as the Integrated Oil Index ($XOI +0.95%) and Oil Services Index ($OSX +0.82%) both posted small gains. The Gold & Silver Index ($XAU +5.27%) was a standout gainer.
PICTURED: The Retail Index ($RLX +1.21%) posted a solid gain rallying to a new 2023 high and toward its August 2022 high.
| Oil Services |
$OSX |
87.93 |
+0.72 |
+0.82% |
+4.85% |
| Integrated Oil |
$XOI |
1,732.19 |
+16.41 |
+0.96% |
-3.08% |
| Semiconductor |
$SOX |
3,721.47 |
+67.95 |
+1.86% |
+46.97% |
| Networking |
$NWX |
869.77 |
-2.30 |
-0.26% |
+11.04% |
| Broker/Dealer |
$XBD |
486.01 |
+4.15 |
+0.86% |
+8.21% |
| Retail |
$RLX |
3,510.34 |
+41.89 |
+1.21% |
+27.46% |
| Gold & Silver |
$XAU |
126.98 |
+6.35 |
+5.27% |
+5.06% |
| Bank |
$BKX |
83.16 |
+0.91 |
+1.11% |
-17.54% |
| Biotech |
$BTK |
5,277.77 |
+65.97 |
+1.27% |
-0.06% |
|
|
|
 |
Wedging Higher After Rebounding Above 50-Day Moving Average
Kenneth J. Gruneisen - Passed the CAN SLIM® Master's Exam
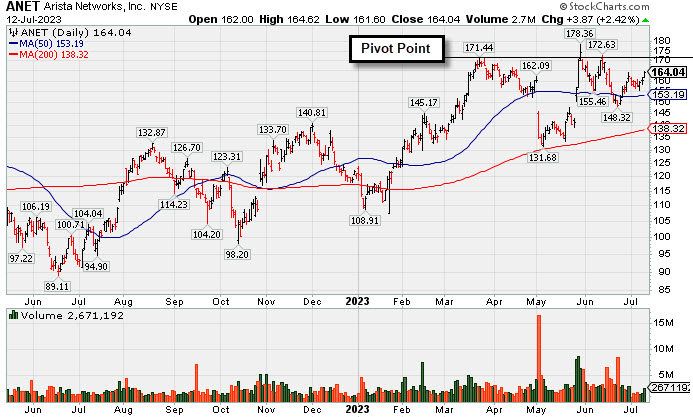
Arista Networks Inc (ANET +$3.78 or +2.36% to $163.95) posted a 3rd consecutive gain backed by below average volume. Volume totals have been cooling while consolidating above its 50-day moving average (DMA) line ($153.19). It faces near-term resistance due to overhead supply up to the $178 level. Fundamentals remain strong.
ANET was highlighted in yellow with pivot point cited based on its 12/27/21 high plus 10 cents in the 3/08/23 mid-day report (read here). It sputtered below its 50 DMA line briefly and then rebounded since last shown in this FSU section on 6/12/23 with an annotated graph under the headline, "Rebounding Near Recent High With 3 Consecutive Gains".
ANET currently has a 98 Earnings Per Share Rating. It has shown 6 consecutive quarterly comparisons with strong and steady above the +25% minimum earnings guideline (C criteria). Annual earnings (A criteria) had a downturn in FY '20 like many companies during the pandemic.
The number of top-rated funds owning its shares rose from 1,758 in Dec '21 to 2,231 in Jun '23, a reassuring sign concerning the I criteria. Its current Up/Down Volume Ratio of 1.0 is an unbiased indication its shares have been neutral concerning accumulation/distribution over the past 50 days. The high-ranked Computer - Networking firm has a Timeliness Rating of A and a Sponsorship Rating of C. Its small supply of 249.7 million shares (S criteria) in the public float may contribute to greater volatility in the event of institutional buying or selling.
|
|
|
Color Codes Explained :
Y - Better candidates highlighted by our
staff of experts.
G - Previously featured
in past reports as yellow but may no longer be buyable under the
guidelines.
***Last / Change / Volume data in this table is the closing quote data***
Symbol/Exchange
Company Name
Industry Group |
PRICE |
CHANGE
(%Change) |
Day High |
Volume
(% DAV)
(% 50 day avg vol) |
52 Wk Hi
% From Hi |
Featured
Date |
Price
Featured |
Pivot Featured |
|
Max Buy |
 STRL
-
NASDAQ
STRL
-
NASDAQ
Sterling Infrastructure
Bldg-Heavy Construction
|
$58.49
|
-0.02
-0.03% |
$59.25
|
141,946
44.78% of 50 DAV
50 DAV is 317,000
|
$59.48
-1.66%
|
12/14/2022
|
$32.41
|
PP = $33.72
|
|
MB = $35.41
|
Most Recent Note - 7/11/2023 8:28:18 PM
G - Posted a 3rd consecutive gain with lighter volume, perched near its all-time high, very extended from any sound base. Mar '23 quarterly earnings were below the +25% minimum guideline (C criteria) raising fundamental concerns.
>>> FEATURED STOCK ARTICLE : Streak of Gains Lifts Sterling Infrastructure to New Highs - 7/3/2023 |
View all notes |
Set NEW NOTE alert |
Company Profile |
SEC
News |
Chart |
Request a new note
C
A
S
I |
FIX
-
NYSE
Comfort Systems USA
Bldg-A/C and Heating Prds
|
$165.57
|
+1.57
0.96% |
$166.38
|
39,848
15.69% of 50 DAV
50 DAV is 254,000
|
$167.53
-1.17%
|
4/27/2023
|
$148.85
|
PP = $152.23
|
|
MB = $159.84
|
Most Recent Note - 7/7/2023 8:52:05 PM
G - Volume totals have been cooling while still hovering near its all-time high and near its "max buy" level. No resistance remains due to overhead supply. Its 50 DMA line ($154.51) defines important near-term support to watch.
>>> FEATURED STOCK ARTICLE : "Negative Reversal" Following Recent Volume-Driven Gains - 6/16/2023 |
View all notes |
Set NEW NOTE alert |
Company Profile |
SEC
News |
Chart |
Request a new note
C
A
S
I |
KOF
-
NYSE
Coca-Cola Femsa ADR
Beverages-Non-Alcoholic
|
$82.55
|
+1.60
1.97% |
$82.66
|
64,100
37.05% of 50 DAV
50 DAV is 173,000
|
$91.23
-9.52%
|
6/9/2023
|
$88.61
|
PP = $91.33
|
|
MB = $95.90
|
Most Recent Note - 7/11/2023 12:44:09 PM
G - Recovered from early lows but today's loss with higher volume adds to damaging losses below the prior low ($81.63 on 5/31/23) which raised greater concerns. A prompt rebound above the 50 DMA line ($86.17) is needed for its outlook to improve. Fundamentals remain strong.
>>> FEATURED STOCK ARTICLE : Slumping Below 50-Day Moving Average and Below Prior Low - 7/6/2023 |
View all notes |
Set NEW NOTE alert |
Company Profile |
SEC
News |
Chart |
Request a new note
C
A
S
I |
CLH
-
NYSE
Clean Harbors
Pollution Control
|
$166.70
|
-1.38
-0.82% |
$170.74
|
136,160
33.45% of 50 DAV
50 DAV is 407,000
|
$172.54
-3.38%
|
3/10/2023
|
$136.89
|
PP = $136.74
|
|
MB = $143.58
|
Most Recent Note - 7/11/2023 8:32:56 PM
G - Volume was heavy today while there was a "negative reversal" after touching a new all-time high. It is extended from any sound base. Its 50 DMA line ($150.46) and prior high define important near-term support to watch on pullbacks. Fundamentals remain strong.
>>> FEATURED STOCK ARTICLE : Extended From Any Sound Base and Hovering Near High - 6/15/2023 |
View all notes |
Set NEW NOTE alert |
Company Profile |
SEC
News |
Chart |
Request a new note
C
A
S
I |
SPSC
-
NASDAQ
SPS Commerce
Comp Sftwr-Spec Enterprs
|
$187.39
|
+0.38
0.20% |
$190.42
|
40,615
21.49% of 50 DAV
50 DAV is 189,000
|
$192.67
-2.74%
|
4/24/2023
|
$150.01
|
PP = $157.56
|
|
MB = $165.44
|
Most Recent Note - 7/11/2023 8:26:47 PM
G - Posted a 2nd consecutive gain with above average volume. Still very extended from the previously noted base. Reported Mar '23 quarterly earnings +22% on +20% versus the year-ago period, below the +25% minimum earnings guideline (C criteria) raising some fundamental concerns.
>>> FEATURED STOCK ARTICLE : Perched Near High Following Noted Volume-Driven Gains - 6/21/2023 |
View all notes |
Set NEW NOTE alert |
Company Profile |
SEC
News |
Chart |
Request a new note
C
A
S
I |
Symbol/Exchange
Company Name
Industry Group |
PRICE |
CHANGE
(%Change) |
Day High |
Volume
(% DAV)
(% 50 day avg vol) |
52 Wk Hi
% From Hi |
Featured
Date |
Price
Featured |
Pivot Featured |
|
Max Buy |
HUBB
-
NYSE
Hubbell
Electrical-Power/Equipmt
|
$332.12
|
-0.75
-0.23% |
$335.92
|
98,618
25.03% of 50 DAV
50 DAV is 394,000
|
$337.23
-1.52%
|
4/25/2023
|
$262.85
|
PP = $257.51
|
|
MB = $270.39
|
Most Recent Note - 7/7/2023 8:53:13 PM
G - Still hovering near its all-time high, very extended from the prior base. Its 50 DMA line ($295.48) defines initial support to watch on pullbacks. Fundamentals remain strong.
>>> FEATURED STOCK ARTICLE : Hubbell on Track for 11th Weekly Gain - 6/22/2023 |
View all notes |
Set NEW NOTE alert |
Company Profile |
SEC
News |
Chart |
Request a new note
C
A
S
I |
NVR
-
NYSE
NVR
Bldg-Resident/Comml
|
$6,318.00
|
+113.24
1.83% |
$6,349.00
|
4,595
19.15% of 50 DAV
50 DAV is 24,000
|
$6,386.62
-1.07%
|
4/25/2023
|
$5,882.18
|
PP = $5,978.25
|
|
MB = $6,277.16
|
Most Recent Note - 7/11/2023 8:37:54 PM
Y - Color code is changed to yellow after pulling back below its "max buy" level. Its 50 DMA line ($5,911) defines near-term support watch.
>>> FEATURED STOCK ARTICLE : New High Close for Strong Homebuilder - 6/30/2023 |
View all notes |
Set NEW NOTE alert |
Company Profile |
SEC
News |
Chart |
Request a new note
C
A
S
I |
PHM
-
NYSE
PulteGroup
Bldg-Resident/Comml
|
$79.34
|
+1.14
1.46% |
$80.07
|
575,520
20.34% of 50 DAV
50 DAV is 2,829,000
|
$79.15
0.24%
|
4/25/2023
|
$65.17
|
PP = $64.01
|
|
MB = $67.21
|
Most Recent Note - 7/10/2023 5:29:29 PM
G - Posted a solid gain today with lighter volume. Extended from any sound base. Reported earnings +28% for the Mar '23 quarter versus the year-ago period. Important support to watch is defined by its 50 DMA line ($70.51).
>>> FEATURED STOCK ARTICLE : Negative Reversal After Hitting Another New High - 6/26/2023 |
View all notes |
Set NEW NOTE alert |
Company Profile |
SEC
News |
Chart |
Request a new note
C
A
S
I |
AMPH
-
NASDAQ
Amphastar Pharm
Medical-Biomed/Biotech
|
$54.92
|
-0.15
-0.27% |
$55.61
|
127,522
28.03% of 50 DAV
50 DAV is 455,000
|
$58.80
-6.60%
|
5/15/2023
|
$43.56
|
PP = $44.15
|
|
MB = $46.36
|
Most Recent Note - 7/11/2023 8:30:26 PM
G - Pulled back today with higher (near average) volume, retreating from its all-time high. Extended from any sound base. Its 50 DMA line ($47.21) and prior highs in the $44 area define important support to watch on pullbacks. Fundamentals remain strong.
>>> FEATURED STOCK ARTICLE : Hit Another New High With 4th Consecutive Volume-Driven Gain - 6/20/2023 |
View all notes |
Set NEW NOTE alert |
Company Profile |
SEC
News |
Chart |
Request a new note
C
A
S
I |
ANET
-
NYSE
Arista Networks
Computer-Networking
|
$162.85
|
+2.68
1.67% |
$164.44
|
1,185,390
33.01% of 50 DAV
50 DAV is 3,591,000
|
$178.36
-8.70%
|
5/30/2023
|
$176.35
|
PP = $171.54
|
|
MB = $180.12
|
Most Recent Note - 7/7/2023 8:45:45 PM
G - Volume totals have been cooling while consolidating above its 50 DMA line ($153). Faces near-term resistance due to overhead supply up to the $178 level. Fundamentals remain strong.
>>> FEATURED STOCK ARTICLE : Rebounding Near Recent High With 3 Consecutive Gains - 6/12/2023 |
View all notes |
Set NEW NOTE alert |
Company Profile |
SEC
News |
Chart |
Request a new note
C
A
S
I |
Symbol/Exchange
Company Name
Industry Group |
PRICE |
CHANGE
(%Change) |
Day High |
Volume
(% DAV)
(% 50 day avg vol) |
52 Wk Hi
% From Hi |
Featured
Date |
Price
Featured |
Pivot Featured |
|
Max Buy |
PANW
-
NASDAQ
Palo Alto Networks
Computer Sftwr-Security
|
$235.85
|
-14.38
-5.75% |
$251.88
|
6,564,408
105.25% of 50 DAV
50 DAV is 6,237,000
|
$258.88
-8.90%
|
6/5/2023
|
$228.35
|
PP = $213.73
|
|
MB = $224.42
|
 Most Recent Note - 7/12/2023 12:34:19 PM
G - Pulling back abruptly today with above-average volume, retreating from near its all-time high. Its 50 DMA line ($219.64) and prior high ($213) define near-term support to watch. Fundamentals remain strong.
>>> FEATURED STOCK ARTICLE : Strength Continues for Network Security Leader - 6/27/2023 |
View all notes |
Set NEW NOTE alert |
Company Profile |
SEC
News |
Chart |
Request a new note
C
A
S
I |
LSCC
-
NASDAQ
Lattice Semiconductor
Elec-Semicondctor Fablss
|
$94.73
|
+1.12
1.20% |
$95.86
|
375,680
15.37% of 50 DAV
50 DAV is 2,444,000
|
$97.27
-2.61%
|
6/13/2023
|
$91.73
|
PP = $96.92
|
|
MB = $101.77
|
Most Recent Note - 7/10/2023 5:27:07 PM
Y - Posted a solid gain today backed by below-average volume. Its 50 DMA line ($85) defines near-term support to watch. Subsequent gains above the pivot point backed by at least +40% above average volume may trigger a technical buy signal. Fundamentals remain strong.
>>> FEATURED STOCK ARTICLE : Lattice Posts Volume-Driven Gains Approaching Prior High - 6/13/2023 |
View all notes |
Set NEW NOTE alert |
Company Profile |
SEC
News |
Chart |
Request a new note
C
A
S
I |
XPEL
-
NASDAQ
XPEL
Auto/Truck-Replace Parts
|
$85.65
|
+0.51
0.60% |
$86.15
|
25,867
19.16% of 50 DAV
50 DAV is 135,000
|
$87.46
-2.07%
|
6/28/2023
|
$83.14
|
PP = $87.11
|
|
MB = $91.47
|
Most Recent Note - 7/10/2023 5:31:10 PM
Y - Posted a solid gain today with +95% above average volume and closed near the sessionm high, rising near the pivot point cited based on its 8/15/23 high plus 10 cents. Perched within striking distance of its 52-week high after an orderly 10-month base. Reported Mar '23 quarterly earnings +46% on +19% sales revenues versus the year ago period, its 3rd quarterly comparison above the +25% minimum earnings guideline (C criteria), helping it better match the winning models of the fact-based investment system.
>>> FEATURED STOCK ARTICLE : XPEL Returns to Featured Stocks List After Long Consolidation - 6/28/2023 |
View all notes |
Set NEW NOTE alert |
Company Profile |
SEC
News |
Chart |
Request a new note
C
A
S
I |
FTNT
-
NASDAQ
Fortinet
Computer Sftwr-Security
|
$76.73
|
-1.59
-2.03% |
$79.03
|
1,898,255
34.65% of 50 DAV
50 DAV is 5,478,000
|
$78.66
-2.45%
|
7/10/2023
|
$78.29
|
PP = $74.45
|
|
MB = $78.17
|
Most Recent Note - 7/10/2023 5:26:10 PM
Y - Finished strong after highlighted in yellow in the earlier mid-day report with new pivot point cited based on its 12/29/21 high plus 10 cents. Hit a new all-time high with today's gain and close above the pivot point backed by +51% above average volume triggering a proper technical buy signal. Reported Mar '23 quarterly earnings +79% on +32% sales revenues versus the year-ago period, its 4th strong earnings comparison above the +25% minimum (C criteria). See the latest FSU analysis for more details and a new annotated graph.
>>> FEATURED STOCK ARTICLE : Fortinet Powered to New All-Time High - 7/10/2023 |
View all notes |
Set NEW NOTE alert |
Company Profile |
SEC
News |
Chart |
Request a new note
C
A
S
I |
PII
-
NYSE
Polaris
Leisure-Products
|
$129.45
|
+0.66
0.51% |
$131.09
|
344,715
63.95% of 50 DAV
50 DAV is 539,000
|
$129.09
0.28%
|
7/11/2023
|
$126.92
|
PP = $123.97
|
|
MB = $130.17
|
Most Recent Note - 7/12/2023 12:37:44 PM
Y - Hit another new high today. Finished strong after highlighted in yellow in the prior mid-day report with pivot point cited based on its 8/16/22 high plus 10 cents. Gain and strong close above the pivot point triggered a technical buy signal. Reported very strong Sep, Dec '22, and Mar '23 quarterly sales revenues and earnings increases above the +25% minimum (C criteria) versus the year ago periods. Annual earnings (A criteria) history had a slight downturn in FY '19 followed by strong growth. See the latest FSU analysis for more details and an annotated graph.
>>> FEATURED STOCK ARTICLE : Volume-Driven Breakout for Polaris - 7/11/2023 |
View all notes |
Set NEW NOTE alert |
Company Profile |
SEC
News |
Chart |
Request a new note
C
A
S
I |
Symbol/Exchange
Company Name
Industry Group |
PRICE |
CHANGE
(%Change) |
Day High |
Volume
(% DAV)
(% 50 day avg vol) |
52 Wk Hi
% From Hi |
Featured
Date |
Price
Featured |
Pivot Featured |
|
Max Buy |
|
|
|
THESE ARE NOT BUY RECOMMENDATIONS!
Comments contained in the body of this report are technical
opinions only. The material herein has been obtained
from sources believed to be reliable and accurate, however,
its accuracy and completeness cannot be guaranteed.
This site is not an investment advisor, hence it does
not endorse or recommend any securities or other investments.
Any recommendation contained in this report may not
be suitable for all investors and it is not to be deemed
an offer or solicitation on our part with respect to
the purchase or sale of any securities. All trademarks,
service marks and trade names appearing in this report
are the property of their respective owners, and are
likewise used for identification purposes only.
This report is a service available
only to active Paid Premium Members.
You may opt-out of receiving report notifications
at any time. Questions or comments may be submitted
by writing to Premium Membership Services 665 S.E. 10 Street, Suite 201 Deerfield Beach, FL 33441-5634 or by calling 1-800-965-8307
or 954-785-1121.
|
|
|