You are not logged in.
This means you
CAN ONLY VIEW reports that were published prior to Thursday, April 10, 2025.
You
MUST UPGRADE YOUR MEMBERSHIP if you want to see any current reports.
AFTER MARKET UPDATE - TUESDAY, JULY 18TH, 2023
Previous After Market Report Next After Market Report >>>
|
|
|
|
DOW |
+366.58 |
34,951.93 |
+1.06% |
|
Volume |
879,579,343 |
+12% |
|
Volume |
4,845,410,300 |
+5% |
|
NASDAQ |
+108.69 |
14,353.64 |
+0.76% |
|
Advancers |
2,038 |
71% |
|
Advancers |
2,693 |
61% |
|
S&P 500 |
+32.19 |
4,554.98 |
+0.71% |
|
Decliners |
815 |
29% |
|
Decliners |
1,746 |
39% |
|
Russell 2000 |
+24.80 |
1,976.07 |
+1.27% |
|
52 Wk Highs |
196 |
|
|
52 Wk Highs |
270 |
|
|
S&P 600 |
+17.39 |
1,263.59 |
+1.40% |
|
52 Wk Lows |
15 |
|
|
52 Wk Lows |
99 |
|
|
 |
Major Indices Rose With Higher Volume Totals and More Leadership
Kenneth J. Gruneisen - Passed the CAN SLIM® Master's Exam
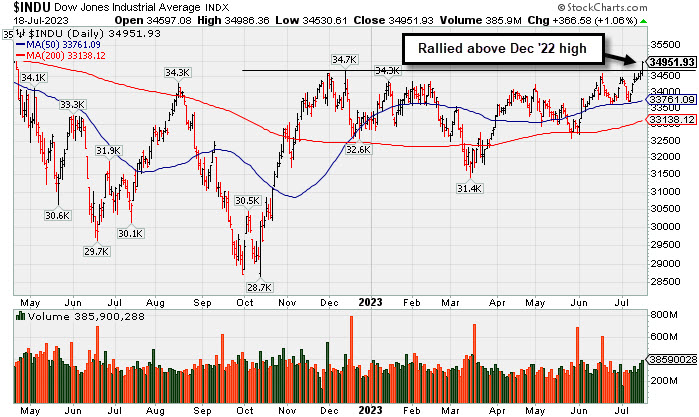
The major indices all closed near their highs of the day, led by the Russell 2000 (+1.3%). The volume totals reported were higher on the NYSE and on the Nasdaq exchange versus the prior session, indicative of increasing institutional buying demand. Breadth was positive as advancers led decliners by a 5-2 margin on the NYSE and by a 3-2 margin on the Nasdaq exchange. Leadership improved as there were 155 high-ranked companies from the Leaders List that hit a new 52-week high and were listed on the BreakOuts Page, versus the total of 119 on the prior session. New 52-week highs totals expanded and solidly outnumbered new 52-week lows totals on the NYSE and on the Nasdaq exchange. The major indices are in a confirmed uptrend (M criteria). Appropriate new buying efforts may be considered under the fact-based investment system.
PICTURED: The Dow Jones Industrial Average rallied above its December 2022 high. It is up +5.4% year-to-date.
Microsoft (MSFT +4.0%), down 1.0% at its low of the day, charged higher after announcing the introduction of Bing Chat Enterprise, Microsoft 365 Copilot pricing, and an expanded AI partnership with Meta Platforms (META +0.5%). NVIDIA (NVDA +2.2%) climbed in response to the news due to the AI connection.
Gains for the broader market were driven by the idea that the U.S. economy will avoid a hard landing. The retails sales report for June helped. Total sales and sales, excluding autos, were up a weaker-than-expected 0.2%, but there were upward revisions to both numbers for May. Control group sales, which factor into the computation for personal spending in the GDP report, were up a solid 0.6%. Reflective of the upbeat economic view, the Dow Jones Transportation Average jumped 2.0% to a new 52-week high.
Financials were top performers as Charles Schwab (SCHW +12.6%), Morgan Stanley (MS +6.5%), and Bank of America (BAC +4.4%) each rallied following their earnings reports. The S&P 500 financials sector (+1.1%) was among the top performers along with information technology (+1.3%) and energy (+1.0%). Only three of the 11 sectors closed with losses, real estate (-0.8%), utilities (-0.8%), and consumer staples (-0.1%).
Treasuries settled mixed. The 2-yr note yield rose four basis points to 4.76% and the 10-yr note yield fell one basis point to 3.79%.
|
 Kenneth J. Gruneisen started out as a licensed stockbroker in August 1987, a couple of months prior to the historic stock market crash that took the Dow Jones Industrial Average down -22.6% in a single day. He has published daily fact-based fundamental and technical analysis on high-ranked stocks online for two decades. Through FACTBASEDINVESTING.COM, Kenneth provides educational articles, news, market commentary, and other information regarding proven investment systems that work in good times and bad.
Comments contained in the body of this report are technical opinions only and are not necessarily those of Gruneisen Growth Corp. The material herein has been obtained from sources believed to be reliable and accurate, however, its accuracy and completeness cannot be guaranteed. Our firm, employees, and customers may effect transactions, including transactions contrary to any recommendation herein, or have positions in the securities mentioned herein or options with respect thereto. Any recommendation contained in this report may not be suitable for all investors and it is not to be deemed an offer or solicitation on our part with respect to the purchase or sale of any securities. |
|
 |
Financial and Commodity-Linked Groups Led Gainers
Kenneth J. Gruneisen - Passed the CAN SLIM® Master's Exam
The Bank Index ($BKX +3.03%) and Broker/Dealer Index ($XBD +2.76%) both posted standout gains, meanwhile the Retail Index ($RLX -0.18%) lost some ground. The tech sector had a slightly positive bias as the Semiconductor Index ($SOX +0.13%), Networking Index ($NWX +0.51%), and the Biotech Index ($BTK +0.32%) each posted a small gain. The Gold & Silver Index ($XAU +1.88%), Integrated Oil Index ($XOI +1.70%), and the Oil Services Index ($OSX +2.14%) posted unanimous gains.
PICTURED: The Integrated Oil Index ($XOI +1.70%) posted a solid gain. It recently met resistance at its 200-day moving average (DMA) line.
| Oil Services |
$OSX |
89.15 |
+1.87 |
+2.14% |
+6.31% |
| Integrated Oil |
$XOI |
1,710.61 |
+28.59 |
+1.70% |
-4.29% |
| Semiconductor |
$SOX |
3,842.35 |
+5.04 |
+0.13% |
+51.75% |
| Networking |
$NWX |
837.05 |
+4.28 |
+0.51% |
+6.86% |
| Broker/Dealer |
$XBD |
505.40 |
+13.59 |
+2.76% |
+12.53% |
| Retail |
$RLX |
3,532.65 |
-6.49 |
-0.18% |
+28.27% |
| Gold & Silver |
$XAU |
129.65 |
+2.39 |
+1.88% |
+7.27% |
| Bank |
$BKX |
85.68 |
+2.52 |
+3.03% |
-15.04% |
| Biotech |
$BTK |
5,371.96 |
+17.02 |
+0.32% |
+1.72% |
|
|
|
 |
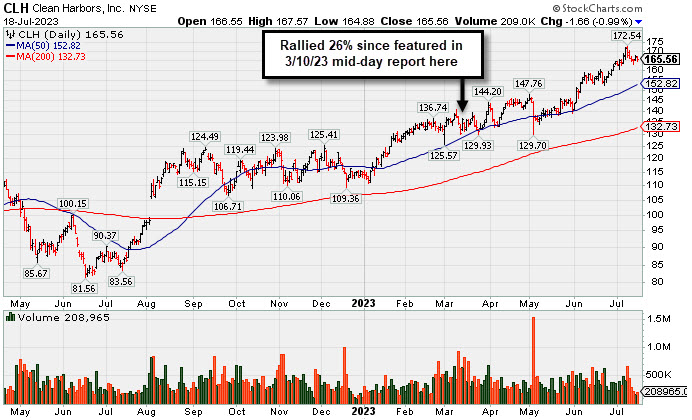
Negative Reversal at High After +26% Rally in 4 Months
Kenneth J. Gruneisen - Passed the CAN SLIM® Master's Exam
Clean Harbors Inc (CLH -$1.66 or -0.99% to $165.56) has seen volume totals cooling while consolidating after a noted "negative reversal" on 7/11/23 after touching a new all-time high. It is extended from any sound base. Its 50-day moving average (DMA) line ($152.82) defines important near-term support to watch on pullbacks. Fundamentals remain strong. It is due to report Jun '23 quarterly results on 8/02/23.
CLH has an Earnings Per Share Rating of 99. It reported Mar '23 quarterly earnings +64% on +12% sales revenues versus the year-ago period. Prior quarters showed a strong earnings track record with earnings above the +25% minimum guideline (C criteria). Annual earnings (A criteria) growth has been strong and steady.
There are only 54.1 million shares outstanding (S criteria), which can contribute to greater price volatility in the event of institutional buying or selling. The number of top-rated funds owning its shares rose from 590 in Sep '21 to 773 in Jun '23, a reassuring sign concerning the I criteria. The current Up/Down Volume Ratio of 1.5 is an unbiased indication its shares have been under accumulation over the past 50 days. It has a Timeliness Rating of A , a Sponsorship Rating of C, and an Accumulation Distribution Rating of C+.
|
|
|
Color Codes Explained :
Y - Better candidates highlighted by our
staff of experts.
G - Previously featured
in past reports as yellow but may no longer be buyable under the
guidelines.
***Last / Change / Volume data in this table is the closing quote data***
Symbol/Exchange
Company Name
Industry Group |
PRICE |
CHANGE
(%Change) |
Day High |
Volume
(% DAV)
(% 50 day avg vol) |
52 Wk Hi
% From Hi |
Featured
Date |
Price
Featured |
Pivot Featured |
|
Max Buy |
 STRL
-
NASDAQ
STRL
-
NASDAQ
Sterling Infrastructure
Bldg-Heavy Construction
|
$59.94
|
+0.70
1.18% |
$60.58
|
286,438
89.79% of 50 DAV
50 DAV is 319,000
|
$59.48
0.77%
|
12/14/2022
|
$32.41
|
PP = $33.72
|
|
MB = $35.41
|
 Most Recent Note - 7/18/2023 6:02:57 PM
G - Posted a 4th consecutive gain today hitting a new all-time high, very extended from any sound base. Mar '23 quarterly earnings were below the +25% minimum guideline (C criteria) raising fundamental concerns.
>>> FEATURED STOCK ARTICLE : Streak of Gains Lifts Sterling Infrastructure to New Highs - 7/3/2023 |
View all notes |
Set NEW NOTE alert |
Company Profile |
SEC
News |
Chart |
Request a new note
C
A
S
I |
FIX
-
NYSE
Comfort Systems USA
Bldg-A/C and Heating Prds
|
$170.06
|
+4.11
2.48% |
$172.02
|
270,218
108.96% of 50 DAV
50 DAV is 248,000
|
$167.53
1.51%
|
4/27/2023
|
$148.85
|
PP = $152.23
|
|
MB = $159.84
|
Most Recent Note - 7/18/2023 6:04:30 PM
G - Posted a solid gain today with above-average volume hitting another new all-time high. No resistance remains due to overhead supply. Its 50 DMA line ($157) defines important near-term support to watch on pullbacks.
>>> FEATURED STOCK ARTICLE : "Negative Reversal" Following Recent Volume-Driven Gains - 6/16/2023 |
View all notes |
Set NEW NOTE alert |
Company Profile |
SEC
News |
Chart |
Request a new note
C
A
S
I |
KOF
-
NYSE
Coca-Cola Femsa ADR
Beverages-Non-Alcoholic
|
$83.46
|
-0.23
-0.27% |
$84.53
|
138,705
79.72% of 50 DAV
50 DAV is 174,000
|
$91.23
-8.52%
|
6/9/2023
|
$88.61
|
PP = $91.33
|
|
MB = $95.90
|
Most Recent Note - 7/13/2023 5:26:07 PM
G - Posted a 3rd consecutive gain today approaching its 50 DMA line following a positive reversal. A rebound above the 50 DMA line ($86.18) is needed for its outlook to improve. Fundamentals remain strong.
>>> FEATURED STOCK ARTICLE : Slumping Below 50-Day Moving Average and Below Prior Low - 7/6/2023 |
View all notes |
Set NEW NOTE alert |
Company Profile |
SEC
News |
Chart |
Request a new note
C
A
S
I |
CLH
-
NYSE
Clean Harbors
Pollution Control
|
$165.56
|
-1.66
-0.99% |
$167.57
|
208,965
50.60% of 50 DAV
50 DAV is 413,000
|
$172.54
-4.05%
|
3/10/2023
|
$136.89
|
PP = $136.74
|
|
MB = $143.58
|
Most Recent Note - 7/18/2023 5:55:58 PM
G - Volume totals have been cooling after a noted "negative reversal" at its all-time high. It is extended from any sound base. Its 50 DMA line ($152.82) defines important near-term support to watch on pullbacks. Fundamentals remain strong. See the latest FSU analysis for more details and a new annotated graph.
>>> FEATURED STOCK ARTICLE : Negative Reversal at High After +26% Rally in 4 Months - 7/18/2023 |
View all notes |
Set NEW NOTE alert |
Company Profile |
SEC
News |
Chart |
Request a new note
C
A
S
I |
SPSC
-
NASDAQ
SPS Commerce
Comp Sftwr-Spec Enterprs
|
$194.81
|
+1.08
0.56% |
$195.46
|
153,098
79.74% of 50 DAV
50 DAV is 192,000
|
$192.67
1.11%
|
4/24/2023
|
$150.01
|
PP = $157.56
|
|
MB = $165.44
|
Most Recent Note - 7/18/2023 6:01:40 PM
G - Posted a 6th consecutive gain today, getting very extended from the previously noted base. Due to report Jun '23 quarterly results on 7/27/23.
>>> FEATURED STOCK ARTICLE : Perched Near High Following Noted Volume-Driven Gains - 6/21/2023 |
View all notes |
Set NEW NOTE alert |
Company Profile |
SEC
News |
Chart |
Request a new note
C
A
S
I |
Symbol/Exchange
Company Name
Industry Group |
PRICE |
CHANGE
(%Change) |
Day High |
Volume
(% DAV)
(% 50 day avg vol) |
52 Wk Hi
% From Hi |
Featured
Date |
Price
Featured |
Pivot Featured |
|
Max Buy |
HUBB
-
NYSE
Hubbell
Electrical-Power/Equipmt
|
$337.31
|
+5.35
1.61% |
$337.59
|
299,454
77.78% of 50 DAV
50 DAV is 385,000
|
$337.23
0.02%
|
4/25/2023
|
$262.85
|
PP = $257.51
|
|
MB = $270.39
|
Most Recent Note - 7/14/2023 12:20:32 PM
G - Still hovering near its all-time high, very extended from the prior base. Its 50 DMA line ($301.72) defines initial support to watch on pullbacks. Fundamentals remain strong.
>>> FEATURED STOCK ARTICLE : Hubbell on Track for 11th Weekly Gain - 6/22/2023 |
View all notes |
Set NEW NOTE alert |
Company Profile |
SEC
News |
Chart |
Request a new note
C
A
S
I |
NVR
-
NYSE
NVR
Bldg-Resident/Comml
|
$6,466.00
|
+57.02
0.89% |
$6,470.87
|
13,568
56.53% of 50 DAV
50 DAV is 24,000
|
$6,392.26
1.15%
|
4/25/2023
|
$5,882.18
|
PP = $5,978.25
|
|
MB = $6,277.16
|
Most Recent Note - 7/18/2023 6:00:10 PM
G - Color code is changed to green after posting gains backed by light volume, wedging above its "max buy" level to a new all-time high. Its 50 DMA line ($5,964) defines near-term support watch on pullbacks.
>>> FEATURED STOCK ARTICLE : New High Close for Strong Homebuilder - 6/30/2023 |
View all notes |
Set NEW NOTE alert |
Company Profile |
SEC
News |
Chart |
Request a new note
C
A
S
I |
PHM
-
NYSE
PulteGroup
Bldg-Resident/Comml
|
$82.02
|
+0.32
0.39% |
$82.52
|
2,193,912
78.38% of 50 DAV
50 DAV is 2,799,000
|
$81.06
1.18%
|
4/25/2023
|
$65.17
|
PP = $64.01
|
|
MB = $67.21
|
Most Recent Note - 7/14/2023 12:55:01 PM
G - On track for a 6th consecutive gain today with lighter volume. Very extended from any sound base. Reported earnings +28% for the Mar '23 quarter versus the year-ago period. Important support to watch is defined by its 50 DMA line ($72).
>>> FEATURED STOCK ARTICLE : Negative Reversal After Hitting Another New High - 6/26/2023 |
View all notes |
Set NEW NOTE alert |
Company Profile |
SEC
News |
Chart |
Request a new note
C
A
S
I |
AMPH
-
NASDAQ
Amphastar Pharm
Medical-Biomed/Biotech
|
$61.07
|
+4.38
7.73% |
$63.17
|
838,183
185.44% of 50 DAV
50 DAV is 452,000
|
$58.80
3.86%
|
5/15/2023
|
$43.56
|
PP = $44.15
|
|
MB = $46.36
|
Most Recent Note - 7/18/2023 1:06:15 PM
G - Powering to a new all-time high with today's gap up and big 4th consecutive gain backed by above average volume. It did not form a sound base of sufficient length. Its 50 DMA line ($49.23) defines important support to watch above prior highs in the $44 area. Fundamentals remain strong.
>>> FEATURED STOCK ARTICLE : Hit Another New High With 4th Consecutive Volume-Driven Gain - 6/20/2023 |
View all notes |
Set NEW NOTE alert |
Company Profile |
SEC
News |
Chart |
Request a new note
C
A
S
I |
ANET
-
NYSE
Arista Networks
Computer-Networking
|
$173.51
|
+3.09
1.81% |
$174.84
|
2,980,233
83.55% of 50 DAV
50 DAV is 3,567,000
|
$178.36
-2.72%
|
5/30/2023
|
$176.35
|
PP = $171.54
|
|
MB = $180.12
|
Most Recent Note - 7/17/2023 5:49:16 PM
G - Posted a gain today with below-average volume, approaching prior highs. It faces little near-term resistance due to overhead supply up to the $178 level. Fundamentals remain strong. Its 50 DMA line ($154) defines near-term support above the prior low ($148.32).
>>> FEATURED STOCK ARTICLE : Wedging Higher After Rebounding Above 50-Day Moving Average - 7/12/2023 |
View all notes |
Set NEW NOTE alert |
Company Profile |
SEC
News |
Chart |
Request a new note
C
A
S
I |
Symbol/Exchange
Company Name
Industry Group |
PRICE |
CHANGE
(%Change) |
Day High |
Volume
(% DAV)
(% 50 day avg vol) |
52 Wk Hi
% From Hi |
Featured
Date |
Price
Featured |
Pivot Featured |
|
Max Buy |
PANW
-
NASDAQ
Palo Alto Networks
Computer Sftwr-Security
|
$248.34
|
-1.71
-0.68% |
$250.22
|
3,212,316
48.51% of 50 DAV
50 DAV is 6,622,000
|
$258.88
-4.07%
|
6/5/2023
|
$228.35
|
PP = $213.73
|
|
MB = $224.42
|
Most Recent Note - 7/17/2023 5:52:38 PM
G - Posted a 3rd gain today with lighter volume and it remains perched near its all-time high. Its 50 DMA line ($223.48) and prior high ($213) define near-term support to watch. Fundamentals remain strong.
>>> FEATURED STOCK ARTICLE : Strength Continues for Network Security Leader - 6/27/2023 |
View all notes |
Set NEW NOTE alert |
Company Profile |
SEC
News |
Chart |
Request a new note
C
A
S
I |
LSCC
-
NASDAQ
Lattice Semiconductor
Elec-Semicondctor Fablss
|
$96.79
|
+0.34
0.35% |
$98.18
|
1,559,453
65.22% of 50 DAV
50 DAV is 2,391,000
|
$97.27
-0.49%
|
6/13/2023
|
$91.73
|
PP = $96.92
|
|
MB = $101.77
|
Most Recent Note - 7/17/2023 5:44:22 PM
Y - Posted a gain for a best-ever close and it is perched within close striking distance of its 52-week high and pivot point. Its 50 DMA line ($86.38) defines near-term support to watch. Subsequent gains above the pivot point backed by at least +40% above average volume may trigger a technical buy signal. Fundamentals remain strong. See the latest FSU analysis for more details and a new annotated graph.
>>> FEATURED STOCK ARTICLE : Perched Near Pivot Point After Best-Ever Close - 7/17/2023 |
View all notes |
Set NEW NOTE alert |
Company Profile |
SEC
News |
Chart |
Request a new note
C
A
S
I |
XPEL
-
NASDAQ
XPEL
Auto/Truck-Replace Parts
|
$82.69
|
-0.32
-0.39% |
$83.87
|
89,280
66.63% of 50 DAV
50 DAV is 134,000
|
$87.46
-5.45%
|
6/28/2023
|
$83.14
|
PP = $87.11
|
|
MB = $91.47
|
Most Recent Note - 7/13/2023 5:28:26 PM
Y - Pulled back today with below-average volume. Perched near the pivot point cited based on its 8/15/23 high plus 10 cents. Within close striking distance of its 52-week high after an orderly 10-month base. Reported Mar '23 quarterly earnings +46% on +19% sales revenues versus the year ago period, its 3rd quarterly comparison above the +25% minimum earnings guideline (C criteria), helping it better match the winning models of the fact-based investment system.
>>> FEATURED STOCK ARTICLE : XPEL Returns to Featured Stocks List After Long Consolidation - 6/28/2023 |
View all notes |
Set NEW NOTE alert |
Company Profile |
SEC
News |
Chart |
Request a new note
C
A
S
I |
FTNT
-
NASDAQ
Fortinet
Computer Sftwr-Security
|
$80.24
|
-0.04
-0.05% |
$80.45
|
4,578,551
83.16% of 50 DAV
50 DAV is 5,506,000
|
$79.03
1.53%
|
7/10/2023
|
$78.29
|
PP = $74.45
|
|
MB = $78.17
|
Most Recent Note - 7/18/2023 6:06:41 PM
G - Color code is changed to green after rising above its "max buy" level. It is perched at its all-time high, stubbornly holding its ground after recent gains. Fundamentals remain strong.
>>> FEATURED STOCK ARTICLE : Fortinet Powered to New All-Time High - 7/10/2023 |
View all notes |
Set NEW NOTE alert |
Company Profile |
SEC
News |
Chart |
Request a new note
C
A
S
I |
PII
-
NYSE
Polaris
Leisure-Products
|
$132.10
|
+2.67
2.06% |
$132.72
|
844,462
158.73% of 50 DAV
50 DAV is 532,000
|
$131.09
0.77%
|
7/11/2023
|
$126.92
|
PP = $123.97
|
|
MB = $130.17
|
Most Recent Note - 7/18/2023 6:09:18 PM
G - Color code is changed to green after rallying above its "max buy" level with today's volume-driven gain adding to a recent spurt higher. On pullbacks, the prior highs define initial support to watch above its 50 DMA line.
>>> FEATURED STOCK ARTICLE : Volume-Driven Breakout for Polaris - 7/11/2023 |
View all notes |
Set NEW NOTE alert |
Company Profile |
SEC
News |
Chart |
Request a new note
C
A
S
I |
Symbol/Exchange
Company Name
Industry Group |
PRICE |
CHANGE
(%Change) |
Day High |
Volume
(% DAV)
(% 50 day avg vol) |
52 Wk Hi
% From Hi |
Featured
Date |
Price
Featured |
Pivot Featured |
|
Max Buy |
ALGM
-
NASDAQ
Allegro MicroSystems
Elec-Semicondctor Fablss
|
$52.72
|
+0.74
1.42% |
$52.85
|
1,542,579
105.95% of 50 DAV
50 DAV is 1,456,000
|
$52.60
0.23%
|
7/13/2023
|
$49.86
|
PP = $48.82
|
|
MB = $51.26
|
Most Recent Note - 7/17/2023 5:46:31 PM
Y - Posted a gain with average volume for a best-ever close. It was highlighted in yellow with pivot point cited based on its 4/03/23 high plus 10 cents in the 7/13/23 mid-day report.
>>> FEATURED STOCK ARTICLE : Volume Heavy Behind Considerable Breakout Gain - 7/13/2023 |
View all notes |
Set NEW NOTE alert |
Company Profile |
SEC
News |
Chart |
Request a new note
C
A
S
I |
ESQ
-
NASDAQ
Esquire Finl Hldgs
Finance-Commercial Loans
|
$48.59
|
+1.15
2.42% |
$48.63
|
35,930
123.90% of 50 DAV
50 DAV is 29,000
|
$48.13
0.96%
|
7/14/2023
|
$45.80
|
PP = $48.23
|
|
MB = $50.64
|
Most Recent Note - 7/17/2023 5:50:43 PM
Y - Posted a volume-driven gain today challenging its 52-week high. Subsequent gains above the pivot point backed by at least +40% above average volume are needed to trigger a proper technical buy signal.
>>> FEATURED STOCK ARTICLE : Esquire Perched Near Prior Highs - 7/14/2023 |
View all notes |
Set NEW NOTE alert |
Company Profile |
SEC
News |
Chart |
Request a new note
C
A
S
I |
|
|
|
THESE ARE NOT BUY RECOMMENDATIONS!
Comments contained in the body of this report are technical
opinions only. The material herein has been obtained
from sources believed to be reliable and accurate, however,
its accuracy and completeness cannot be guaranteed.
This site is not an investment advisor, hence it does
not endorse or recommend any securities or other investments.
Any recommendation contained in this report may not
be suitable for all investors and it is not to be deemed
an offer or solicitation on our part with respect to
the purchase or sale of any securities. All trademarks,
service marks and trade names appearing in this report
are the property of their respective owners, and are
likewise used for identification purposes only.
This report is a service available
only to active Paid Premium Members.
You may opt-out of receiving report notifications
at any time. Questions or comments may be submitted
by writing to Premium Membership Services 665 S.E. 10 Street, Suite 201 Deerfield Beach, FL 33441-5634 or by calling 1-800-965-8307
or 954-785-1121.
|
|
|