You are not logged in.
This means you
CAN ONLY VIEW reports that were published prior to Friday, April 11, 2025.
You
MUST UPGRADE YOUR MEMBERSHIP if you want to see any current reports.
AFTER MARKET UPDATE - TUESDAY, JUNE 13TH, 2023
Previous After Market Report Next After Market Report >>>
|
|
|
|
DOW |
+145.79 |
34,212.12 |
+0.43% |
|
Volume |
927,835,435 |
+6% |
|
Volume |
5,550,311,600 |
+17% |
|
NASDAQ |
+111.40 |
13,573.32 |
+0.83% |
|
Advancers |
1,977 |
69% |
|
Advancers |
2,899 |
65% |
|
S&P 500 |
+30.08 |
4,369.01 |
+0.69% |
|
Decliners |
886 |
31% |
|
Decliners |
1,579 |
35% |
|
Russell 2000 |
+23.12 |
1,896.33 |
+1.23% |
|
52 Wk Highs |
137 |
|
|
52 Wk Highs |
228 |
|
|
S&P 600 |
+11.33 |
1,215.44 |
+0.94% |
|
52 Wk Lows |
7 |
|
|
52 Wk Lows |
71 |
|
|
 |
Leadership Expanded as Major Averages Rallied
Kenneth J. Gruneisen - Passed the CAN SLIM® Master's Exam
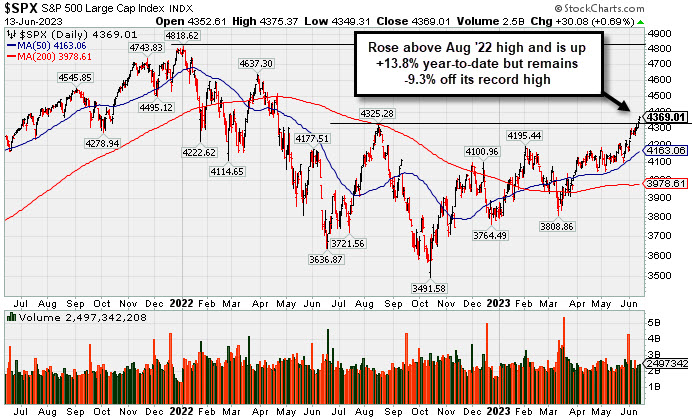
The Dow rose 145 points (0.4%), while the Nasdaq Composite climbed 0.8% and the S&P 500 advanced 0.7%. Volume totals reported were higher on the NYSE and on the Nasdaq exchange versus the prior session. Breadth was positive with advancers leading decliners by more than a 2-1 margin on the NYSE and by nearly 2-1 on the Nasdaq exchange. There were 100 high-ranked companies from the Leaders List that hit a new 52-week high and were listed on the BreakOuts Page, versus the total of 67 on the prior session. New 52-week highs totals expanded and solidly outnumbered new 52-week lows totals on the NYSE and on the Nasdaq exchange. The major indices are in a confirmed uptrend (M criteria). Appropriate new buying efforts may be considered under the fact-based investment system.
PICTURED: The S&P 500 Index hit a new 2023 high and it is up +13.8% year-to-date. It is still -9.3% off its record high hit in Jan '22.
Ten of 11 sectors finished in positive territory as U.S. equities ended higher on Tuesday The Consumer Price Index (CPI) release showed a continued slowdown in inflation.
On the data front today, headline and core (which excludes the more volatile food and energy prices) CPI showed inflation decelerated, coming in at 4.0% and 5.3% year-over-year, respectively. Meanwhile, real average hourly earnings rose 0.2% year-over-year. Additionally, the National Federation of Independent Business (NFIB) Small Business Optimism Index ticked up slightly to 89.4 but remains near the lowest level in a decade on dimmer views about the outlook for sales, the economy, and credit conditions.
Treasuries weakened on expectations that the Federal Reserve (Fed) will announce a pause, and not a pivot, in interest rate hikes after their policy meeting concludes tomorrow. While today’s inflation report shows inflation is trending in the right direction, it remains higher than the Fed’s 2% target. While the futures market is betting on a pause this week, it is still anticipating one more rate hike this year and is not expecting any rate cuts until 2024. The yield on the 10-year note rose 10 basis points (0.10%) to 3.83%, and the 30-year bond yield was up six basis points (0.06%) to 3.93%. Meanwhile, the yield on the two-year note advanced 10 basis points (0.10%) to 4.67%.
In commodities, West Texas Intermediate (WTI) crude climbed 3.0% to $69.15/barrel. Despite the recovery in oil prices, demand concerns persist amid recent soft economic activity.
|
 Kenneth J. Gruneisen started out as a licensed stockbroker in August 1987, a couple of months prior to the historic stock market crash that took the Dow Jones Industrial Average down -22.6% in a single day. He has published daily fact-based fundamental and technical analysis on high-ranked stocks online for two decades. Through FACTBASEDINVESTING.COM, Kenneth provides educational articles, news, market commentary, and other information regarding proven investment systems that work in good times and bad.
Comments contained in the body of this report are technical opinions only and are not necessarily those of Gruneisen Growth Corp. The material herein has been obtained from sources believed to be reliable and accurate, however, its accuracy and completeness cannot be guaranteed. Our firm, employees, and customers may effect transactions, including transactions contrary to any recommendation herein, or have positions in the securities mentioned herein or options with respect thereto. Any recommendation contained in this report may not be suitable for all investors and it is not to be deemed an offer or solicitation on our part with respect to the purchase or sale of any securities. |
|
 |
Financial, Tech, Energy, and Retail Indexes Rose
Kenneth J. Gruneisen - Passed the CAN SLIM® Master's Exam
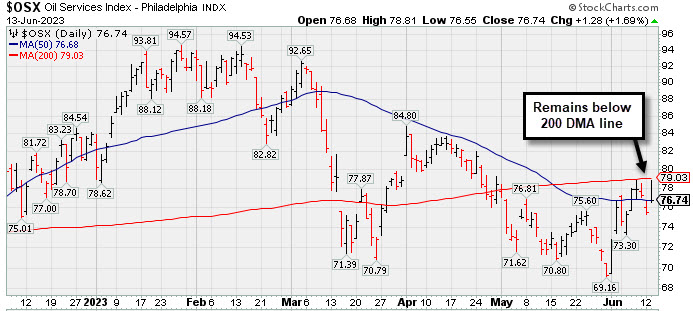
The Bank ($BKX +1.53%) and the Broker/Dealer ($XBD +1.09%) both posted solid gains while the Retail ($RLX +0.30%) posted a smaller gain. The tech sector had a positive bias as the Semiconductor ($SOX +1.15%), Networking ($NWX +0.91%) and the Biotech ($BTK +0.86%) posted unanimous gains. The Oil Services ($OSX +1.69%) and the Integrated Oil ($XOI +0.49%) both posted gains. The Gold & Silver $XAU (-0.25%) finished slightly lower.
PICTURED: The Oil Services ($OSX +1.69%) posted a gain but remains below its 200-day moving average (DMA) line.
| Oil Services |
$OSX |
76.74 |
+1.28 |
+1.69% |
-8.49% |
| Integrated Oil |
$XOI |
1,666.64 |
+8.07 |
+0.49% |
-6.75% |
| Semiconductor |
$SOX |
3,683.66 |
+42.00 |
+1.15% |
+45.48% |
| Networking |
$NWX |
826.45 |
+7.45 |
+0.91% |
+5.51% |
| Broker/Dealer |
$XBD |
466.62 |
+5.03 |
+1.09% |
+3.89% |
| Retail |
$RLX |
3,366.93 |
+10.06 |
+0.30% |
+22.26% |
| Gold & Silver |
$XAU |
123.60 |
-0.31 |
-0.25% |
+2.26% |
| Bank |
$BKX |
82.52 |
+1.24 |
+1.53% |
-18.18% |
| Biotech |
$BTK |
5,466.64 |
+46.70 |
+0.86% |
+3.51% |
|
|
|
 |
Lattice Posts Volume-Driven Gains Approaching Prior High
Kenneth J. Gruneisen - Passed the CAN SLIM® Master's Exam
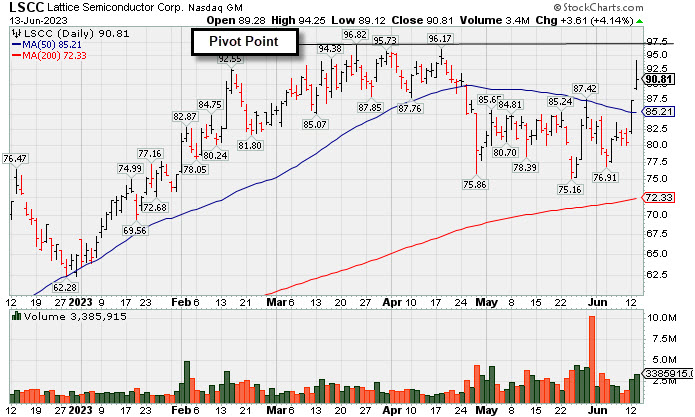
Lattice Semiconductor (LSCC +$3.61 or +4.14% to $90.81) was highlighted in yellow with pivot point cited based on its 3/23/23 high plus 10 cents in the earlier mid-day report (read here). It gapped up today approaching prior highs after rebounding above its 50-day moving aveage (DMA) line ($85.23) on the prior session with a volume-driven gain. Subsequent gains above the pivot point backed by at least +40% above average volume may trigger a technical buy signal.
The high-ranked Elec-Semicondctor Fablss firm reported Mar '23 quarterly earnings +38% on +22% sales revenues versus the year-ago period, its 9th consecutive strong quarterly comparison above the +25% minimum earnings guideline (C criteria). Its annual earnings history (A criteria) has been strong. It has a 99 Earnings Per Share Rating, the highest possible rank.
The company has 137.6 million shares outstanding (S criteria). The number of top-rated funds owning its share rose from 765 in Jun '22 to 964 in Mar '23, a reassuring sign concerning the I criteria. It has a Timeliness Rating of A but an Accumulation/Distribution Rating of D. Its current Up/Down Volume Ratio of 1.0 is neutral concerning acccumulation/distribution over the past 50 days.
Symbol/Exchange
Company Name
Industry Group | PRICE | CHANGE
(%Change) | Day High | Volume
(% DAV)
(% 50 day avg vol) | 52 Wk Hi
% From Hi | Featured
Date | Price
Featured | Pivot Featured | | Max Buy |  GPK - NYSE GPK - NYSE
Graphic Packaging
Paper and Paper Products | $26.22 | -0.74
-2.74% | $27.56 | 8,617,668
302.27% of 50 DAV
50 DAV is 2,851,000 | $27.02
-2.96%
| 10/25/2022 | $22.75 | PP = $24.17 | | MB = $25.38 |  Most Recent Note - 6/13/2023 5:11:39 PM Most Recent Note - 6/13/2023 5:11:39 PM
G - There was a "negative reversal" today for a loss with heavy volume after hitting new all-time highs with 8 consecutive gains. It did not form a sound new base of sufficient length but quickly recovered after testing its 4/27/23 low last week. Reported Mar '23 quarterly earnings +60% on +9% sales revenues versus the year-ago period.
>>> FEATURED STOCK ARTICLE : Graphic Packaging Hits New High With 6th Consecutive Gain - 6/8/2023 | View all notes | Set NEW NOTE alert | Company Profile | SEC News | Chart | Request a new note C A S I | STRL - NASDAQ
Sterling Infrastructure
Bldg-Heavy Construction | $53.15 | +0.40
0.76% | $54.44 | 273,332
104.33% of 50 DAV
50 DAV is 262,000 | $53.97
-1.52%
| 12/14/2022 | $32.41 | PP = $33.72 | | MB = $35.41 | Most Recent Note - 6/13/2023 5:17:30 PM
G - Hit yet another new all-time high today but ended near the session low. It is very extended from any sound base. Mar ''23 quarterly earnings were below the +25% minimum guideline (C criteria) raising fundamental concerns.
>>> FEATURED STOCK ARTICLE : Impressive Streak of Gains for New Highs - 6/7/2023 | View all notes | Set NEW NOTE alert | Company Profile | SEC News | Chart | Request a new note C A S I | FIX - NYSE
Comfort Systems USA
Bldg-A/C and Heating Prds | $158.34 | -1.95
-1.22% | $162.16 | 264,074
96.03% of 50 DAV
50 DAV is 275,000 | $162.75
-2.71%
| 4/27/2023 | $148.85 | PP = $152.23 | | MB = $159.84 | Most Recent Note - 6/12/2023 6:08:15 PM
G - Color code is changed to green after hitting a new all-time high and closing above its "max buy" level with today''s big gain backed by +19% above average volume. No resistance remains due to overhead supply.
>>> FEATURED STOCK ARTICLE : Churning Action While Recently Hovering Near All-Time High - 5/12/2023 | View all notes | Set NEW NOTE alert | Company Profile | SEC News | Chart | Request a new note C A S I | KOF - NYSE
Coca-Cola Femsa ADR
Beverages-Non-Alcoholic | $88.26 | -0.12
-0.14% | $89.27 | 157,915
82.25% of 50 DAV
50 DAV is 192,000 | $91.23
-3.26%
| 6/9/2023 | $88.61 | PP = $91.33 | | MB = $95.90 | Most Recent Note - 6/9/2023 5:52:26 PM
Y - Posted a 7th consecutive gain today after finding support near its 50 DMA line ($85.16). Color code is changed to yellow with new pivot point based on its 5/09/23 high plus 10 cents. Recent lows in the $81.50 area define the next important support to watch below its 50 DMA line. Reported Mar ''23 quarterly earnings +53% on +24% sales revenues versus the year-ago period. See the latest FSU analysis for more details and a new annotated graph.
>>> FEATURED STOCK ARTICLE : Coca-Cola Femsa Posts 7th Consecutive Gain - 6/9/2023 | View all notes | Set NEW NOTE alert | Company Profile | SEC News | Chart | Request a new note C A S I | CLH - NYSE
Clean Harbors
Pollution Control | $155.36 | -2.26
-1.43% | $158.32 | 340,987
89.73% of 50 DAV
50 DAV is 380,000 | $158.72
-2.12%
| 3/10/2023 | $136.89 | PP = $136.74 | | MB = $143.58 | Most Recent Note - 6/9/2023 12:25:35 PM
G - Perched at its all-time high following 3 consecutive gains. Its 50 DMA line ($142.71) defines near-term support to watch on pullbacks. Reported Mar '23 quarterly earnings +64% on +12% sales revenues versus the year-ago period. Fundamentals remain strong.
>>> FEATURED STOCK ARTICLE : Showed Resilience Near 50-Day Moving Average Following Sell-Off - 5/10/2023 | View all notes | Set NEW NOTE alert | Company Profile | SEC News | Chart | Request a new note C A S I | Symbol/Exchange
Company Name
Industry Group | PRICE | CHANGE
(%Change) | Day High | Volume
(% DAV)
(% 50 day avg vol) | 52 Wk Hi
% From Hi | Featured
Date | Price
Featured | Pivot Featured | | Max Buy | SPSC - NASDAQ
SPS Commerce
Comp Sftwr-Spec Enterprs | $177.93 | +0.79
0.45% | $178.44 | 167,222
112.23% of 50 DAV
50 DAV is 149,000 | $177.34
0.33%
| 4/24/2023 | $150.01 | PP = $157.56 | | MB = $165.44 | Most Recent Note - 6/12/2023 6:13:44 PM
G - Hit yet another new 52-week high with today''s 3rd consecutive gain backed by +54% above average volume. Reported Mar ''23 quarterly earnings +22% on +20% versus the year-ago period, below the +25% minimum earnings guideline (C criteria) raising some fundamental concerns.
>>> FEATURED STOCK ARTICLE : Pulled Back After Quietly Wedging to New Highs - 5/31/2023 | View all notes | Set NEW NOTE alert | Company Profile | SEC News | Chart | Request a new note C A S I | HUBB - NYSE
Hubbell
Electrical-Power/Equipmt | $315.54 | +4.84
1.56% | $316.36 | 254,472
62.83% of 50 DAV
50 DAV is 405,000 | $311.69
1.24%
| 4/25/2023 | $262.85 | PP = $257.51 | | MB = $270.39 | Most Recent Note - 6/13/2023 5:15:56 PM
G - Hit yet another new all-time high with today''s 6th consecutive gain, getting more extended from the prior base. Prior highs in the $263 area define initial support to watch on pullbacks. Fundamentals remain strong.
>>> FEATURED STOCK ARTICLE : Extended From Prior Base and Perched Near High - 6/1/2023 | View all notes | Set NEW NOTE alert | Company Profile | SEC News | Chart | Request a new note C A S I | NVR - NYSE
NVR
Bldg-Resident/Comml | $5,929.63 | +60.77
1.04% | $5,960.35 | 20,725
86.35% of 50 DAV
50 DAV is 24,000 | $5,986.96
-0.96%
| 4/25/2023 | $5,882.18 | PP = $5,978.25 | | MB = $6,277.16 | Most Recent Note - 6/13/2023 5:14:42 PM
G - Posted a 4th consecutive gain today with below-average volume. Its 50 DMA line ($5,747) defines near-term support above the recent low ($5,520 on 6/01/23). Reported Mar ''23 quarterly earnings -14% on -3% sales revenues versus the year-ago period, below the +25% minimum earnings guideline (C criteria) raising fundamental concerns, and its color code was changed to green. Prior quarterly comparisons were well above the +25% minimum earnings guideline (C criteria). Annual earnings (A criteria) growth has been very strong.
>>> FEATURED STOCK ARTICLE : Rebounded Above 50 Day Average With Light Volume Gains - 6/6/2023 | View all notes | Set NEW NOTE alert | Company Profile | SEC News | Chart | Request a new note C A S I | PHM - NYSE
PulteGroup
Bldg-Resident/Comml | $73.89 | +0.99
1.36% | $74.20 | 3,231,331
110.06% of 50 DAV
50 DAV is 2,936,000 | $73.44
0.61%
| 4/25/2023 | $65.17 | PP = $64.01 | | MB = $67.21 | Most Recent Note - 6/12/2023 6:12:42 PM
G - Hit yet another new high with today''s 2nd consecutive gain backed by below average volume, getting more extended from any sound base. Reported earnings +28% for the Mar ''23 quarter versus the year-ago period. Important support to watch is defined by its 50 DMA line ($65) and recent low.
>>> FEATURED STOCK ARTICLE : Rebounded Above "Max Buy" Level Toward Recent High - 6/2/2023 | View all notes | Set NEW NOTE alert | Company Profile | SEC News | Chart | Request a new note C A S I | COKE - NASDAQ
Coca-Cola Consolidated
Beverages-Non-Alcoholic | $653.65 | -0.79
-0.12% | $659.95 | 37,280
103.56% of 50 DAV
50 DAV is 36,000 | $694.20
-5.84%
| 5/4/2023 | $646.66 | PP = $656.21 | | MB = $689.02 | Most Recent Note - 6/8/2023 12:48:26 PM
Y - Pulled back below its "max buy" level with recent volume-driven losses. Recent lows in the $625 area define important near-term support above its 50 DMA line. Fundamentals remain strong.
>>> FEATURED STOCK ARTICLE : COKE is Showing Real Strength - 5/4/2023 | View all notes | Set NEW NOTE alert | Company Profile | SEC News | Chart | Request a new note C A S I | Symbol/Exchange
Company Name
Industry Group | PRICE | CHANGE
(%Change) | Day High | Volume
(% DAV)
(% 50 day avg vol) | 52 Wk Hi
% From Hi | Featured
Date | Price
Featured | Pivot Featured | | Max Buy | AMPH - NASDAQ
Amphastar Pharm
Medical-Biomed/Biotech | $47.10 | -0.13
-0.28% | $48.39 | 401,128
97.60% of 50 DAV
50 DAV is 411,000 | $47.46
-0.76%
| 5/15/2023 | $43.56 | PP = $44.15 | | MB = $46.36 | Most Recent Note - 6/12/2023 6:10:42 PM
G - Hit a new all-time high and closed above its "max buy" level today and its color code is changed to green. Prior highs in the $44 area define initial support to watch on pullbacks. Fundamentals remain strong.
>>> FEATURED STOCK ARTICLE : Weak Finish After Early Gain When Perched Near All-Time High - 5/15/2023 | View all notes | Set NEW NOTE alert | Company Profile | SEC News | Chart | Request a new note C A S I | ANET - NYSE
Arista Networks
Computer-Networking | $168.60 | -1.40
-0.82% | $172.64 | 3,211,638
99.12% of 50 DAV
50 DAV is 3,240,000 | $178.36
-5.47%
| 5/30/2023 | $176.35 | PP = $171.54 | | MB = $180.12 | Most Recent Note - 6/12/2023 6:05:36 PM
Y - Posted a 3rd consecutive gain today with average volume. Stalled after recent gains triggered a technical buy signal. Its 50 DMA line ($154) defines important near-term support to watch. Fundamentals remain strong. See the latest FSU analysis for more details and a new annotated graph.
>>> FEATURED STOCK ARTICLE : Rebounding Near Recent High With 3 Consecutive Gains - 6/12/2023 | View all notes | Set NEW NOTE alert | Company Profile | SEC News | Chart | Request a new note C A S I | PANW - NASDAQ
Palo Alto Networks
Computer Sftwr-Security | $233.63 | +4.49
1.96% | $234.50 | 5,938,156
134.07% of 50 DAV
50 DAV is 4,429,000 | $230.18
1.50%
| 6/5/2023 | $228.35 | PP = $213.73 | | MB = $224.42 | Most Recent Note - 6/12/2023 6:14:34 PM
Y - Posted a solid gain today backed by +24% above average volume for a best-ever close. The prior high ($213) defines initial support to watch. Fundamentals remain strong.
>>> FEATURED STOCK ARTICLE : Palo Alto Powers to New Highs Again - 6/5/2023 | View all notes | Set NEW NOTE alert | Company Profile | SEC News | Chart | Request a new note C A S I | LSCC - NASDAQ
Lattice Semiconductor
Elec-Semicondctor Fablss | $90.81 | +3.61
4.14% | $94.25 | 3,385,915
143.05% of 50 DAV
50 DAV is 2,367,000 | $96.82
-6.21%
| 6/13/2023 | $91.73 | PP = $96.92 | | MB = $101.77 | Most Recent Note - 6/13/2023 12:39:52 PM
Y - Color code is changed to yellow with pivot point cited based on its 3/23/23 high plus 10 cents. Gapped up today approaching prior highs after rebounding above its 50 DMA line ($85.23) on the prior session with a volume-driven gain. Subsequent gains above the pivot point backed by at least +40% above average volume may trigger a technical buy signal. Reported Mar '23 quarterly earnings +38% on +22% sales revenues versus the year-ago period, its 9th consecutive strong quarterly comparison above the +25% minimum earnings guideline (C criteria). Annual earnings history (A criteria) has been strong.
>>> FEATURED STOCK ARTICLE : Lattice Posts Volume-Driven Gains Approaching Prior High - 6/13/2023 | View all notes | Set NEW NOTE alert | Company Profile | SEC News | Chart | Request a new note C A S I |
|
|
|
Color Codes Explained :
Y - Better candidates highlighted by our
staff of experts.
G - Previously featured
in past reports as yellow but may no longer be buyable under the
guidelines.
***Last / Change / Volume data in this table is the closing quote data***
|
|
|
THESE ARE NOT BUY RECOMMENDATIONS!
Comments contained in the body of this report are technical
opinions only. The material herein has been obtained
from sources believed to be reliable and accurate, however,
its accuracy and completeness cannot be guaranteed.
This site is not an investment advisor, hence it does
not endorse or recommend any securities or other investments.
Any recommendation contained in this report may not
be suitable for all investors and it is not to be deemed
an offer or solicitation on our part with respect to
the purchase or sale of any securities. All trademarks,
service marks and trade names appearing in this report
are the property of their respective owners, and are
likewise used for identification purposes only.
This report is a service available
only to active Paid Premium Members.
You may opt-out of receiving report notifications
at any time. Questions or comments may be submitted
by writing to Premium Membership Services 665 S.E. 10 Street, Suite 201 Deerfield Beach, FL 33441-5634 or by calling 1-800-965-8307
or 954-785-1121.
|
|
|