You are not logged in.
This means you
CAN ONLY VIEW reports that were published prior to Thursday, March 20, 2025.
You
MUST UPGRADE YOUR MEMBERSHIP if you want to see any current reports.
AFTER MARKET UPDATE - MONDAY, JULY 10TH, 2023
Previous After Market Report Next After Market Report >>>
|
|
|
|
DOW |
+209.52 |
33,944.40 |
+0.62% |
|
Volume |
819,368,328 |
-13% |
|
Volume |
5,292,926,500 |
+1% |
|
NASDAQ |
+24.77 |
13,685.48 |
+0.18% |
|
Advancers |
1,979 |
69% |
|
Advancers |
2,910 |
66% |
|
S&P 500 |
+10.58 |
4,409.53 |
+0.24% |
|
Decliners |
891 |
31% |
|
Decliners |
1,493 |
34% |
|
Russell 2000 |
+30.59 |
1,895.25 |
+1.64% |
|
52 Wk Highs |
80 |
|
|
52 Wk Highs |
73 |
|
|
S&P 600 |
+15.59 |
1,215.42 |
+1.30% |
|
52 Wk Lows |
23 |
|
|
52 Wk Lows |
58 |
|
|
 |
Leadership Improved as Major Indices Rose
Kenneth J. Gruneisen - Passed the CAN SLIM® Master's Exam
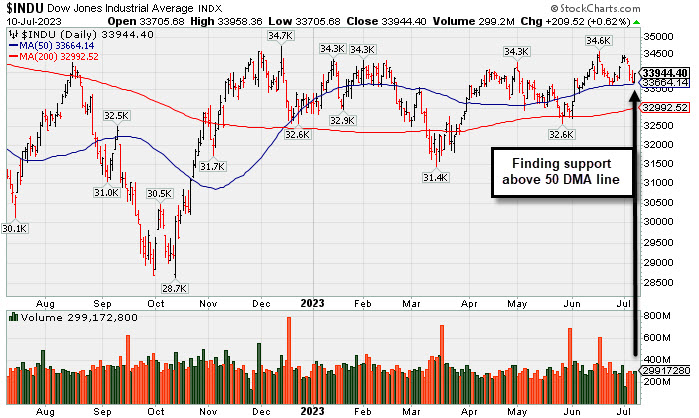
The major indices rose on Monday. The volume totals reported were mixed, lighter on the NYSE and higher on the Nasdaq exchange versus the prior session. Breadth was positive as advancers led decliners by more than a 2-1 margin on the NYSE and by nearly 2-1 on the Nasdaq exchange. Leadership improved as there were 39 high-ranked companies from the Leaders List that hit a new 52-week high and were listed on the BreakOuts Page, nearly doubling the total of 20 on the prior session. New 52-week highs outnumbered new 52-week lows totals on the NYSE and on the Nasdaq exchange. The major indices are in a confirmed uptrend (M criteria). Appropriate new buying efforts may be considered under the fact-based investment system.
PICTURED: The Dow Jones Industrial Average posted a gain, finding support above its 50-day moving average (DMA) line.
Gains for the three major indices were restrained by the relative weakness in mega cap stocks. Apple (AAPL -1.09%), Alphabet (GOOGL -2.54%), and Microsoft (MSFT -1.60%) slumped following news from Nasdaq that there will be a Special Rebalance of the Nasdaq 100. To reduce overconcentration in the index, new weightings will be determined on Friday, July 14 and will be made effective prior to the open on July 24.
Small caps, banks, energy and semiconductor stocks all outperformed. The PHLX Semiconductor Index rose 2.1%, the Russell 2000 rose 1.6%, and the SPDR S&P Regional Banking ETF (KRE) rose 0.8%. The economically-sensitive S&P 500 industrials (+1.4%) and energy (+0.8%) sectors were among the top performers along with health care (+0.8%) and financials (+0.4%). Communication services (-0.9%) and utilities (-0.4%) sectors fell.
A pullback in Treasury yields was supportive of equities. The 2-yr note yield fell nine basis points to 4.85% and the 10-yr note yield fell four basis points to 4.01%. The improvement in Treasury yields happened ahead of Wednesday's release of the June Consumer Price Index. |
 Kenneth J. Gruneisen started out as a licensed stockbroker in August 1987, a couple of months prior to the historic stock market crash that took the Dow Jones Industrial Average down -22.6% in a single day. He has published daily fact-based fundamental and technical analysis on high-ranked stocks online for two decades. Through FACTBASEDINVESTING.COM, Kenneth provides educational articles, news, market commentary, and other information regarding proven investment systems that work in good times and bad.
Comments contained in the body of this report are technical opinions only and are not necessarily those of Gruneisen Growth Corp. The material herein has been obtained from sources believed to be reliable and accurate, however, its accuracy and completeness cannot be guaranteed. Our firm, employees, and customers may effect transactions, including transactions contrary to any recommendation herein, or have positions in the securities mentioned herein or options with respect thereto. Any recommendation contained in this report may not be suitable for all investors and it is not to be deemed an offer or solicitation on our part with respect to the purchase or sale of any securities. |
|
 |
Tech, Financial, and Commodity-Linked Groups Rose
Kenneth J. Gruneisen - Passed the CAN SLIM® Master's Exam
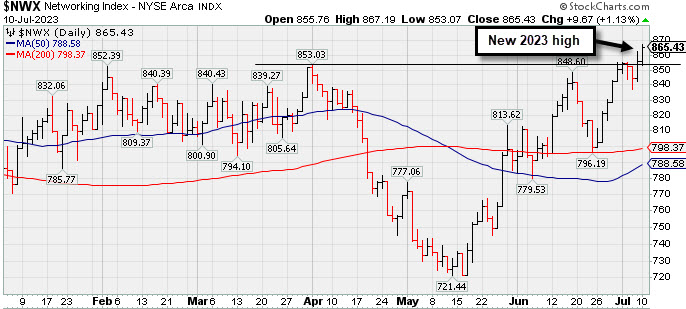
The Bank Index ($BKX +0.22%) and Broker/Dealer Index ($XBD +0.30%) both edged higher while the Retail Index ($RLX -0.24%) edged lower on Monday. The tech sector had a positive bias as the Semiconductor Index ($SOX +2.06%), Networking Index ($NWX+1.13%), and the Biotech Index ($BTK +1.42%) each posted solid gains. The Integrated Oil Index ($XOI +0.46%), Oil Services Index ($OSX +0.85%), and the Gold & Silver Index ($XAU +2.16%) rounded out the mostly positive session with gains.
PICTURED: The Networking Index ($NWX+1.13%) posted a solid gain and hit a new 2023 high.
| Oil Services |
$OSX |
84.50 |
+0.71 |
+0.85% |
+0.77% |
| Integrated Oil |
$XOI |
1,679.10 |
+7.61 |
+0.46% |
-6.05% |
| Semiconductor |
$SOX |
3,651.60 |
+73.87 |
+2.06% |
+44.21% |
| Networking |
$NWX |
865.43 |
+9.67 |
+1.13% |
+10.48% |
| Broker/Dealer |
$XBD |
473.85 |
+1.42 |
+0.30% |
+5.50% |
| Retail |
$RLX |
3,426.19 |
-8.30 |
-0.24% |
+24.41% |
| Gold & Silver |
$XAU |
119.64 |
+2.53 |
+2.16% |
-1.01% |
| Bank |
$BKX |
80.89 |
+0.18 |
+0.22% |
-19.79% |
| Biotech |
$BTK |
5,193.37 |
+72.85 |
+1.42% |
-1.66% |
|
|
|
 |
Fortinet Powered to New All-Time High
Kenneth J. Gruneisen - Passed the CAN SLIM® Master's Exam
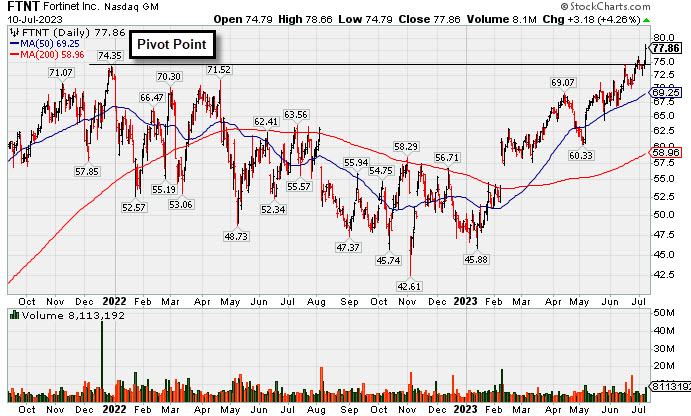
Fortinet Inc (FTNT +$3.18 or +4.26% to $77.86) was highlighted in yellow with new pivot point cited based on its 12/29/21 high plus 10 cents in theearlier mid-day report (read here). It hit a new all-time high with today's gain. The strong close above the pivot point was backed by +51% above average volume triggering a proper technical buy signal.
The high-ranked Computer Software - Security firm reported Mar '23 quarterly earnings +79% on +32% sales revenues versus the year-ago period, its 4th strong earnings comparison above the +25% minimum (C criteria). Annual earnings (A criteria) have remained strong since FTNT was last shown in this FSU section on 8/03/20 with an annotated graph under the headline, "Rebounded Above 50-Day Average; Earnings News Due".
There are 659.6 million shares in the public float (S criteria). The number of top-rated funds owning its shares rose from 960 in Jun '18 to 2,469 in Jun '23, a reassuring sign concerning the I criteria. Its current Up/Down Volume Ratio of 1.2 is an unbiased indication its shares have been under accumulation over the past 50 days. It has a Timeliness rating of A and Sponsorship rating of C.
Charts courtesy of www.stockcharts.com
 |
|
|
Color Codes Explained :
Y - Better candidates highlighted by our
staff of experts.
G - Previously featured
in past reports as yellow but may no longer be buyable under the
guidelines.
***Last / Change / Volume data in this table is the closing quote data***
Symbol/Exchange
Company Name
Industry Group |
PRICE |
CHANGE
(%Change) |
Day High |
Volume
(% DAV)
(% 50 day avg vol) |
52 Wk Hi
% From Hi |
Featured
Date |
Price
Featured |
Pivot Featured |
|
Max Buy |
 STRL
-
NASDAQ
STRL
-
NASDAQ
Sterling Infrastructure
Bldg-Heavy Construction
|
$58.34
|
+0.87
1.51% |
$58.52
|
321,924
102.52% of 50 DAV
50 DAV is 314,000
|
$59.43
-1.83%
|
12/14/2022
|
$32.41
|
PP = $33.72
|
|
MB = $35.41
|
Most Recent Note - 7/6/2023 4:57:34 PM
G - Pulled back today following 6 consecutive gains for new all-time highs, very extended from any sound base. Mar '23 quarterly earnings were below the +25% minimum guideline (C criteria) raising fundamental concerns.
>>> FEATURED STOCK ARTICLE : Streak of Gains Lifts Sterling Infrastructure to New Highs - 7/3/2023 |
View all notes |
Set NEW NOTE alert |
Company Profile |
SEC
News |
Chart |
Request a new note
C
A
S
I |
FIX
-
NYSE
Comfort Systems USA
Bldg-A/C and Heating Prds
|
$163.26
|
+3.42
2.14% |
$163.62
|
115,532
42.48% of 50 DAV
50 DAV is 272,000
|
$167.53
-2.55%
|
4/27/2023
|
$148.85
|
PP = $152.23
|
|
MB = $159.84
|
Most Recent Note - 7/7/2023 8:52:05 PM
G - Volume totals have been cooling while still hovering near its all-time high and near its "max buy" level. No resistance remains due to overhead supply. Its 50 DMA line ($154.51) defines important near-term support to watch.
>>> FEATURED STOCK ARTICLE : "Negative Reversal" Following Recent Volume-Driven Gains - 6/16/2023 |
View all notes |
Set NEW NOTE alert |
Company Profile |
SEC
News |
Chart |
Request a new note
C
A
S
I |
KOF
-
NYSE
Coca-Cola Femsa ADR
Beverages-Non-Alcoholic
|
$80.87
|
-0.76
-0.93% |
$82.09
|
149,371
85.85% of 50 DAV
50 DAV is 174,000
|
$91.23
-11.36%
|
6/9/2023
|
$88.61
|
PP = $91.33
|
|
MB = $95.90
|
Most Recent Note - 7/6/2023 4:59:49 PM
G - Today's loss undercut the prior low ($81.63 on 5/31/23) raising greater concerns. A prompt rebound above the 50 DMA line ($86.31) is needed for its outlook to improve. Fundamentals remain strong.
>>> FEATURED STOCK ARTICLE : Slumping Below 50-Day Moving Average and Below Prior Low - 7/6/2023 |
View all notes |
Set NEW NOTE alert |
Company Profile |
SEC
News |
Chart |
Request a new note
C
A
S
I |
CLH
-
NYSE
Clean Harbors
Pollution Control
|
$171.87
|
+4.19
2.50% |
$172.08
|
410,416
102.09% of 50 DAV
50 DAV is 402,000
|
$169.77
1.24%
|
3/10/2023
|
$136.89
|
PP = $136.74
|
|
MB = $143.58
|
Most Recent Note - 7/7/2023 8:47:30 PM
G - Hit yet another new all-time high with today's gain backed by +22% above average volume, getting more extended from any sound base. Its 50 DMA line ($149.39) and prior high define important near-term support to watch on pullbacks. Fundamentals remain strong.
>>> FEATURED STOCK ARTICLE : Extended From Any Sound Base and Hovering Near High - 6/15/2023 |
View all notes |
Set NEW NOTE alert |
Company Profile |
SEC
News |
Chart |
Request a new note
C
A
S
I |
SPSC
-
NASDAQ
SPS Commerce
Comp Sftwr-Spec Enterprs
|
$181.23
|
-1.04
-0.57% |
$183.82
|
240,925
130.23% of 50 DAV
50 DAV is 185,000
|
$192.67
-5.94%
|
4/24/2023
|
$150.01
|
PP = $157.56
|
|
MB = $165.44
|
Most Recent Note - 7/7/2023 8:59:36 PM
G - Pulled back from its 52-week high with above average volume behind today's 2nd consecutive loss. Very extended from the previously noted base. Reported Mar '23 quarterly earnings +22% on +20% versus the year-ago period, below the +25% minimum earnings guideline (C criteria) raising some fundamental concerns.
>>> FEATURED STOCK ARTICLE : Perched Near High Following Noted Volume-Driven Gains - 6/21/2023 |
View all notes |
Set NEW NOTE alert |
Company Profile |
SEC
News |
Chart |
Request a new note
C
A
S
I |
Symbol/Exchange
Company Name
Industry Group |
PRICE |
CHANGE
(%Change) |
Day High |
Volume
(% DAV)
(% 50 day avg vol) |
52 Wk Hi
% From Hi |
Featured
Date |
Price
Featured |
Pivot Featured |
|
Max Buy |
HUBB
-
NYSE
Hubbell
Electrical-Power/Equipmt
|
$335.43
|
+7.63
2.33% |
$335.55
|
218,190
53.87% of 50 DAV
50 DAV is 405,000
|
$332.76
0.80%
|
4/25/2023
|
$262.85
|
PP = $257.51
|
|
MB = $270.39
|
Most Recent Note - 7/7/2023 8:53:13 PM
G - Still hovering near its all-time high, very extended from the prior base. Its 50 DMA line ($295.48) defines initial support to watch on pullbacks. Fundamentals remain strong.
>>> FEATURED STOCK ARTICLE : Hubbell on Track for 11th Weekly Gain - 6/22/2023 |
View all notes |
Set NEW NOTE alert |
Company Profile |
SEC
News |
Chart |
Request a new note
C
A
S
I |
NVR
-
NYSE
NVR
Bldg-Resident/Comml
|
$6,213.80
|
+151.02
2.49% |
$6,216.85
|
23,153
96.47% of 50 DAV
50 DAV is 24,000
|
$6,386.62
-2.71%
|
4/25/2023
|
$5,882.18
|
PP = $5,978.25
|
|
MB = $6,277.16
|
Most Recent Note - 7/6/2023 5:02:25 PM
G - Pulled back from its all-time high with today's 3rd consecutive loss. Its 50 DMA line ($5,886) defines near-term support watch on pullbacks.
>>> FEATURED STOCK ARTICLE : New High Close for Strong Homebuilder - 6/30/2023 |
View all notes |
Set NEW NOTE alert |
Company Profile |
SEC
News |
Chart |
Request a new note
C
A
S
I |
PHM
-
NYSE
PulteGroup
Bldg-Resident/Comml
|
$77.38
|
+2.35
3.13% |
$77.39
|
2,100,586
72.38% of 50 DAV
50 DAV is 2,902,000
|
$79.15
-2.24%
|
4/25/2023
|
$65.17
|
PP = $64.01
|
|
MB = $67.21
|
 Most Recent Note - 7/10/2023 5:29:29 PM
G - Posted a solid gain today with lighter volume. Extended from any sound base. Reported earnings +28% for the Mar '23 quarter versus the year-ago period. Important support to watch is defined by its 50 DMA line ($70.51).
>>> FEATURED STOCK ARTICLE : Negative Reversal After Hitting Another New High - 6/26/2023 |
View all notes |
Set NEW NOTE alert |
Company Profile |
SEC
News |
Chart |
Request a new note
C
A
S
I |
COKE
-
NASDAQ
Coca-Cola Consolidated
Beverages-Non-Alcoholic
|
$633.11
|
-0.18
-0.03% |
$642.90
|
35,932
89.83% of 50 DAV
50 DAV is 40,000
|
$694.20
-8.80%
|
5/4/2023
|
$646.66
|
PP = $656.21
|
|
MB = $689.02
|
Most Recent Note - 7/10/2023 5:28:31 PM
G - Color code is changed to green while slumping below its 50 DMA line ($646.72). More damaging losses would raise concerns and trigger technical sell signals. A rebound above the 50 DMA line is needed for its outlook to improve. Fundamentals remain strong.
>>> FEATURED STOCK ARTICLE : Fell Below Pivot Point With Recent Volume-Driven Losses - 6/14/2023 |
View all notes |
Set NEW NOTE alert |
Company Profile |
SEC
News |
Chart |
Request a new note
C
A
S
I |
AMPH
-
NASDAQ
Amphastar Pharm
Medical-Biomed/Biotech
|
$56.94
|
+1.02
1.82% |
$57.46
|
255,339
55.75% of 50 DAV
50 DAV is 458,000
|
$58.80
-3.16%
|
5/15/2023
|
$43.56
|
PP = $44.15
|
|
MB = $46.36
|
Most Recent Note - 7/7/2023 8:49:19 PM
G - Volume totals have been cooling while hovering near its all-time high, extended from any sound base. Its 50 DMA line ($46.46) and prior highs in the $44 area define important support to watch on pullbacks. Fundamentals remain strong.
>>> FEATURED STOCK ARTICLE : Hit Another New High With 4th Consecutive Volume-Driven Gain - 6/20/2023 |
View all notes |
Set NEW NOTE alert |
Company Profile |
SEC
News |
Chart |
Request a new note
C
A
S
I |
Symbol/Exchange
Company Name
Industry Group |
PRICE |
CHANGE
(%Change) |
Day High |
Volume
(% DAV)
(% 50 day avg vol) |
52 Wk Hi
% From Hi |
Featured
Date |
Price
Featured |
Pivot Featured |
|
Max Buy |
ANET
-
NYSE
Arista Networks
Computer-Networking
|
$159.55
|
+1.55
0.98% |
$159.63
|
1,457,755
40.05% of 50 DAV
50 DAV is 3,640,000
|
$178.36
-10.55%
|
5/30/2023
|
$176.35
|
PP = $171.54
|
|
MB = $180.12
|
Most Recent Note - 7/7/2023 8:45:45 PM
G - Volume totals have been cooling while consolidating above its 50 DMA line ($153). Faces near-term resistance due to overhead supply up to the $178 level. Fundamentals remain strong.
>>> FEATURED STOCK ARTICLE : Rebounding Near Recent High With 3 Consecutive Gains - 6/12/2023 |
View all notes |
Set NEW NOTE alert |
Company Profile |
SEC
News |
Chart |
Request a new note
C
A
S
I |
PANW
-
NASDAQ
Palo Alto Networks
Computer Sftwr-Security
|
$247.47
|
-0.12
-0.05% |
$251.25
|
4,312,802
69.56% of 50 DAV
50 DAV is 6,200,000
|
$258.88
-4.41%
|
6/5/2023
|
$228.35
|
PP = $213.73
|
|
MB = $224.42
|
Most Recent Note - 7/7/2023 8:57:55 PM
G - Pulled back from its all-time high with today's 2nd consecutive loss on light volume. Its 50 DMA line ($216) and prior high ($213) defines near-term support to watch. Fundamentals remain strong.
>>> FEATURED STOCK ARTICLE : Strength Continues for Network Security Leader - 6/27/2023 |
View all notes |
Set NEW NOTE alert |
Company Profile |
SEC
News |
Chart |
Request a new note
C
A
S
I |
LSCC
-
NASDAQ
Lattice Semiconductor
Elec-Semicondctor Fablss
|
$95.24
|
+3.59
3.92% |
$95.50
|
1,482,901
59.08% of 50 DAV
50 DAV is 2,510,000
|
$97.27
-2.09%
|
6/13/2023
|
$91.73
|
PP = $96.92
|
|
MB = $101.77
|
Most Recent Note - 7/10/2023 5:27:07 PM
Y - Posted a solid gain today backed by below-average volume. Its 50 DMA line ($85) defines near-term support to watch. Subsequent gains above the pivot point backed by at least +40% above average volume may trigger a technical buy signal. Fundamentals remain strong.
>>> FEATURED STOCK ARTICLE : Lattice Posts Volume-Driven Gains Approaching Prior High - 6/13/2023 |
View all notes |
Set NEW NOTE alert |
Company Profile |
SEC
News |
Chart |
Request a new note
C
A
S
I |
XPEL
-
NASDAQ
XPEL
Auto/Truck-Replace Parts
|
$86.64
|
+2.29
2.71% |
$86.70
|
256,565
195.85% of 50 DAV
50 DAV is 131,000
|
$87.01
-0.43%
|
6/28/2023
|
$83.14
|
PP = $87.11
|
|
MB = $91.47
|
Most Recent Note - 7/10/2023 5:31:10 PM
Y - Posted a solid gain today with +95% above average volume and closed near the sessionm high, rising near the pivot point cited based on its 8/15/23 high plus 10 cents. Perched within striking distance of its 52-week high after an orderly 10-month base. Reported Mar '23 quarterly earnings +46% on +19% sales revenues versus the year ago period, its 3rd quarterly comparison above the +25% minimum earnings guideline (C criteria), helping it better match the winning models of the fact-based investment system.
>>> FEATURED STOCK ARTICLE : XPEL Returns to Featured Stocks List After Long Consolidation - 6/28/2023 |
View all notes |
Set NEW NOTE alert |
Company Profile |
SEC
News |
Chart |
Request a new note
C
A
S
I |
FTNT
-
NASDAQ
Fortinet
Computer Sftwr-Security
|
$77.86
|
+3.18
4.26% |
$78.66
|
8,113,191
150.22% of 50 DAV
50 DAV is 5,401,000
|
$77.71
0.19%
|
7/10/2023
|
$78.29
|
PP = $74.45
|
|
MB = $78.17
|
Most Recent Note - 7/10/2023 5:26:10 PM
Y - Finished strong after highlighted in yellow in the earlier mid-day report with new pivot point cited based on its 12/29/21 high plus 10 cents. Hit a new all-time high with today's gain and close above the pivot point backed by +51% above average volume triggering a proper technical buy signal. Reported Mar '23 quarterly earnings +79% on +32% sales revenues versus the year-ago period, its 4th strong earnings comparison above the +25% minimum (C criteria). See the latest FSU analysis for more details and a new annotated graph.
>>> FEATURED STOCK ARTICLE : Fortinet Powered to New All-Time High - 7/10/2023 |
View all notes |
Set NEW NOTE alert |
Company Profile |
SEC
News |
Chart |
Request a new note
C
A
S
I |
Symbol/Exchange
Company Name
Industry Group |
PRICE |
CHANGE
(%Change) |
Day High |
Volume
(% DAV)
(% 50 day avg vol) |
52 Wk Hi
% From Hi |
Featured
Date |
Price
Featured |
Pivot Featured |
|
Max Buy |
|
|
|
THESE ARE NOT BUY RECOMMENDATIONS!
Comments contained in the body of this report are technical
opinions only. The material herein has been obtained
from sources believed to be reliable and accurate, however,
its accuracy and completeness cannot be guaranteed.
This site is not an investment advisor, hence it does
not endorse or recommend any securities or other investments.
Any recommendation contained in this report may not
be suitable for all investors and it is not to be deemed
an offer or solicitation on our part with respect to
the purchase or sale of any securities. All trademarks,
service marks and trade names appearing in this report
are the property of their respective owners, and are
likewise used for identification purposes only.
This report is a service available
only to active Paid Premium Members.
You may opt-out of receiving report notifications
at any time. Questions or comments may be submitted
by writing to Premium Membership Services 665 S.E. 10 Street, Suite 201 Deerfield Beach, FL 33441-5634 or by calling 1-800-965-8307
or 954-785-1121.
|
|
|