You are not logged in.
This means you
CAN ONLY VIEW reports that were published prior to Thursday, March 20, 2025.
You
MUST UPGRADE YOUR MEMBERSHIP if you want to see any current reports.
AFTER MARKET UPDATE - THURSDAY, JUNE 15TH, 2023
Previous After Market Report Next After Market Report >>>
|
|
|
|
DOW |
+428.73 |
34,408.06 |
+1.26% |
|
Volume |
1,031,188,432 |
+2% |
|
Volume |
5,728,683,200 |
-1% |
|
NASDAQ |
+156.34 |
13,782.82 |
+1.15% |
|
Advancers |
2,135 |
74% |
|
Advancers |
2,922 |
66% |
|
S&P 500 |
+53.25 |
4,425.84 |
+1.22% |
|
Decliners |
745 |
26% |
|
Decliners |
1,503 |
34% |
|
Russell 2000 |
+15.18 |
1,889.28 |
+0.81% |
|
52 Wk Highs |
96 |
|
|
52 Wk Highs |
188 |
|
|
S&P 600 |
+10.68 |
1,209.74 |
+0.89% |
|
52 Wk Lows |
20 |
|
|
52 Wk Lows |
85 |
|
|
 |
Breadth Positive as Major Averages Rallied
Kenneth J. Gruneisen - Passed the CAN SLIM® Master's Exam
The Dow added 428 points (1.3%) while the Nasdaq Composite and the S&P 500 each increased 1.2%. Volume totals reported were mixed, higher on the NYSE and lighter on the Nasdaq exchange versus the prior session. Breadth was positive with advancers leading decliners by a 3-1 margin on the NYSE and by 2-1 on the Nasdaq exchange. There were 87 high-ranked companies from the Leaders List that hit a new 52-week high and were listed on the BreakOuts Page, versus the total of 67 on the prior session. New 52-week highs totals solidly outnumbered new 52-week lows totals on the NYSE and on the Nasdaq exchange. The major indices are in a confirmed uptrend (M criteria). Appropriate new buying efforts may be considered under the fact-based investment system.
PICTURED: The Dow Jones Industrial Average hit a new 2023 high.
All 11 sectors rose as U.S. equities rallied on Thursday, driven by optimism on the benefits of artificial intelligence beyond the technology industry. The weekly initial jobless claims and continuing claims data both came in slightly higher than expected for the weeks ended June 10 and June 3, respectively. Some investors shifted to a view that the Federal Reserve (Fed) may end its tightening cycle sooner than originally anticipated to prevent a recession. This also added fuel to the stock market rally today. Monthly retail sales for May and Empire State Manufacturing Survey data for June came in stronger than expected.
Treasury yields declined today. The yield on the benchmark 10-year note dropped eight basis points (0.08%) to 3.72%, while the 30-year bond yield decreased four basis points (0.04%) to 3.84%. The yield on the two-year note, which is more sensitive to changes in Fed policy, declined by six basis points (0.06%) to 4.64%. In commodities, West Texas Intermediate (WTI) crude increased to $70.58/barrel as the U.S. dollar weakened and data showed that China’s monthly refinery throughput, a measure on the volume of crude oil put through the refinery, increased by over 15% in May from a year ago. An increase in the throughput data raised market expectations that China’s demand may continue climbing.
|
 Kenneth J. Gruneisen started out as a licensed stockbroker in August 1987, a couple of months prior to the historic stock market crash that took the Dow Jones Industrial Average down -22.6% in a single day. He has published daily fact-based fundamental and technical analysis on high-ranked stocks online for two decades. Through FACTBASEDINVESTING.COM, Kenneth provides educational articles, news, market commentary, and other information regarding proven investment systems that work in good times and bad.
Comments contained in the body of this report are technical opinions only and are not necessarily those of Gruneisen Growth Corp. The material herein has been obtained from sources believed to be reliable and accurate, however, its accuracy and completeness cannot be guaranteed. Our firm, employees, and customers may effect transactions, including transactions contrary to any recommendation herein, or have positions in the securities mentioned herein or options with respect thereto. Any recommendation contained in this report may not be suitable for all investors and it is not to be deemed an offer or solicitation on our part with respect to the purchase or sale of any securities. |
|
 |
Financial, Retail, Energy, Networking, and Biotech Indexes Rose
Kenneth J. Gruneisen - Passed the CAN SLIM® Master's Exam
The Bank ($BKX +1.50%) and the Broker/Dealer ($XBD +1.55%) both posted solid gains while the Retail ($RLX +0.96%) posted a smaller gain. The Semiconductor ($SOX -0.85%) edged lower while the Networking ($NWX +1.14%) and the Biotech ($BTK +1.27%) both posted solid gains. Energy-linked groups rose with the Oil Services ($OSX +1.53%) and the Integrated Oil ($XOI +1.13%) both notching gains.
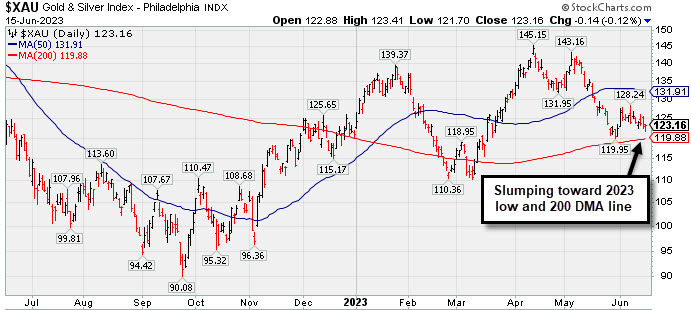
PICTURED: The Gold & Silver ($XAU -0.12%) finished slighty to the downside, slumping toward its 2023 low and its 200-day moving average (DMA) line.
| Oil Services |
$OSX |
77.38 |
+1.17 |
+1.53% |
-7.72% |
| Integrated Oil |
$XOI |
1,666.85 |
+18.68 |
+1.13% |
-6.74% |
| Semiconductor |
$SOX |
3,708.06 |
-31.69 |
-0.85% |
+46.44% |
| Networking |
$NWX |
840.96 |
+9.49 |
+1.14% |
+7.36% |
| Broker/Dealer |
$XBD |
478.23 |
+7.29 |
+1.55% |
+6.48% |
| Retail |
$RLX |
3,388.17 |
+32.30 |
+0.96% |
+23.03% |
| Gold & Silver |
$XAU |
123.16 |
-0.14 |
-0.12% |
+1.90% |
| Bank |
$BKX |
82.23 |
+1.22 |
+1.50% |
-18.47% |
| Biotech |
$BTK |
5,475.23 |
+68.87 |
+1.27% |
+3.68% |
|
|
|
 |
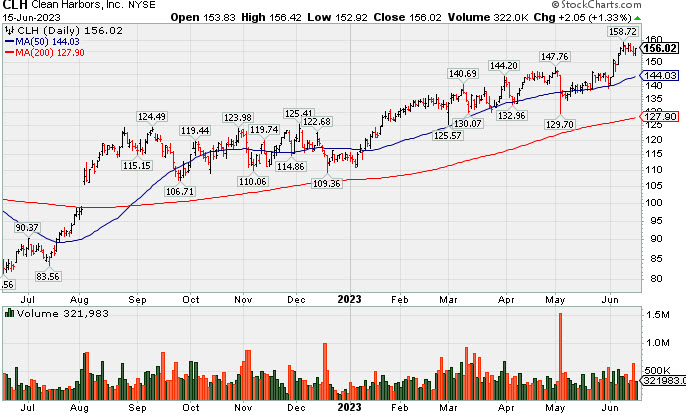
Extended From Any Sound Base and Hovering Near High
Kenneth J. Gruneisen - Passed the CAN SLIM® Master's Exam
Clean Harbors Inc (CLH +$2.05 or +1.33% to $156.02) is hovering near its all-time high, extended from any sound base. Its 50-day moving average (DMA) line ($144) defines near-term support to watch on pullbacks.
CLH has an Earnings Per Share Rating of 99. It reported Mar '23 quarterly earnings +64% on +12% sales revenues versus the year-ago period. Prior quarters showed a strong earnings track record with earnings above the +25% minimum guideline (C criteria). Annual earnings (A criteria) growth has been strong and steady.
There are only 54.1 million shares outstanding (S criteria), which can contribute to greater price volatility in the event of institutional buying or selling. The number of top-rated funds owning its shares rose from 590 in Sep '21 to 749 in Mar '23, a reassuring sign concerning the I criteria. The current Up/Down Volume Ratio of 1.0 is an unbiased indication its shares have been neutral concerning accumulation/distribution over the past 50 days. It has a Timeliness Rating of A , a Sponsorship Rating of C, abd an Accumulation Distribution Rating of B-.
Symbol/Exchange
Company Name
Industry Group | PRICE | CHANGE
(%Change) | Day High | Volume
(% DAV)
(% 50 day avg vol) | 52 Wk Hi
% From Hi | Featured
Date | Price
Featured | Pivot Featured | | Max Buy |  GPK - NYSE GPK - NYSE
Graphic Packaging
Paper and Paper Products | $26.17 | +0.35
1.36% | $26.22 | 4,413,517
144.42% of 50 DAV
50 DAV is 3,056,000 | $27.56
-5.04%
| 10/25/2022 | $22.75 | PP = $24.17 | | MB = $25.38 | Most Recent Note - 6/14/2023 12:00:16 PM
G - Slumping below its prior high in the $26 area with today's loss. There was a "negative reversal" on the prior session for a loss with heavy volume after hitting new all-time highs with 8 consecutive gains. It did not form a sound new base of sufficient length but quickly recovered after testing its 4/27/23 low. Reported Mar '23 quarterly earnings +60% on +9% sales revenues versus the year-ago period.
>>> FEATURED STOCK ARTICLE : Graphic Packaging Hits New High With 6th Consecutive Gain - 6/8/2023 | View all notes | Set NEW NOTE alert | Company Profile | SEC News | Chart | Request a new note C A S I | STRL - NASDAQ
Sterling Infrastructure
Bldg-Heavy Construction | $52.97 | +0.72
1.38% | $52.97 | 174,387
66.56% of 50 DAV
50 DAV is 262,000 | $54.44
-2.70%
| 12/14/2022 | $32.41 | PP = $33.72 | | MB = $35.41 | Most Recent Note - 6/13/2023 5:17:30 PM
G - Hit yet another new all-time high today but ended near the session low. It is very extended from any sound base. Mar ''23 quarterly earnings were below the +25% minimum guideline (C criteria) raising fundamental concerns.
>>> FEATURED STOCK ARTICLE : Impressive Streak of Gains for New Highs - 6/7/2023 | View all notes | Set NEW NOTE alert | Company Profile | SEC News | Chart | Request a new note C A S I | FIX - NYSE
Comfort Systems USA
Bldg-A/C and Heating Prds | $162.65 | +2.27
1.42% | $163.61 | 353,919
128.23% of 50 DAV
50 DAV is 276,000 | $162.75
-0.06%
| 4/27/2023 | $148.85 | PP = $152.23 | | MB = $159.84 | Most Recent Note - 6/12/2023 6:08:15 PM
G - Color code is changed to green after hitting a new all-time high and closing above its "max buy" level with today''s big gain backed by +19% above average volume. No resistance remains due to overhead supply.
>>> FEATURED STOCK ARTICLE : Churning Action While Recently Hovering Near All-Time High - 5/12/2023 | View all notes | Set NEW NOTE alert | Company Profile | SEC News | Chart | Request a new note C A S I | KOF - NYSE
Coca-Cola Femsa ADR
Beverages-Non-Alcoholic | $88.34 | -0.26
-0.29% | $88.93 | 141,013
76.64% of 50 DAV
50 DAV is 184,000 | $91.23
-3.17%
| 6/9/2023 | $88.61 | PP = $91.33 | | MB = $95.90 | Most Recent Note - 6/14/2023 4:26:42 PM
Y - Perched within striking distance of its 52-week high. Found support near its 50 DMA line ($85.63) during its recent consolidation. Subsequent gains above the pivot point backed by at least +40% above average volume may trigger a technical buy signal. Fundamentals remain strong.
>>> FEATURED STOCK ARTICLE : Coca-Cola Femsa Posts 7th Consecutive Gain - 6/9/2023 | View all notes | Set NEW NOTE alert | Company Profile | SEC News | Chart | Request a new note C A S I | CLH - NYSE
Clean Harbors
Pollution Control | $156.02 | +2.05
1.33% | $156.42 | 322,045
85.42% of 50 DAV
50 DAV is 377,000 | $158.72
-1.70%
| 3/10/2023 | $136.89 | PP = $136.74 | | MB = $143.58 |  Most Recent Note - 6/15/2023 5:59:17 PM Most Recent Note - 6/15/2023 5:59:17 PM
G - Hovering near its all-time high, extended from any sound base. Its 50 DMA line ($144) defines near-term support to watch on pullbacks. Fundamentals remain strong. See the latest FSU analysis for more details and a new annotated graph.
>>> FEATURED STOCK ARTICLE : Extended From Any Sound Base and Hovering Near High - 6/15/2023 | View all notes | Set NEW NOTE alert | Company Profile | SEC News | Chart | Request a new note C A S I | Symbol/Exchange
Company Name
Industry Group | PRICE | CHANGE
(%Change) | Day High | Volume
(% DAV)
(% 50 day avg vol) | 52 Wk Hi
% From Hi | Featured
Date | Price
Featured | Pivot Featured | | Max Buy | SPSC - NASDAQ
SPS Commerce
Comp Sftwr-Spec Enterprs | $182.02 | +2.60
1.45% | $182.22 | 350,333
232.01% of 50 DAV
50 DAV is 151,000 | $180.50
0.84%
| 4/24/2023 | $150.01 | PP = $157.56 | | MB = $165.44 | Most Recent Note - 6/15/2023 12:15:47 PM
G - Inching to yet another new 52-week high with today's 11th gain in the span of 12 sessions, getting very extended from any sound base. Reported Mar '23 quarterly earnings +22% on +20% versus the year-ago period, below the +25% minimum earnings guideline (C criteria) raising some fundamental concerns.
>>> FEATURED STOCK ARTICLE : Pulled Back After Quietly Wedging to New Highs - 5/31/2023 | View all notes | Set NEW NOTE alert | Company Profile | SEC News | Chart | Request a new note C A S I | HUBB - NYSE
Hubbell
Electrical-Power/Equipmt | $321.02 | +5.57
1.77% | $321.82 | 472,132
117.15% of 50 DAV
50 DAV is 403,000 | $316.57
1.41%
| 4/25/2023 | $262.85 | PP = $257.51 | | MB = $270.39 | Most Recent Note - 6/13/2023 5:15:56 PM
G - Hit yet another new all-time high with today''s 6th consecutive gain, getting more extended from the prior base. Prior highs in the $263 area define initial support to watch on pullbacks. Fundamentals remain strong.
>>> FEATURED STOCK ARTICLE : Extended From Prior Base and Perched Near High - 6/1/2023 | View all notes | Set NEW NOTE alert | Company Profile | SEC News | Chart | Request a new note C A S I | NVR - NYSE
NVR
Bldg-Resident/Comml | $5,944.96 | +58.39
0.99% | $5,961.14 | 21,221
92.27% of 50 DAV
50 DAV is 23,000 | $5,986.96
-0.70%
| 4/25/2023 | $5,882.18 | PP = $5,978.25 | | MB = $6,277.16 | Most Recent Note - 6/13/2023 5:14:42 PM
G - Posted a 4th consecutive gain today with below-average volume. Its 50 DMA line ($5,747) defines near-term support above the recent low ($5,520 on 6/01/23). Reported Mar ''23 quarterly earnings -14% on -3% sales revenues versus the year-ago period, below the +25% minimum earnings guideline (C criteria) raising fundamental concerns, and its color code was changed to green. Prior quarterly comparisons were well above the +25% minimum earnings guideline (C criteria). Annual earnings (A criteria) growth has been very strong.
>>> FEATURED STOCK ARTICLE : Rebounded Above 50 Day Average With Light Volume Gains - 6/6/2023 | View all notes | Set NEW NOTE alert | Company Profile | SEC News | Chart | Request a new note C A S I | PHM - NYSE
PulteGroup
Bldg-Resident/Comml | $73.96 | +0.71
0.97% | $74.51 | 2,468,874
83.35% of 50 DAV
50 DAV is 2,962,000 | $74.53
-0.76%
| 4/25/2023 | $65.17 | PP = $64.01 | | MB = $67.21 | Most Recent Note - 6/12/2023 6:12:42 PM
G - Hit yet another new high with today''s 2nd consecutive gain backed by below average volume, getting more extended from any sound base. Reported earnings +28% for the Mar ''23 quarter versus the year-ago period. Important support to watch is defined by its 50 DMA line ($65) and recent low.
>>> FEATURED STOCK ARTICLE : Rebounded Above "Max Buy" Level Toward Recent High - 6/2/2023 | View all notes | Set NEW NOTE alert | Company Profile | SEC News | Chart | Request a new note C A S I | COKE - NASDAQ
Coca-Cola Consolidated
Beverages-Non-Alcoholic | $640.82 | -6.07
-0.94% | $652.23 | 35,052
94.74% of 50 DAV
50 DAV is 37,000 | $694.20
-7.69%
| 5/4/2023 | $646.66 | PP = $656.21 | | MB = $689.02 | Most Recent Note - 6/14/2023 4:54:01 PM
Y - Pulled back below its pivot point with today''s 4th consecutive volume-driven loss. Recent lows in the $625 area define important near-term support above its 50 DMA line. Fundamentals remain strong. See the latest FSU analysis for more details and a new annotated graph.
>>> FEATURED STOCK ARTICLE : Fell Below Pivot Point With Recent Volume-Driven Losses - 6/14/2023 | View all notes | Set NEW NOTE alert | Company Profile | SEC News | Chart | Request a new note C A S I | Symbol/Exchange
Company Name
Industry Group | PRICE | CHANGE
(%Change) | Day High | Volume
(% DAV)
(% 50 day avg vol) | 52 Wk Hi
% From Hi | Featured
Date | Price
Featured | Pivot Featured | | Max Buy | AMPH - NASDAQ
Amphastar Pharm
Medical-Biomed/Biotech | $52.23 | +4.29
8.95% | $52.85 | 1,056,139
254.49% of 50 DAV
50 DAV is 415,000 | $48.39
7.94%
| 5/15/2023 | $43.56 | PP = $44.15 | | MB = $46.36 | Most Recent Note - 6/15/2023 11:51:19 AM
G - Hitting another new high with today's big gain backed by above average volume, getting very extended from any sound base. Prior highs in the $44 area define initial support to watch above its 50 DMA line ($42) on pullbacks. Fundamentals remain strong.
>>> FEATURED STOCK ARTICLE : Weak Finish After Early Gain When Perched Near All-Time High - 5/15/2023 | View all notes | Set NEW NOTE alert | Company Profile | SEC News | Chart | Request a new note C A S I | ANET - NYSE
Arista Networks
Computer-Networking | $163.47 | -5.61
-3.32% | $164.32 | 6,493,030
200.84% of 50 DAV
50 DAV is 3,233,000 | $178.36
-8.35%
| 5/30/2023 | $176.35 | PP = $171.54 | | MB = $180.12 | Most Recent Note - 6/15/2023 11:52:44 AM
Y - Gapped down today for a loss with above average volume raising concerns. Stalled after recent gains triggered a technical buy signal. Its 50 DMA line ($154) defines important near-term support to watch. Fundamentals remain strong.
>>> FEATURED STOCK ARTICLE : Rebounding Near Recent High With 3 Consecutive Gains - 6/12/2023 | View all notes | Set NEW NOTE alert | Company Profile | SEC News | Chart | Request a new note C A S I | PANW - NASDAQ
Palo Alto Networks
Computer Sftwr-Security | $243.80 | +5.24
2.20% | $244.86 | 6,476,768
143.16% of 50 DAV
50 DAV is 4,524,000 | $239.63
1.74%
| 6/5/2023 | $228.35 | PP = $213.73 | | MB = $224.42 | Most Recent Note - 6/14/2023 4:56:30 PM
G - Posted a 3rd consecutive gain today backed by +27% above average volume hitting a new all-time high and its color code is changed to green after rising above its "max buy" level. The prior high ($213) defines initial support to watch. Fundamentals remain strong.
>>> FEATURED STOCK ARTICLE : Palo Alto Powers to New Highs Again - 6/5/2023 | View all notes | Set NEW NOTE alert | Company Profile | SEC News | Chart | Request a new note C A S I | LSCC - NASDAQ
Lattice Semiconductor
Elec-Semicondctor Fablss | $89.65 | -2.42
-2.63% | $91.57 | 1,630,628
67.46% of 50 DAV
50 DAV is 2,417,000 | $96.82
-7.41%
| 6/13/2023 | $91.73 | PP = $96.92 | | MB = $101.77 | Most Recent Note - 6/13/2023 12:39:52 PM
Y - Color code is changed to yellow with pivot point cited based on its 3/23/23 high plus 10 cents. Gapped up today approaching prior highs after rebounding above its 50 DMA line ($85.23) on the prior session with a volume-driven gain. Subsequent gains above the pivot point backed by at least +40% above average volume may trigger a technical buy signal. Reported Mar '23 quarterly earnings +38% on +22% sales revenues versus the year-ago period, its 9th consecutive strong quarterly comparison above the +25% minimum earnings guideline (C criteria). Annual earnings history (A criteria) has been strong.
>>> FEATURED STOCK ARTICLE : Lattice Posts Volume-Driven Gains Approaching Prior High - 6/13/2023 | View all notes | Set NEW NOTE alert | Company Profile | SEC News | Chart | Request a new note C A S I |
|
|
|
Color Codes Explained :
Y - Better candidates highlighted by our
staff of experts.
G - Previously featured
in past reports as yellow but may no longer be buyable under the
guidelines.
***Last / Change / Volume data in this table is the closing quote data***
|
|
|
THESE ARE NOT BUY RECOMMENDATIONS!
Comments contained in the body of this report are technical
opinions only. The material herein has been obtained
from sources believed to be reliable and accurate, however,
its accuracy and completeness cannot be guaranteed.
This site is not an investment advisor, hence it does
not endorse or recommend any securities or other investments.
Any recommendation contained in this report may not
be suitable for all investors and it is not to be deemed
an offer or solicitation on our part with respect to
the purchase or sale of any securities. All trademarks,
service marks and trade names appearing in this report
are the property of their respective owners, and are
likewise used for identification purposes only.
This report is a service available
only to active Paid Premium Members.
You may opt-out of receiving report notifications
at any time. Questions or comments may be submitted
by writing to Premium Membership Services 665 S.E. 10 Street, Suite 201 Deerfield Beach, FL 33441-5634 or by calling 1-800-965-8307
or 954-785-1121.
|
|
|