You are not logged in.
This means you
CAN ONLY VIEW reports that were published prior to Thursday, March 20, 2025.
You
MUST UPGRADE YOUR MEMBERSHIP if you want to see any current reports.
AFTER MARKET UPDATE - TUESDAY, APRIL 11TH, 2023
Previous After Market Report Next After Market Report >>>
|
|
|
|
DOW |
+98.27 |
33,684.79 |
+0.29% |
|
Volume |
817,008,051 |
-1% |
|
Volume |
4,638,677,900 |
+8% |
|
NASDAQ |
-52.48 |
12,031.88 |
-0.43% |
|
Advancers |
2,162 |
73% |
|
Advancers |
2,596 |
58% |
|
S&P 500 |
-0.17 |
4,108.94 |
-0.00% |
|
Decliners |
781 |
27% |
|
Decliners |
1,877 |
42% |
|
Russell 2000 |
+14.15 |
1,786.59 |
+0.80% |
|
52 Wk Highs |
44 |
|
|
52 Wk Highs |
72 |
|
|
S&P 600 |
+8.53 |
1,172.38 |
+0.73% |
|
52 Wk Lows |
18 |
|
|
52 Wk Lows |
121 |
|
|
 |
Leadership Improved but Indices Were Mixed and Little Changed
Kenneth J. Gruneisen - Passed the CAN SLIM® Master's Exam
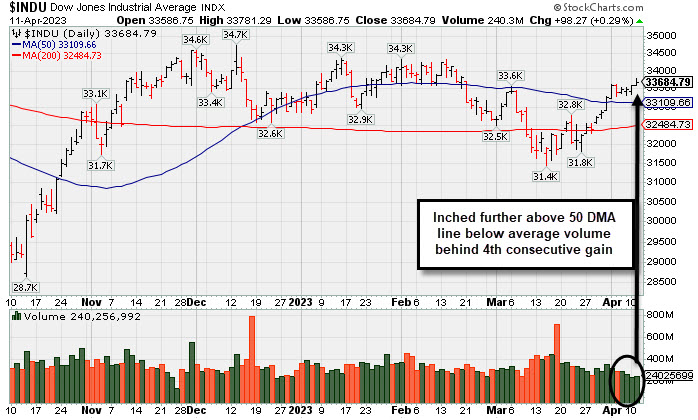
The Dow gained 98 points (0.3%), while the Nasdaq Composite dipped 0.4% and the S&P 500 finished flat. Volume totals reported were mixed, lighter than the prior session on the NYSE and higher on the Nasdaq exchange. Breadth was positive as advancers led decliners by almost a 3-1 margin on the NYSE and by 5-4 on the Nasdaq exchange. Leadership improved as there were 25 high-ranked companies from the Leaders List that hit a new 52-week high and were listed on the BreakOuts Page, versus the total of 13 on the prior session. New 52-week highs outnumbered new 52-week lows on the NYSE but new lows still outnumbered new highs on the Nasdaq exchange. The major indices are in a confirmed uptrend (M criteria). Appropriate new buying efforts may be considered under the fact-based investment system.
PICTURED: The Dow Jones Industrial Average posted a 4th consecutive gain with below average volume, inching further above its 50-day moving average (DMA) line.
Nine of 11 sectors finished in positive territory as U.S. equities finished mixed Tuesday. On Wednesday the Consumer Price Index (CPI) report for March is expected to come in at 5.1% year-over-year, easing from February’s 6% annual gain. Meanwhile, Core CPI (which excludes the more volatile food and energy prices) is forecasted to accelerate, coming in at 5.6% year-over-year versus February’s 5.5% print. Investors are also digesting comments from Federal Reserve (Fed) officials. New York Fed President John Williams signaled the central bank still has more work to do to bring inflation down, while Chicago Fed President Austan Goolsbee called for further investigation of the potential economic impacts that may come from tighter credit conditions.
On the data front today, the National Federation of Independent Business (NFIB) Small Business Optimism Index ticked lower in March as the banking crisis weighed on sentiment. The report showed some small businesses were having difficulty obtaining a loan last month, and many indicated they see tighter credit conditions in the coming months. Treasuries were little changed, with the yield on the benchmark 10-year note up one basis point (0.01%) to 3.43%, while the 30-year dipped one basis point (0.01%) to 3.62%. The yield on the more monetary policy-sensitive two-year note climbed two basis points (0.02%) to 4.03%. In commodities, West Texas Intermediate (WTI) crude advanced 2.1% to $81.40/barrel ahead of this week’s inflation data.
|
 Kenneth J. Gruneisen started out as a licensed stockbroker in August 1987, a couple of months prior to the historic stock market crash that took the Dow Jones Industrial Average down -22.6% in a single day. He has published daily fact-based fundamental and technical analysis on high-ranked stocks online for two decades. Through FACTBASEDINVESTING.COM, Kenneth provides educational articles, news, market commentary, and other information regarding proven investment systems that work in good times and bad.
Comments contained in the body of this report are technical opinions only and are not necessarily those of Gruneisen Growth Corp. The material herein has been obtained from sources believed to be reliable and accurate, however, its accuracy and completeness cannot be guaranteed. Our firm, employees, and customers may effect transactions, including transactions contrary to any recommendation herein, or have positions in the securities mentioned herein or options with respect thereto. Any recommendation contained in this report may not be suitable for all investors and it is not to be deemed an offer or solicitation on our part with respect to the purchase or sale of any securities. |
|
 |
Financials and Commodity-Linked Groups Led Gainers
Kenneth J. Gruneisen - Passed the CAN SLIM® Master's Exam
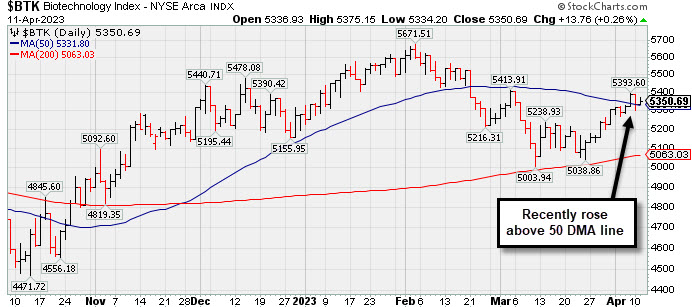
The Broker/Dealer Index ($XBD +0.91%) and Bank Index ($BKX +1.28%) both posted gains while the Retail Index ($RLX -0.85%) created a drag on the major averages. The tech sector had a negative bias as the Semiconductor Index ($SOX -0.56%) and Networking Index ($NWX -1.10%) both lost ground. Commodity-linked groups had a positive bias as the Gold & Silver Index ($XAU +1.23%), Oil Services Index ($OSX +1.69%), and Integrated Oil Index ($XOI +0.99%) posted unanimous gains.
PICTURED: The Biotech Index ($BTK +0.26%) inched higher and recently rebounded above its 50-day moving average (DMA) line.
| Oil Services |
$OSX |
82.18 |
+1.37 |
+1.69% |
-2.00% |
| Integrated Oil |
$XOI |
1,815.08 |
+17.83 |
+0.99% |
+1.56% |
| Semiconductor |
$SOX |
3,109.42 |
-17.55 |
-0.56% |
+22.80% |
| Networking |
$NWX |
827.69 |
-9.21 |
-1.10% |
+5.67% |
| Broker/Dealer |
$XBD |
445.41 |
+4.01 |
+0.91% |
-0.83% |
| Retail |
$RLX |
2,942.05 |
-25.10 |
-0.85% |
+6.83% |
| Gold & Silver |
$XAU |
139.04 |
+1.69 |
+1.23% |
+15.05% |
| Bank |
$BKX |
82.12 |
+1.04 |
+1.28% |
-18.57% |
| Biotech |
$BTK |
5,350.69 |
+13.76 |
+0.26% |
+1.32% |
|
|
|
 |
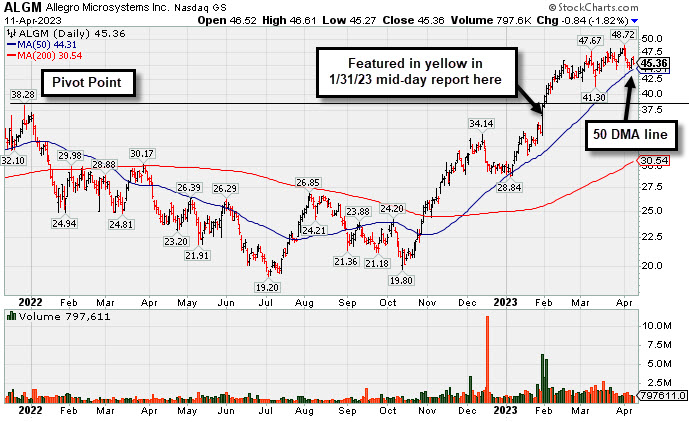
Consolidating Near 50 DMA Line After Recent Rally
Kenneth J. Gruneisen - Passed the CAN SLIM® Master's Exam
Allegro Microsystems Inc (ALGM -$0.84 or -1.82% to $45.36) ended lower today with below-average volume, consolidating just above its 50-day moving average (DMA) line ($44.31) which defines important near-term support to watch on pullbacks.
The company hails from the Elec-Semiconductor Mfg group which is currently ranked 1st on the 197 Industry Groups list. It has a highest possible 99 Earnings Per Share Rating. Quarterly comparisons through Dec '22 have been above the +25% minimum earnings guideline (C criteria). Annual earnings history has been strong since its $14 IPO in Oct '20. ALGM has a new CEO as of Jun '22.
The number of top-rated funds owning its shares rose from 341 in Mar '22 to 527 in Mar '23, a reassuringn sign concerning the I criteria. The current Up/Down Volume Ratio of 1.2 is an unbiased indication its shares have been under accumulation over the past 50 days.
|
|
|
Color Codes Explained :
Y - Better candidates highlighted by our
staff of experts.
G - Previously featured
in past reports as yellow but may no longer be buyable under the
guidelines.
***Last / Change / Volume data in this table is the closing quote data***
Symbol/Exchange
Company Name
Industry Group |
PRICE |
CHANGE
(%Change) |
Day High |
Volume
(% DAV)
(% 50 day avg vol) |
52 Wk Hi
% From Hi |
Featured
Date |
Price
Featured |
Pivot Featured |
|
Max Buy |
 GPK
-
NYSE
GPK
-
NYSE
Graphic Packaging
CONSUMER NON-DURABLES - Packaging and Containers
|
$25.24
|
+0.21
0.84% |
$25.46
|
2,790,852
86.92% of 50 DAV
50 DAV is 3,211,000
|
$25.62
-1.48%
|
10/25/2022
|
$22.75
|
PP = $24.17
|
|
MB = $25.38
|
Most Recent Note - 4/10/2023 6:46:24 PM
Y - Is quietly consolidating just below its "max buy" level and just -2.3% below its all-time high. Recent gains lacked great volume conviction. Its 50 DMA line ($24.04) and recent low ($22.99 on 3/16/23) define important near-term support to watch. See the latest FSU analysis for more details and a new annotated graph.
>>> FEATURED STOCK ARTICLE : Quietly Consolidating Just Below "Max Buy" Level - 4/10/2023 |
View all notes |
Set NEW NOTE alert |
Company Profile |
SEC
News |
Chart |
Request a new note
C
A
S
I |
STRL
-
NASDAQ
Sterling Infrastructure
MATERIALS and; CONSTRUCTION - Heavy Construction
|
$35.39
|
+0.27
0.77% |
$35.76
|
290,095
109.06% of 50 DAV
50 DAV is 266,000
|
$42.00
-15.74%
|
12/14/2022
|
$32.41
|
PP = $33.72
|
|
MB = $35.41
|
 Most Recent Note - 4/11/2023 5:46:51 PM
G - Still sputtering and failing to rebound after damaging losses with above-average volume violated its 50 DMA line ($37.70) triggering a technical sell signal. A rebound above the 50 DMA line is needed for its outlook to improve.
>>> FEATURED STOCK ARTICLE : Volume-Driven 50-Day Moving Average Violation Triggered Sell Signal - 4/5/2023 |
View all notes |
Set NEW NOTE alert |
Company Profile |
SEC
News |
Chart |
Request a new note
C
A
S
I |
PERI
-
NASDAQ
Perion Network
Comml Svcs-Advertising
|
$39.87
|
+0.53
1.35% |
$40.35
|
644,012
80.40% of 50 DAV
50 DAV is 801,000
|
$42.04
-5.16%
|
1/25/2023
|
$31.79
|
PP = $33.19
|
|
MB = $34.85
|
Most Recent Note - 4/11/2023 5:45:14 PM
G - Volume totals have been cooling while hovering near its all-time high. Its 50 DMA line ($35.46) defines important near-term support to watch.
>>> FEATURED STOCK ARTICLE : Hit Another New High With Gain Backed by Light Volume - 3/31/2023 |
View all notes |
Set NEW NOTE alert |
Company Profile |
SEC
News |
Chart |
Request a new note
C
A
S
I |
ALGM
-
NASDAQ
Allegro MicroSystems
Elec-Semiconductor Mfg
|
$45.36
|
-0.84
-1.82% |
$46.61
|
797,621
47.70% of 50 DAV
50 DAV is 1,672,000
|
$48.72
-6.90%
|
1/31/2023
|
$37.80
|
PP = $38.38
|
|
MB = $40.30
|
Most Recent Note - 4/11/2023 5:41:30 PM
G - Volume totals have been cooling while consolidating just above its 50 DMA line ($44.31) which defines important near-term support to watch on pullbacks. See the latest FSU analysis for more details and a new annotated graph.
>>> FEATURED STOCK ARTICLE : Consolidating Near 50 DMA Line After Recent Rally - 4/11/2023 |
View all notes |
Set NEW NOTE alert |
Company Profile |
SEC
News |
Chart |
Request a new note
C
A
S
I |
FIX
-
NYSE
Comfort Systems USA
MATERIALS and CONSTRUCTION - General Contractors
|
$129.67
|
-0.88
-0.67% |
$132.45
|
295,850
103.81% of 50 DAV
50 DAV is 285,000
|
$152.13
-14.76%
|
2/23/2023
|
$136.52
|
PP = $128.78
|
|
MB = $135.22
|
Most Recent Note - 4/11/2023 5:43:57 PM
G - Still sputtering near prior highs in the $128 area which are acting as support after damaging losses violated its 50 DMA line ($134.71) triggering a technical sell signal. Only a prompt rebound above the 50 DMA line would help its outlook improve. Fundamentals remain strong.
>>> FEATURED STOCK ARTICLE : Pullback With Higher Volume While Consolidating - 4/4/2023 |
View all notes |
Set NEW NOTE alert |
Company Profile |
SEC
News |
Chart |
Request a new note
C
A
S
I |
Symbol/Exchange
Company Name
Industry Group |
PRICE |
CHANGE
(%Change) |
Day High |
Volume
(% DAV)
(% 50 day avg vol) |
52 Wk Hi
% From Hi |
Featured
Date |
Price
Featured |
Pivot Featured |
|
Max Buy |
KOF
-
NYSE
Coca-Cola Femsa ADR
FOOD and BEVERAGE - Beverages - Soft Drinks
|
$83.24
|
+0.57
0.69% |
$84.55
|
279,963
152.99% of 50 DAV
50 DAV is 183,000
|
$82.84
0.48%
|
3/7/2023
|
$76.63
|
PP = $77.11
|
|
MB = $80.97
|
Most Recent Note - 4/11/2023 12:34:39 PM
G - Hitting yet another new all-time high with today's 10th consecutive gain, getting extended from the prior base. On pullbacks, prior highs in the $79-$77 area define initial support to watch above its 50 DMA line ($75.49).
>>> FEATURED STOCK ARTICLE : Gain for Best-Ever Close With Near Average Volume - 3/24/2023 |
View all notes |
Set NEW NOTE alert |
Company Profile |
SEC
News |
Chart |
Request a new note
C
A
S
I |
ANET
-
NYSE
Arista Networks
Computer-Networking
|
$159.61
|
-3.52
-2.16% |
$162.50
|
1,806,664
66.77% of 50 DAV
50 DAV is 2,706,000
|
$171.44
-6.90%
|
3/8/2023
|
$147.59
|
PP = $148.67
|
|
MB = $156.10
|
Most Recent Note - 4/11/2023 5:47:59 PM
G - Pulled back today with below-average volume. Very extended from any sound base after an impressive spurt of volume-driven gains. Prior highs in the $148-145 area define important support to watch along with its 50 DMA line ($148).
>>> FEATURED STOCK ARTICLE : Pulling Back After Getting Very Extended From Prior Base - 3/28/2023 |
View all notes |
Set NEW NOTE alert |
Company Profile |
SEC
News |
Chart |
Request a new note
C
A
S
I |
CLH
-
NYSE
Clean Harbors
Pollution Control
|
$138.40
|
+1.35
0.99% |
$139.29
|
463,904
108.64% of 50 DAV
50 DAV is 427,000
|
$144.20
-4.02%
|
3/10/2023
|
$136.89
|
PP = $136.74
|
|
MB = $143.58
|
Most Recent Note - 4/10/2023 6:52:48 PM
Y - Posted a gain today with below-average volume, finding support near its 50 DMA line ($134.10). Below that important short-term average, the recent low ($129.93 on 3/24/23) defines the next important support where a violation would raise concerns and trigger a more worrisome technical sell signal. Fundamentals remain strong.
>>> FEATURED STOCK ARTICLE : Finding Support Recently at 50-Day Moving Average Line - 3/29/2023 |
View all notes |
Set NEW NOTE alert |
Company Profile |
SEC
News |
Chart |
Request a new note
C
A
S
I |
|
|
|
THESE ARE NOT BUY RECOMMENDATIONS!
Comments contained in the body of this report are technical
opinions only. The material herein has been obtained
from sources believed to be reliable and accurate, however,
its accuracy and completeness cannot be guaranteed.
This site is not an investment advisor, hence it does
not endorse or recommend any securities or other investments.
Any recommendation contained in this report may not
be suitable for all investors and it is not to be deemed
an offer or solicitation on our part with respect to
the purchase or sale of any securities. All trademarks,
service marks and trade names appearing in this report
are the property of their respective owners, and are
likewise used for identification purposes only.
This report is a service available
only to active Paid Premium Members.
You may opt-out of receiving report notifications
at any time. Questions or comments may be submitted
by writing to Premium Membership Services 665 S.E. 10 Street, Suite 201 Deerfield Beach, FL 33441-5634 or by calling 1-800-965-8307
or 954-785-1121.
|
|
|