You are not logged in.
This means you
CAN ONLY VIEW reports that were published prior to Thursday, March 20, 2025.
You
MUST UPGRADE YOUR MEMBERSHIP if you want to see any current reports.
AFTER MARKET UPDATE - MONDAY, APRIL 12TH, 2021
Previous After Market Report Next After Market Report >>>
|
|
|
|
DOW |
-55.20 |
33,745.40 |
-0.16% |
|
Volume |
789,124,097 |
-0% |
|
Volume |
4,217,311,400 |
+9% |
|
NASDAQ |
-52.30 |
13,847.88 |
-0.38% |
|
Advancers |
1,637 |
51% |
|
Advancers |
1,452 |
35% |
|
S&P 500 |
-0.81 |
4,127.99 |
-0.02% |
|
Decliners |
1,603 |
49% |
|
Decliners |
2,646 |
65% |
|
Russell 2000 |
-9.69 |
2,233.78 |
-0.43% |
|
52 Wk Highs |
305 |
|
|
52 Wk Highs |
179 |
|
|
S&P 600 |
+0.83 |
1,335.39 |
+0.06% |
|
52 Wk Lows |
17 |
|
|
52 Wk Lows |
73 |
|
|
 |
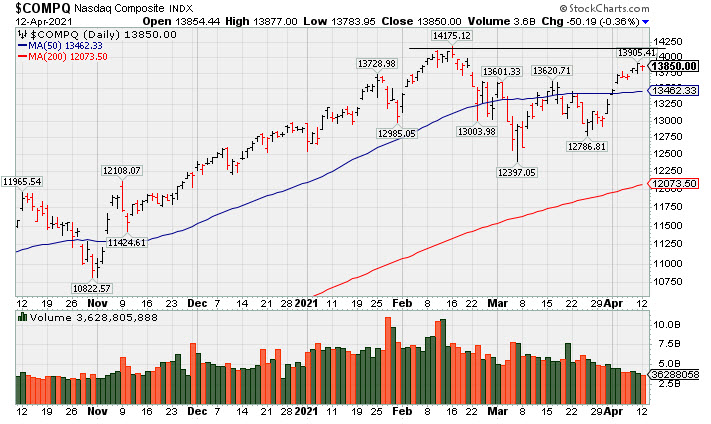
Leadership Improved But Major Indices Finished Lower
Kenneth J. Gruneisen - Passed the CAN SLIM® Master's Exam
The Dow lost 55 points, while the S&P 500 dipped less than 0.1%, with both benchmarks drifting from record levels. The Nasdaq Composite declined 0.4%. The CBOE volatility index (VIX) is still hovering at its lowest level since February 2020. The volume totals were near the prior session on the NYSE and higher on the Nasdaq exchange. Advancers led decliners by a narrow margin on the NYSE but decliners led advancers by a 5-3 margin on the Nasdaq exchange. Leadership improved as there were 60 high-ranked companies from the Leaders List that hit new 52-week highs and were listed on the BreakOuts Page, versus the total of 34 on the prior session. New 52-week highs totals solidly outnumbered new 52-week lows on the NYSE on the Nasdaq exchange. The major indices (M criteria) are in a confirmed uptrend. Investors are reminded to always make buying and selling decisions on case-by-case basis under the strict criteria and rules of the fact-based investment system.
PICTURED: The Nasdaq Composite Index is perched within close striking distance of its record high.
U.S. stocks finished slightly lower on Monday as Wall Street awaited a jam-packed week of corporate earnings reports and key economic releases. Treasuries weakened modestly, with the yield on the 10-year note up one basis point to 1.67% ahead of tomorrow's closely-watched update on consumer price inflation. Meanwhile, the market braced for another influx of Treasury issuance. Today’s auctions of $38 billion in 10-year notes and $58 billion in three-year notes were met with fairly decent demand. On the data front today, the U.S. government’s March budget deficit ballooned to $659.6 billion, the third highest monthly deficit on record (surpassed only by gaps in April and June of 2020). In commodities, WTI crude rose 0.6% to $59.69/barrel, while COMEX gold slumped 1% to $1,726.70/ounce.
Eight of 11 S&P 500 sectors closed in positive territory, with the Energy, Communication Services, and Technology groups declining. In corporate news, shares of NVIDIA (NVDA +5.62%) rose on an announcement it would offer its first server microprocessors, further challenging Intel’s most profitable market. In M&A news, Nuance Communications (NUAN +15.95%) rose after Microsoft (MSFT +0.02%) agreed to acquire the artificial-intelligence company for $19.7 billion. Meanwhile, investors are anxiously awaiting the start of corporate earnings season, with some of Wall Street's biggest banks posting first-quarter results beginning Wednesday. |
 Kenneth J. Gruneisen started out as a licensed stockbroker in August 1987, a couple of months prior to the historic stock market crash that took the Dow Jones Industrial Average down -22.6% in a single day. He has published daily fact-based fundamental and technical analysis on high-ranked stocks online for two decades. Through FACTBASEDINVESTING.COM, Kenneth provides educational articles, news, market commentary, and other information regarding proven investment systems that work in good times and bad.
Comments contained in the body of this report are technical opinions only and are not necessarily those of Gruneisen Growth Corp. The material herein has been obtained from sources believed to be reliable and accurate, however, its accuracy and completeness cannot be guaranteed. Our firm, employees, and customers may effect transactions, including transactions contrary to any recommendation herein, or have positions in the securities mentioned herein or options with respect thereto. Any recommendation contained in this report may not be suitable for all investors and it is not to be deemed an offer or solicitation on our part with respect to the purchase or sale of any securities. |
|
 |
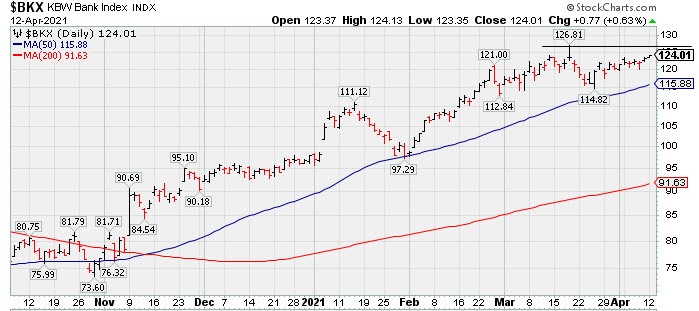
Financial and Retail Indexes Rose While Tech and Commodities Fell
Kenneth J. Gruneisen - Passed the CAN SLIM® Master's Exam
Modest gains from the Bank Index ($BKX +0.63%), Broker/Dealer Index ($XBD +0.37%), and the Retail Index ($RLX +0.31%) had a positive influence on the major averages, but losses elsewhere dragged them all lower. The Semiconductor Index ($SOX -1.06%), Biotech Index ($BTK -0.77%), and Networking Index ($NWX -0.62%) suffered unanimous losses. Commodity-linked groups also had a negative bias as the Gold & Silver Index ($XAU -2.03%) outpaced the Oil Services Index ($OSX -0.75%) and Integrated Oil Index ($XOI -0.98%) to the downside. PICTURED: The Bank Index ($BKX +0.63%) is hovering near its record high.
| Oil Services |
$OSX |
51.43 |
-0.39 |
-0.75% |
+16.01% |
| Integrated Oil |
$XOI |
987.37 |
-9.74 |
-0.98% |
+24.59% |
| Semiconductor |
$SOX |
3,259.48 |
-35.05 |
-1.06% |
+16.60% |
| Networking |
$NWX |
807.00 |
-5.05 |
-0.62% |
+12.53% |
| Broker/Dealer |
$XBD |
459.61 |
+1.68 |
+0.37% |
+21.72% |
| Retail |
$RLX |
3,912.14 |
+12.27 |
+0.31% |
+9.79% |
| Gold & Silver |
$XAU |
140.84 |
-2.92 |
-2.03% |
-2.33% |
| Bank |
$BKX |
124.01 |
+0.77 |
+0.63% |
+26.66% |
| Biotech |
$BTK |
5,385.11 |
-41.99 |
-0.77% |
-6.17% |
|
|
|
 |
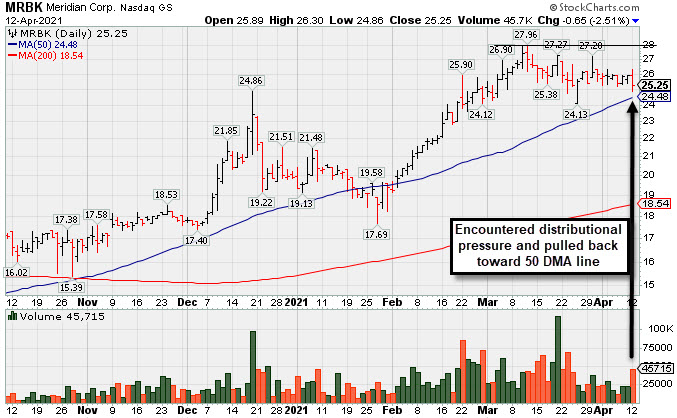
Encountering Distributional Pressure
Kenneth J. Gruneisen - Passed the CAN SLIM® Master's Exam
Meridian Corp (MRBK -$0.65 or -2.51% to $25.25) ended the day with a loss on higher volume indicative of distributional pressure. Volume totals had been below average in recent weeks while hovering in a tight range within close striking distance of its all-time high. Its 50-day moving average (DMA) line ($24.84) and prior low ($24.13 on 3/25/21) define important near-term support to watch where violations may trigger technical sell signals.
Its Relative Strength Rating is 78, below the 80+ minimum guideline. MRBK was highlighted in yellow with pivot point cited based on its 12/18/21 high plus 10 cents in the 2/22/21 mid-day report (read here). It was last shown in this FSU section on 3/15/21 with an annotated graph under the headline, "Prior High Defines Initial Support to Watch".
The thinly-traded company is in the Banks-Northeast industry group which currently has a Group Relative Strength Rating of 82 (A-). There are a fair number of other strong leaders (L criteria) in the group. The past 3 quarterly comparisons through Dec '20 had earnings increases well above the +25% minimum guideline (C criteria). Annual earnings growth (A criteria) has been good since it Nov '17 IPO at $17.
The number of top rated funds that own its shares rose from 30 in Mar '20 to 119 in Dec '20, a reassuring sign concerning the I criteria. The current Up/Down Volume Ratio of 1.6 is an unbiased indication its shares have been under accumulation over the past 50 days. The small supply of only 6.2 million shares outstanding (S criteria) can contribute to greater volatility in the event of institutional buying or selling. |
|
|
Color Codes Explained :
Y - Better candidates highlighted by our
staff of experts.
G - Previously featured
in past reports as yellow but may no longer be buyable under the
guidelines.
***Last / Change / Volume data in this table is the closing quote data***
Symbol/Exchange
Company Name
Industry Group |
PRICE |
CHANGE
(%Change) |
Day High |
Volume
(% DAV)
(% 50 day avg vol) |
52 Wk Hi
% From Hi |
Featured
Date |
Price
Featured |
Pivot Featured |
|
Max Buy |
 FBC
-
NYSE
FBC
-
NYSE
Flagstar Bancorp Inc
BANKING - Savings and Loans
|
$44.95
|
+0.12
0.27% |
$45.81
|
392,323
64.68% of 50 DAV
50 DAV is 606,600
|
$51.58
-12.85%
|
3/4/2021
|
$47.26
|
PP = $48.02
|
|
MB = $50.42
|
 Most Recent Note - 4/12/2021 5:46:30 PM
G - Sputtering just below its 50 DMA line ($45.61) with volume totals cooling in recent weeks. Near-term support to watch is prior lows. Relative Strength Rating is 75, below the 80+ minimum guideline.
>>> FEATURED STOCK ARTICLE : Slumping Into Prior Base Following Breakout - 3/22/2021 |
View all notes |
Set NEW NOTE alert |
Company Profile |
SEC
News |
Chart |
Request a new note
C
A
S
I |
CRL
-
NYSE
Charles River Labs Intl
DRUGS - Biotechnology
|
$305.23
|
-1.17
-0.38% |
$306.82
|
198,583
61.48% of 50 DAV
50 DAV is 323,000
|
$307.44
-0.72%
|
12/17/2020
|
$247.06
|
PP = $257.98
|
|
MB = $270.88
|
Most Recent Note - 4/9/2021 5:35:26 PM
G - Posted a quiet gain today for a best-ever close, its 7th gain in 8 sessions. Its 50 DMA line ($284) acted as support throughout its ongoing ascent. Its Relative Strength Rating is 77, below the 80+ minimum guideline for buy candidates. Dec '20 quarterly earnings rose +19% on +14% sales revenues versus the year ago period, below the +25% minimum earnings guideline (C criteria), raising fundamental concerns. See the latest FSU analysis for more details and a new annotated graph.
>>> FEATURED STOCK ARTICLE : Perched at Record High After Rally From 50-Day Moving Average - 4/9/2021 |
View all notes |
Set NEW NOTE alert |
Company Profile |
SEC
News |
Chart |
Request a new note
C
A
S
I |
BRKS
-
NASDAQ
Brooks Automation
ELECTRONICS - Semiconductor Equipment and Mate
|
$95.40
|
-0.30
-0.31% |
$95.66
|
669,381
95.22% of 50 DAV
50 DAV is 703,000
|
$101.63
-6.13%
|
4/5/2021
|
$99.31
|
PP = $91.88
|
|
MB = $96.47
|
Most Recent Note - 4/9/2021 5:38:09 PM
Y - Color code is changed to yellow after quietly consolidating back below its "max buy" level. Prior highs in the $91 area define initial support to watch above its 50 DMA line ($84)
>>> FEATURED STOCK ARTICLE : High Ranked Semiconductor Equipment Firm Powered Higher - 4/7/2021 |
View all notes |
Set NEW NOTE alert |
Company Profile |
SEC
News |
Chart |
Request a new note
C
A
S
I |
ENTG
-
NASDAQ
Entegris Inc
ELECTRONICS - Semiconductor Equipment and Mate
|
$119.70
|
-1.75
-1.44% |
$121.40
|
980,204
101.05% of 50 DAV
50 DAV is 970,000
|
$126.41
-5.31%
|
4/1/2021
|
$118.42
|
PP = $110.37
|
|
MB = $115.89
|
Most Recent Note - 4/8/2021 1:46:41 PM
G - Hovering near its all-time high and stubbornly holding its ground following a spurt of volume-driven gains. Prior highs in the $114-110 area define near-term support to watch on pullbacks.
>>> FEATURED STOCK ARTICLE : Strong Breakout Action With +67% Above Average Volume - 4/1/2021 |
View all notes |
Set NEW NOTE alert |
Company Profile |
SEC
News |
Chart |
Request a new note
C
A
S
I |
OPY
-
NYSE
Oppenheimer Holdings Inc
FINANCIAL SERVICES - Investment Brokerage - Regiona
|
$42.90
|
+0.51
1.20% |
$43.32
|
64,388
47.69% of 50 DAV
50 DAV is 135,000
|
$44.38
-3.33%
|
2/25/2021
|
$38.95
|
PP = $38.11
|
|
MB = $40.02
|
Most Recent Note - 4/12/2021 5:42:42 PM
G - Posted a 2nd consecutive gain with light volume, approaching its prior high. Its 50 DMA line ($39.59) and prior low define near-term support to watch.
>>> FEATURED STOCK ARTICLE : Oppenheimer Consolidating Near Max Buy Level - 3/31/2021 |
View all notes |
Set NEW NOTE alert |
Company Profile |
SEC
News |
Chart |
Request a new note
C
A
S
I |
Symbol/Exchange
Company Name
Industry Group |
PRICE |
CHANGE
(%Change) |
Day High |
Volume
(% DAV)
(% 50 day avg vol) |
52 Wk Hi
% From Hi |
Featured
Date |
Price
Featured |
Pivot Featured |
|
Max Buy |
EDUC
-
NASDAQ
Educational Development
WHOLESALE - Basic Materials Wholesale
|
$17.19
|
-0.23
-1.32% |
$17.35
|
7,741
23.46% of 50 DAV
50 DAV is 33,000
|
$20.00
-14.05%
|
3/10/2021
|
$17.89
|
PP = $20.10
|
|
MB = $21.11
|
Most Recent Note - 4/9/2021 5:39:46 PM
Y - Still consolidating above its 50 DMA line ($16.57) which defines important near-term support. Met stubborn resistance in the $19-20 area. Subsequent gains above the pivot point backed by at least +40% above average volume are needed to trigger a proper technical buy signal.
>>> FEATURED STOCK ARTICLE : Consolidating Above 50 DMA Line Perched Near High - 3/30/2021 |
View all notes |
Set NEW NOTE alert |
Company Profile |
SEC
News |
Chart |
Request a new note
C
A
S
I |
SMPL
-
NASDAQ
Simply Good Foods Co
Food-Confectionery
|
$32.61
|
+1.28
4.09% |
$32.91
|
747,559
105.50% of 50 DAV
50 DAV is 708,600
|
$35.25
-7.49%
|
12/28/2020
|
$30.40
|
PP = $31.44
|
|
MB = $33.01
|
Most Recent Note - 4/12/2021 5:49:10 PM
G - Posted a solid gain today with average volume, approaching prior highs. Reported Feb '21 quarterly earnings +9% on +2% sales revenues versus the year ago period, below the +25% minimum earnings guideline (C criteria), raising fundamental concerns. Found prompt support near its 50 DMA line ($30.42) but its current Relative Strength Rating is 74, below the 80+ minimum guideline for buy candidates.
>>> FEATURED STOCK ARTICLE : Violation of 50-Day Moving Average Triggered Technical Sell Signal - 3/24/2021 |
View all notes |
Set NEW NOTE alert |
Company Profile |
SEC
News |
Chart |
Request a new note
C
A
S
I |
QRVO
-
NASDAQ
Qorvo Inc
ELECTRONICS - Semiconductor - Integrated Cir
|
$192.56
|
+0.70
0.36% |
$192.76
|
571,161
38.08% of 50 DAV
50 DAV is 1,500,000
|
$199.94
-3.69%
|
4/1/2021
|
$190.48
|
PP = $191.92
|
|
MB = $201.52
|
Most Recent Note - 4/12/2021 5:44:22 PM
Y - Posted a small gain today with lighter volume. Perched near its all-time high, it recently wedging up from any orderly 9-week base. Prior highs in the $191-185 area define initial support to watch on pullbacks. See the latest FSU analysis for more details and an annotated graph.
>>> FEATURED STOCK ARTICLE : Hit Another New High With Even Less Volume Conviction - 4/5/2021 |
View all notes |
Set NEW NOTE alert |
Company Profile |
SEC
News |
Chart |
Request a new note
C
A
S
I |
YETI
-
NYSE
Yeti Holdings Inc
Leisure-Products
|
$84.28
|
+5.28
6.68% |
$84.96
|
3,650,736
279.32% of 50 DAV
50 DAV is 1,307,000
|
$80.89
4.19%
|
4/6/2021
|
$76.95
|
PP = $79.42
|
|
MB = $83.39
|
Most Recent Note - 4/12/2021 1:05:34 PM
Y - Hitting a new all-time high with heavier volume behind today's 5th consecutive gain. A new pivot point was cited based on its 2/10/21 high while working on a "double bottom" base. Gains above the pivot point triggered a new (or add-on) technical buy signal.
>>> FEATURED STOCK ARTICLE : YETI Perched Within Striking Distance of High - 4/7/2021 |
View all notes |
Set NEW NOTE alert |
Company Profile |
SEC
News |
Chart |
Request a new note
C
A
S
I |
DT
-
NYSE
Dynatrace Inc
Computer Sftwr-Enterprse
|
$53.01
|
+0.12
0.23% |
$53.63
|
1,237,699
49.32% of 50 DAV
50 DAV is 2,509,400
|
$56.94
-6.90%
|
2/4/2021
|
$51.39
|
PP = $48.95
|
|
MB = $51.40
|
Most Recent Note - 4/8/2021 1:43:40 PM
G - Gapped up today rebounding further above its 50 DMA line ($50.40). Recent lows in the $45 area define important near-term support to watch on pullbacks. Its Relative Strength Rating is 69, well below the 80+ minimum guideline for buy candidates. Fundamentals remain strong after it reported Dec '20 earnings +70% on +28% sales revenues versus the year ago period.
>>> FEATURED STOCK ARTICLE : Gap Up Rebounding Further Above 50-Day Moving Average - 4/8/2021 |
View all notes |
Set NEW NOTE alert |
Company Profile |
SEC
News |
Chart |
Request a new note
C
A
S
I |
Symbol/Exchange
Company Name
Industry Group |
PRICE |
CHANGE
(%Change) |
Day High |
Volume
(% DAV)
(% 50 day avg vol) |
52 Wk Hi
% From Hi |
Featured
Date |
Price
Featured |
Pivot Featured |
|
Max Buy |
MRBK
-
NASDAQ
Meridian Corp
Banks-Northeast
|
$25.25
|
-0.65
-2.51% |
$26.30
|
45,715
126.99% of 50 DAV
50 DAV is 36,000
|
$27.96
-9.69%
|
2/22/2021
|
$25.58
|
PP = $26.10
|
|
MB = $27.41
|
Most Recent Note - 4/12/2021 5:40:44 PM
Y - Encountered distributional pressure today. Volume totals had been below average in recent weeks while hovering in a tight range within close striking distance of its all-time high. Its 50 DMA line ($24.84) and prior low ($24.13 on 3/25/21) define important near-term support to watch where violations may trigger technical sell signals. Its Relative Strength Rating is 78, just below the 80+ minimum guideline. See the latest FSU analysis for more details and a new annotated graph.
>>> FEATURED STOCK ARTICLE : Encountering Distributional Pressure - 4/12/2021 |
View all notes |
Set NEW NOTE alert |
Company Profile |
SEC
News |
Chart |
Request a new note
C
A
S
I |
|
|
|
THESE ARE NOT BUY RECOMMENDATIONS!
Comments contained in the body of this report are technical
opinions only. The material herein has been obtained
from sources believed to be reliable and accurate, however,
its accuracy and completeness cannot be guaranteed.
This site is not an investment advisor, hence it does
not endorse or recommend any securities or other investments.
Any recommendation contained in this report may not
be suitable for all investors and it is not to be deemed
an offer or solicitation on our part with respect to
the purchase or sale of any securities. All trademarks,
service marks and trade names appearing in this report
are the property of their respective owners, and are
likewise used for identification purposes only.
This report is a service available
only to active Paid Premium Members.
You may opt-out of receiving report notifications
at any time. Questions or comments may be submitted
by writing to Premium Membership Services 665 S.E. 10 Street, Suite 201 Deerfield Beach, FL 33441-5634 or by calling 1-800-965-8307
or 954-785-1121.
|
|
|