You are not logged in.
This means you
CAN ONLY VIEW reports that were published prior to Thursday, April 17, 2025.
You
MUST UPGRADE YOUR MEMBERSHIP if you want to see any current reports.
AFTER MARKET UPDATE - TUESDAY, FEBRUARY 21ST, 2023
Previous After Market Report Next After Market Report >>>
|
|
|
|
DOW |
-697.10 |
33,129.59 |
-2.06% |
|
Volume |
975,349,071 |
+13% |
|
Volume |
5,001,100,800 |
+3% |
|
NASDAQ |
-294.97 |
11,492.30 |
-2.50% |
|
Advancers |
354 |
12% |
|
Advancers |
911 |
20% |
|
S&P 500 |
-81.75 |
3,997.34 |
-2.00% |
|
Decliners |
2,636 |
88% |
|
Decliners |
3,719 |
80% |
|
Russell 2000 |
-58.14 |
1,888.21 |
-2.99% |
|
52 Wk Highs |
38 |
|
|
52 Wk Highs |
50 |
|
|
S&P 600 |
-38.21 |
1,244.31 |
-2.98% |
|
52 Wk Lows |
29 |
|
|
52 Wk Lows |
131 |
|
|
 |
Major Averages Lost Ground With an Increase in Volume Totals
Kenneth J. Gruneisen - Passed the CAN SLIM® Master's Exam
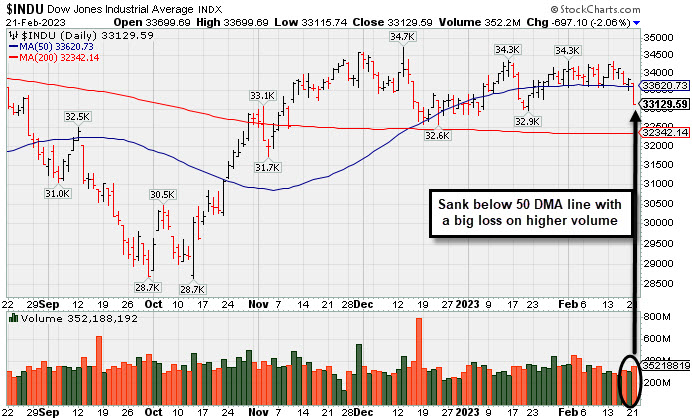
The Dow lost 697 points, while the Nasdaq Composite shed 2.5%. The S&P 500 declined 2% with all sectors finishing in negative territory. Volume totals were higher than the prior session on the NYSE and on the Nasdaq exchange, indicative of an increase in institutional selling pressure. Advancers led decliners by a narrow margin on the NYSE while decliners led advancers by a 5-4 margin on the Nasdaq exchange. There were 10 high-ranked companies from the Leaders List that hit new 52-week highs and were listed on the BreakOuts Page. New 52-week highs totals outnumbered new 52-week lows totals on the NYSE, but new lows expanded and outnumbered shrinking new highs on the Nasdaq exchange. The major indices are in a confirmed uptrend (M criteria). Disciplined investors have a green light for making new buys only in stocks matching all key criteria of the fact-based investment system.
PICTURED: The Dow Jones Industrial Average suffered a big loss with higher volume while violating its 50-day moving average line.
U.S. equities finished lower Tuesday as investors digested the latest round of economic data and tried to gauge the future course of the Federal Reserve’s (Fed) monetary policy. In corporate news, Walmart Inc. (WMT +0.61%) overcame early weakness to finish the session higher after topping quarterly earnings and revenue estimates, although the company issued a bleak outlook for 2023, saying the consumer remains under pressure from high prices.
On the data front, existing home sales unexpectedly fell for the twelfth-straight month in January, falling 0.7% month-over-month, to notch their lowest level in over 12 years. A flash reading for February showed the S&P Global Services Purchasing Managers’ Index (PMI) and the Composite PMI climbed back into expansionary territory, coming in at 50.5 and 50.2, respectively. The Manufacturing PMI climbed more than expected to 47.8, though it remains in contractionary territory. The prints suggest the economy remains resilient despite the Fed’s aggressive monetary policy. The data weighed on sentiment as investors grew more concerned the central bank may raise rates higher than forecasted.
Treasuries weakened, with the yield on the benchmark 10-year note up 14 basis points (0.14%) to 3.95%, its highest since November, while the 30-year bond yield climbed 12 basis points (0.12%) to 3.98%. The yield on the two-year note, which is more sensitive to changes in monetary policy, advanced 12 basis points (0.12%) to 4.73%. In commodities, West Texas Intermediate (WTI) crude fell 0.2% to $76.16/barrel amid renewed concerns about the global economic outlook.
|
 Kenneth J. Gruneisen started out as a licensed stockbroker in August 1987, a couple of months prior to the historic stock market crash that took the Dow Jones Industrial Average down -22.6% in a single day. He has published daily fact-based fundamental and technical analysis on high-ranked stocks online for two decades. Through FACTBASEDINVESTING.COM, Kenneth provides educational articles, news, market commentary, and other information regarding proven investment systems that work in good times and bad.
Comments contained in the body of this report are technical opinions only and are not necessarily those of Gruneisen Growth Corp. The material herein has been obtained from sources believed to be reliable and accurate, however, its accuracy and completeness cannot be guaranteed. Our firm, employees, and customers may effect transactions, including transactions contrary to any recommendation herein, or have positions in the securities mentioned herein or options with respect thereto. Any recommendation contained in this report may not be suitable for all investors and it is not to be deemed an offer or solicitation on our part with respect to the purchase or sale of any securities. |
|
 |
Retail. Tech, Financial, and Commodity-Linked Groups Fell
Kenneth J. Gruneisen - Passed the CAN SLIM® Master's Exam
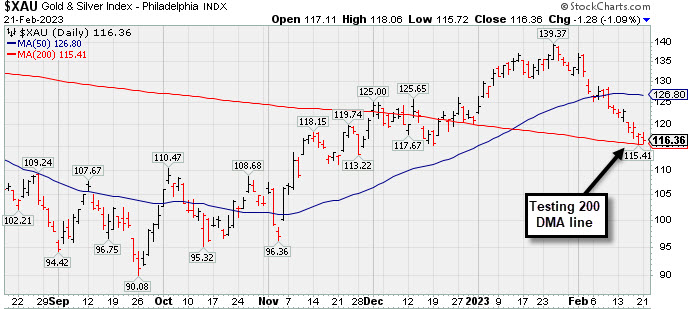
Solid losses for the Retail Index ($RLX -3.47%), Bank Index ($BKX -2.67%), and Broker/Dealer Index ($XBD -1.42%) weighed on the major averages. The tech sector had a negative bias as the Semiconductor Index ($SOX -3.31%), Networking Index ($NWX -2.35%), and Biotech Index ($BTK -2.78%) each suffered large losses. Commodity-linked groups rounded out the negative session as the Gold & Silver Index ($XAU -1.09%) and Oil Services Index ($OSX -1.46%) both lost ground while the Integrated Oil Index ($XOI +0.02%) finished flat.
PICTURED: The Gold & Silver Index ($XAU -1.09%) is consolidating just above its 200-day moving average (DMA) line.
| Oil Services |
$OSX |
86.11 |
-1.28 |
-1.46% |
+2.68% |
| Integrated Oil |
$XOI |
1,743.51 |
+0.30 |
+0.02% |
-2.45% |
| Semiconductor |
$SOX |
2,906.26 |
-99.60 |
-3.31% |
+14.78% |
| Networking |
$NWX |
808.49 |
-19.48 |
-2.35% |
+3.22% |
| Broker/Dealer |
$XBD |
495.43 |
-7.13 |
-1.42% |
+10.31% |
| Retail |
$RLX |
2,898.89 |
-104.08 |
-3.47% |
+5.26% |
| Gold & Silver |
$XAU |
116.36 |
-1.28 |
-1.09% |
-3.72% |
| Bank |
$BKX |
108.87 |
-2.99 |
-2.67% |
+7.95% |
| Biotech |
$BTK |
5,372.63 |
-153.72 |
-2.78% |
+1.73% |
|
|
|
 |
Powered Higher After Recently Highlighted in Feb 10th Report
Kenneth J. Gruneisen - Passed the CAN SLIM® Master's Exam
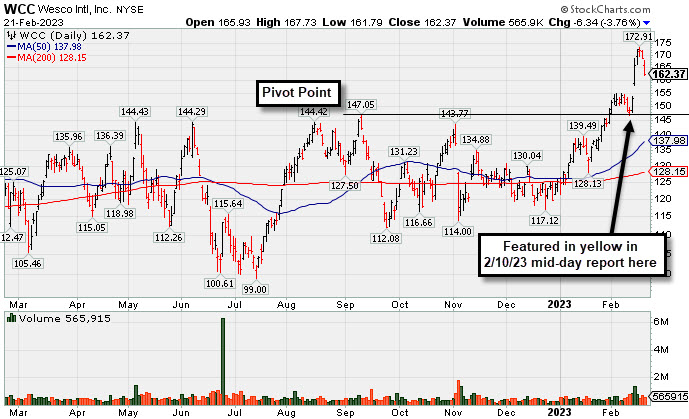
Wesco International Inc (WCC -$6.34 or -3.76% to $162.37) recently rallied above its "max buy" level with volume-driven gains and its color code was changed to green. Prior highs in the $144-147 area define initial support to watch. Fundamentals remain strong as it recently reported Dec '22 quarterly earnings +40% on +15% sales revenues versus the year ago period. Its Earnings Per Share Rating is 97, well above the 80+ minimum for buy candidates.
The Electronic - Parts firm was highlighted in yellow in the 2/10/23 mid-day report (read here) while consolidating after recent volume-driven gains triggered a technical buy signal, a reassuring sign of fresh institutional buying demand which could lead to a meaningful price advance. It was last shown in this FSU section on 6/01/22 with an annotated graph under the headline, "Big Volume-Driven Gain Helped Technical Stance Improve".
There is a small supply of only 50.7 million shares outstanding (S criteria) which can contribute to greater price volatility in the event of institutional buying or selling. The number of top-rated funds owning its shares rose from 489 in Jun '21 to 622 in Dec '22, a reassuring sign concerning the I criteria. Its current Up/Down Volume Ratio of 1.4 is an unbiased indication of slightly distributional action over the past 50 days.
|
|
|
Color Codes Explained :
Y - Better candidates highlighted by our
staff of experts.
G - Previously featured
in past reports as yellow but may no longer be buyable under the
guidelines.
***Last / Change / Volume data in this table is the closing quote data***
Symbol/Exchange
Company Name
Industry Group |
PRICE |
CHANGE
(%Change) |
Day High |
Volume
(% DAV)
(% 50 day avg vol) |
52 Wk Hi
% From Hi |
Featured
Date |
Price
Featured |
Pivot Featured |
|
Max Buy |
 CMC
-
NYSE
CMC
-
NYSE
Commercial Metals Co
METALS and MINING - Steel and Iron
|
$55.56
|
-1.52
-2.66% |
$57.33
|
881,968
80.03% of 50 DAV
50 DAV is 1,102,000
|
$58.09
-4.36%
|
10/14/2022
|
$41.61
|
PP = $44.45
|
|
MB = $46.67
|
 Most Recent Note - 2/21/2023 9:59:05 AM
G -Stubbornly holding its ground in recent weeks near its all-time high, extended from any sound base. Its 50 DMA line ($52.46) defines important near-term support to watch on pullbacks. Fundamentals remain strong.
>>> FEATURED STOCK ARTICLE : Metals Firm Extended From Base and Perched Near High - 2/6/2023 |
View all notes |
Set NEW NOTE alert |
Company Profile |
SEC
News |
Chart |
Request a new note
C
A
S
I |
GPK
-
NYSE
Graphic Packaging Hldg
CONSUMER NON-DURABLES - Packaging and Containers
|
$23.09
|
-0.43
-1.83% |
$23.47
|
3,118,087
94.91% of 50 DAV
50 DAV is 3,285,200
|
$24.20
-4.59%
|
10/25/2022
|
$22.75
|
PP = $24.17
|
|
MB = $25.38
|
Most Recent Note - 2/21/2023 10:04:37 AM
Y - Quietly perched only -4.3% off its all-time high. Showed resilience after briefly violating its 50 DMA line on 2/07/23. Members were reminded - "Disciplined investors know that gains above a stock's pivot point must be backed by at least +40% above average volume to trigger a proper technical buy signal."
>>> FEATURED STOCK ARTICLE : Graphic Packaging Perched Near Pivot Point - 1/27/2023 |
View all notes |
Set NEW NOTE alert |
Company Profile |
SEC
News |
Chart |
Request a new note
C
A
S
I |
GFF
-
NYSE
Griffon Corporation
MATERIALS and CONSTRUCTION - General Building Materials
|
$37.09
|
-2.14
-5.46% |
$39.06
|
456,937
89.25% of 50 DAV
50 DAV is 512,000
|
$43.74
-15.20%
|
11/10/2022
|
$34.13
|
PP = $35.02
|
|
MB = $36.77
|
Most Recent Note - 2/21/2023 10:02:18 AM
G - Pulling back near its "max buy" level and today's early loss was nearly testing its 50 DMA line ($38) which defines important support to watch. Reported Dec '22 quarterly earnings +121 on +10% sales revenues versus the year ago period.
>>> FEATURED STOCK ARTICLE : Extended From Any Sound Base and Still Hitting New Highs - 2/2/2023 |
View all notes |
Set NEW NOTE alert |
Company Profile |
SEC
News |
Chart |
Request a new note
C
A
S
I |
TITN
-
NASDAQ
Titan Machinery Inc
SPECIALTY RETAIL
|
$43.95
|
-0.80
-1.79% |
$44.34
|
238,919
113.23% of 50 DAV
50 DAV is 211,000
|
$46.40
-5.28%
|
1/13/2023
|
$40.10
|
PP = $44.45
|
|
MB = $46.67
|
Most Recent Note - 2/21/2023 10:14:00 AM
Y - Still sputtering near its pivot point. Its 50 DMA line ($41.60) definies important near-term support to watch. It wedged into new high territory with gains lacking great volume conviction since a new pivot point was recently cited based on its 12/01/22 high plus 10 cents.
>>> FEATURED STOCK ARTICLE : 7th Consecutive Gain for Titan - 1/30/2023 |
View all notes |
Set NEW NOTE alert |
Company Profile |
SEC
News |
Chart |
Request a new note
C
A
S
I |
MYE
-
NYSE
Myers Industries Inc
Containers/Packaging
|
$24.12
|
-0.55
-2.23% |
$24.52
|
135,286
84.03% of 50 DAV
50 DAV is 161,000
|
$25.55
-5.60%
|
12/8/2022
|
$23.94
|
PP = $25.65
|
|
MB = $26.93
|
Most Recent Note - 2/21/2023 10:06:16 AM
Y - Found prompt support near its 50 DMA line ($23.54) on recent pullbacks. It still faces very little resistance due to overhead supply up to the $25.50 level.
>>> FEATURED STOCK ARTICLE : Perched Near High After Finding Support at 50 DMA - 2/3/2023 |
View all notes |
Set NEW NOTE alert |
Company Profile |
SEC
News |
Chart |
Request a new note
C
A
S
I |
Symbol/Exchange
Company Name
Industry Group |
PRICE |
CHANGE
(%Change) |
Day High |
Volume
(% DAV)
(% 50 day avg vol) |
52 Wk Hi
% From Hi |
Featured
Date |
Price
Featured |
Pivot Featured |
|
Max Buy |
BOX
-
NYSE
Box Inc Cl A
Computer Sftwr-Database
|
$33.53
|
+0.79
2.41% |
$33.59
|
1,502,061
107.98% of 50 DAV
50 DAV is 1,391,000
|
$34.98
-4.15%
|
2/2/2023
|
$34.68
|
PP = $33.14
|
|
MB = $34.80
|
Most Recent Note - 2/21/2023 9:57:17 AM
Y - Consolidating above prior highs and its 50 DMA line which coincide in the $32 area defining important near term support to watch.
>>> FEATURED STOCK ARTICLE : Perched Near High After Recent Breakout - 2/7/2023 |
View all notes |
Set NEW NOTE alert |
Company Profile |
SEC
News |
Chart |
Request a new note
C
A
S
I |
STRL
-
NASDAQ
Sterling Infrastructure
MATERIALS and; CONSTRUCTION - Heavy Construction
|
$35.99
|
-2.31
-6.03% |
$38.17
|
311,589
125.14% of 50 DAV
50 DAV is 249,000
|
$38.43
-6.35%
|
12/14/2022
|
$32.41
|
PP = $33.72
|
|
MB = $35.41
|
Most Recent Note - 2/21/2023 10:12:00 AM
G - Perched at its all-time high and stubbornly holding its ground. Prior highs in the $34-33 area and its 50 DMA line ($33.63) define important near-term support to watch.
>>> FEATURED STOCK ARTICLE : Gain With Average Volume While Perched Near Recent Highs - 1/26/2023 |
View all notes |
Set NEW NOTE alert |
Company Profile |
SEC
News |
Chart |
Request a new note
C
A
S
I |
PERI
-
NASDAQ
Perion Networks Ltd
Comml Svcs-Advertising
|
$33.10
|
-0.18
-0.54% |
$33.25
|
571,838
90.91% of 50 DAV
50 DAV is 629,000
|
$35.16
-5.86%
|
1/25/2023
|
$31.79
|
PP = $33.19
|
|
MB = $34.85
|
Most Recent Note - 2/21/2023 10:09:46 AM
Y - Hovering near its 52-week high and showing resiience after undercutting its pivot point. The next important suppport to watch is its 50 DMA line ($29.36).
>>> FEATURED STOCK ARTICLE : Spurt of Volume-Driven Gains Challenging Prior High - 1/25/2023 |
View all notes |
Set NEW NOTE alert |
Company Profile |
SEC
News |
Chart |
Request a new note
C
A
S
I |
ALGM
-
NASDAQ
Allegro Microsystems Inc
Elec-Semiconductor Mfg
|
$42.88
|
-1.62
-3.64% |
$44.58
|
1,601,599
98.68% of 50 DAV
50 DAV is 1,623,000
|
$45.99
-6.76%
|
1/31/2023
|
$37.80
|
PP = $38.38
|
|
MB = $40.30
|
Most Recent Note - 2/21/2023 9:55:27 AM
G - Holding its ground stubbornly after rising above its "max buy" level. Prior high in the $38 area defines initial support to watch on pullbacks.
>>> FEATURED STOCK ARTICLE : Big Volume-Driven Gain for Best-Ever Close - 1/31/2023 |
View all notes |
Set NEW NOTE alert |
Company Profile |
SEC
News |
Chart |
Request a new note
C
A
S
I |
WCC
-
NYSE
Wesco International Inc
WHOLESALE - Electronics Wholesale
|
$162.37
|
-6.34
-3.76% |
$167.73
|
565,915
125.48% of 50 DAV
50 DAV is 451,000
|
$172.91
-6.10%
|
2/10/2023
|
$148.50
|
PP = $147.15
|
|
MB = $154.51
|
Most Recent Note - 2/21/2023 7:01:16 PM
G - Color code was changed to green after rallying above its "max buy" level. Prior highs in the $144-147 area define initial support to watch. Reported Dec '22 quarterly earnings +40% on +15% sales revenues versus the year ago period. See the latest FSU analysis for more details and a new annotated graph.
>>> FEATURED STOCK ARTICLE : Powered Higher After Recently Highlighted in Feb 10th Report - 2/21/2023 |
View all notes |
Set NEW NOTE alert |
Company Profile |
SEC
News |
Chart |
Request a new note
C
A
S
I |
Symbol/Exchange
Company Name
Industry Group |
PRICE |
CHANGE
(%Change) |
Day High |
Volume
(% DAV)
(% 50 day avg vol) |
52 Wk Hi
% From Hi |
Featured
Date |
Price
Featured |
Pivot Featured |
|
Max Buy |
|
|
|
THESE ARE NOT BUY RECOMMENDATIONS!
Comments contained in the body of this report are technical
opinions only. The material herein has been obtained
from sources believed to be reliable and accurate, however,
its accuracy and completeness cannot be guaranteed.
This site is not an investment advisor, hence it does
not endorse or recommend any securities or other investments.
Any recommendation contained in this report may not
be suitable for all investors and it is not to be deemed
an offer or solicitation on our part with respect to
the purchase or sale of any securities. All trademarks,
service marks and trade names appearing in this report
are the property of their respective owners, and are
likewise used for identification purposes only.
This report is a service available
only to active Paid Premium Members.
You may opt-out of receiving report notifications
at any time. Questions or comments may be submitted
by writing to Premium Membership Services 665 S.E. 10 Street, Suite 201 Deerfield Beach, FL 33441-5634 or by calling 1-800-965-8307
or 954-785-1121.
|
|
|