You are not logged in.
This means you
CAN ONLY VIEW reports that were published prior to Tuesday, April 8, 2025.
You
MUST UPGRADE YOUR MEMBERSHIP if you want to see any current reports.
AFTER MARKET UPDATE - FRIDAY, FEBRUARY 10TH, 2023
Previous After Market Report Next After Market Report >>>
|
|
|
|
DOW |
+169.39 |
33,869.27 |
+0.50% |
|
Volume |
860,242,691 |
-4% |
|
Volume |
4,837,903,200 |
-12% |
|
NASDAQ |
-71.46 |
11,718.12 |
-0.61% |
|
Advancers |
1,550 |
52% |
|
Advancers |
1,948 |
43% |
|
S&P 500 |
+8.96 |
4,090.46 |
+0.22% |
|
Decliners |
1,411 |
48% |
|
Decliners |
2,549 |
57% |
|
Russell 2000 |
+3.47 |
1,918.81 |
+0.18% |
|
52 Wk Highs |
42 |
|
|
52 Wk Highs |
62 |
|
|
S&P 600 |
+3.08 |
1,265.51 |
+0.24% |
|
52 Wk Lows |
15 |
|
|
52 Wk Lows |
82 |
|
|
 |
Major Indices Ended Mixed on Friday and Lower for the Week
Kenneth J. Gruneisen - Passed the CAN SLIM® Master's Exam
The Dow added 169 points, while the Nasdaq Composite shed 0.6%. The S&P 500 climbed 0.2%. For the week, the major averages finished lower as concerns over the global economic outlook weighed on investors. Volume totals on Friday were lighter than the prior session on the NYSE and on the Nasdaq exchange. Advancers led decliners by a narrow margin on the NYSE while decliners led advancers by a 5-4 margin on the Nasdaq exchange. Leadership thinned as there were 17 high-ranked companies from the Leaders List that hit new 52-week highs and were listed on the BreakOuts Page versus the total of 37 on the prior session. New 52-week highs totals outnumbered new 52-week lows totals on both the NYSE and the Nasdaq exchange. The major indices are in a confirmed uptrend (M criteria). Disciplined investors have a green light for making new buys only in stocks matching all key criteria of the fact-based investment system.
PICTURED: The Nasdaq Composite Index pulled back with lighter volume for a 5th loss in the span of 6 sessions. It is consolidating above its 200-day and 50-day moving average lines.
U.S. equities finished mixed on Friday as investors assessed the Federal Reserve’s (Fed) future course of monetary policy and looked ahead to next week’s economic data. Throughout the week, central bank officials reaffirmed their commitment to bringing inflation down and signaled they may need to raise interest rates higher than forecasted amid signs of a still-hot labor market. Eight of 11 sectors finished in positive territory.
On the data front, a preliminary reading from the University of Michigan Consumer Sentiment Index came in at 66.4 for February, its highest level in a year. Meanwhile, the short-term inflation expectations component of the report ticked upwards to 4.2% while long-term expectations remained unchanged at 2.9%. Treasuries weakened, with the yield on the benchmark 10-year note up seven basis points (0.07%) to 3.74%, while the 30-year bond yield climbed nine basis points (0.09%) to 3.82%. The yield on the two-year note, which is more sensitive to changes in Fed policy, advanced three basis points (0.03%) to 4.52%. In commodities, West Texas Intermediate (WTI) crude climbed 2.2% to $79.80/barrel following reports Russia will cut oil production by 500,000 barrels per day, a move which comes after Western sanctions on Russian crude products. For the week, the domestic benchmark climbed 8.8%.
|
 Kenneth J. Gruneisen started out as a licensed stockbroker in August 1987, a couple of months prior to the historic stock market crash that took the Dow Jones Industrial Average down -22.6% in a single day. He has published daily fact-based fundamental and technical analysis on high-ranked stocks online for two decades. Through FACTBASEDINVESTING.COM, Kenneth provides educational articles, news, market commentary, and other information regarding proven investment systems that work in good times and bad.
Comments contained in the body of this report are technical opinions only and are not necessarily those of Gruneisen Growth Corp. The material herein has been obtained from sources believed to be reliable and accurate, however, its accuracy and completeness cannot be guaranteed. Our firm, employees, and customers may effect transactions, including transactions contrary to any recommendation herein, or have positions in the securities mentioned herein or options with respect thereto. Any recommendation contained in this report may not be suitable for all investors and it is not to be deemed an offer or solicitation on our part with respect to the purchase or sale of any securities. |
|
 |
Energy-Linked Groups Post Standout Gains and Broker/Dealer Index Rose
Kenneth J. Gruneisen - Passed the CAN SLIM® Master's Exam
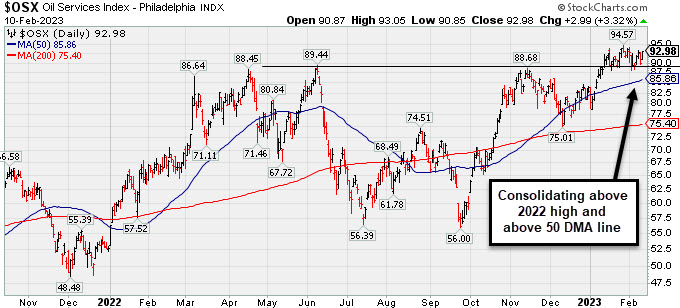
The Broker/Dealer Index ($XBD +0.77%) posted a modest gain on Friday while the Retail Index ($RLX -0.32%) and Bank Index ($BKX -0.12%) each ended slightly in the red. The Semiconductor Index ($SOX -1.58%) led the tech sector lower while the Biotech Index ($BTK -0.54%) and Networking Index ($NWX -0.18%) both suffered smaller losses.Commodity-linked groups were mixed as the Oil Services Index ($OSX +3.32%) and Integrated Oil Index ($XOI +4.45%) both posted standout gains whiel the Gold & Silver Index ($XAU -0.56%) ended slightly in the red.
PICTURED: The Oil Services Index ($OSX +3.32%) is consolidating above its 2022 high and above its 50-day moving average (DMA) line.
| Oil Services |
$OSX |
92.98 |
+2.99 |
+3.32% |
+10.87% |
| Integrated Oil |
$XOI |
1,873.80 |
+79.87 |
+4.45% |
+4.84% |
| Semiconductor |
$SOX |
3,011.15 |
-48.47 |
-1.58% |
+18.92% |
| Networking |
$NWX |
814.95 |
-1.44 |
-0.18% |
+4.04% |
| Broker/Dealer |
$XBD |
496.92 |
+3.82 |
+0.77% |
+10.64% |
| Retail |
$RLX |
2,989.10 |
-9.58 |
-0.32% |
+8.54% |
| Gold & Silver |
$XAU |
123.44 |
-0.69 |
-0.56% |
+2.13% |
| Bank |
$BKX |
112.42 |
-0.13 |
-0.12% |
+11.47% |
| Biotech |
$BTK |
5,453.97 |
-29.88 |
-0.54% |
+3.27% |
|
|
|
 |
Featured Stocks
Kenneth J. Gruneisen - Passed the CAN SLIM® Master's Exam
|
|
|
Color Codes Explained :
Y - Better candidates highlighted by our
staff of experts.
G - Previously featured
in past reports as yellow but may no longer be buyable under the
guidelines.
***Last / Change / Volume data in this table is the closing quote data***
Symbol/Exchange
Company Name
Industry Group |
PRICE |
CHANGE
(%Change) |
Day High |
Volume
(% DAV)
(% 50 day avg vol) |
52 Wk Hi
% From Hi |
Featured
Date |
Price
Featured |
Pivot Featured |
|
Max Buy |
 CMC
-
NYSE
CMC
-
NYSE
Commercial Metals Co
METALS and MINING - Steel and Iron
|
$55.76
|
+0.77
1.40% |
$56.41
|
1,160,098
106.43% of 50 DAV
50 DAV is 1,090,000
|
$58.09
-4.01%
|
10/14/2022
|
$41.61
|
PP = $44.45
|
|
MB = $46.67
|
 Most Recent Note - 2/10/2023 5:25:10 PM
G - Posted a gain today with higher (average) volume and it remains extended from any sound base. Its 50 DMA line ($51.55) defines important near-term support to watch on pullbacks. Fundamentals remain strong.
>>> FEATURED STOCK ARTICLE : Metals Firm Extended From Base and Perched Near High - 2/6/2023 |
View all notes |
Set NEW NOTE alert |
Company Profile |
SEC
News |
Chart |
Request a new note
C
A
S
I |
GPK
-
NYSE
Graphic Packaging Hldg
CONSUMER NON-DURABLES - Packaging and Containers
|
$23.51
|
+0.31
1.34% |
$23.57
|
2,929,699
88.72% of 50 DAV
50 DAV is 3,302,000
|
$24.20
-2.85%
|
10/25/2022
|
$22.75
|
PP = $24.17
|
|
MB = $25.38
|
Most Recent Note - 2/10/2023 5:23:34 PM
Y - Posted a 3rd consecutive gain today and closed only -2.9% offf its all-time high, showing resilience after briefly violating its 50 DMA line. After challenging its pivot point last week members were again reminded - "Disciplined investors know that gains above a stock's pivot point must be backed by at least +40% above average volume to trigger a proper technical buy signal."
>>> FEATURED STOCK ARTICLE : Graphic Packaging Perched Near Pivot Point - 1/27/2023 |
View all notes |
Set NEW NOTE alert |
Company Profile |
SEC
News |
Chart |
Request a new note
C
A
S
I |
GFF
-
NYSE
Griffon Corporation
MATERIALS and CONSTRUCTION - General Building Materials
|
$39.59
|
+0.56
1.43% |
$39.81
|
364,423
71.46% of 50 DAV
50 DAV is 510,000
|
$43.74
-9.49%
|
11/10/2022
|
$34.13
|
PP = $35.02
|
|
MB = $36.77
|
Most Recent Note - 2/9/2023 4:57:43 PM
G - Pulled back from its 52-week high with today's 4th consecutive loss backed by average volume, It is extended from any sound base. Its 50 DMA line ($37.39) defines near-term support to watch. Reported Dec '22 quarterly earnings +121 on +10% sales revenues versus the year ago period.
>>> FEATURED STOCK ARTICLE : Extended From Any Sound Base and Still Hitting New Highs - 2/2/2023 |
View all notes |
Set NEW NOTE alert |
Company Profile |
SEC
News |
Chart |
Request a new note
C
A
S
I |
TITN
-
NASDAQ
Titan Machinery Inc
SPECIALTY RETAIL
|
$43.09
|
-0.28
-0.65% |
$43.29
|
132,109
50.42% of 50 DAV
50 DAV is 262,000
|
$46.40
-7.13%
|
1/13/2023
|
$40.10
|
PP = $44.45
|
|
MB = $46.67
|
Most Recent Note - 2/10/2023 5:19:18 PM
Y - Pulled back today for a 5th consecutive loss with below average volume, sputtering below the pivot point. Its 50 DMA line ($41.34) definies important near-term support to watch on pullbacks. It wedged into new high territory with gains lacking great volume conviction since a new pivot point was recently cited based on its 12/01/22 high plus 10 cents.
>>> FEATURED STOCK ARTICLE : 7th Consecutive Gain for Titan - 1/30/2023 |
View all notes |
Set NEW NOTE alert |
Company Profile |
SEC
News |
Chart |
Request a new note
C
A
S
I |
MYE
-
NYSE
Myers Industries Inc
Containers/Packaging
|
$23.51
|
+0.14
0.60% |
$23.57
|
87,060
52.76% of 50 DAV
50 DAV is 165,000
|
$25.55
-7.98%
|
12/8/2022
|
$23.94
|
PP = $25.65
|
|
MB = $26.93
|
Most Recent Note - 2/8/2023 5:52:32 PM
Y - Pulled back toward its 50 DMA line with today's loss on light volume after 4 consecutive gains. Found support while testing its 50 DMA line ($23.38) in recent weeks. Faces little resistance due to overhead supply up to the $25.50 level.
>>> FEATURED STOCK ARTICLE : Perched Near High After Finding Support at 50 DMA - 2/3/2023 |
View all notes |
Set NEW NOTE alert |
Company Profile |
SEC
News |
Chart |
Request a new note
C
A
S
I |
Symbol/Exchange
Company Name
Industry Group |
PRICE |
CHANGE
(%Change) |
Day High |
Volume
(% DAV)
(% 50 day avg vol) |
52 Wk Hi
% From Hi |
Featured
Date |
Price
Featured |
Pivot Featured |
|
Max Buy |
BOX
-
NYSE
Box Inc Cl A
Computer Sftwr-Database
|
$33.75
|
-0.46
-1.34% |
$34.12
|
761,574
53.33% of 50 DAV
50 DAV is 1,428,000
|
$34.98
-3.52%
|
2/2/2023
|
$34.68
|
PP = $33.14
|
|
MB = $34.80
|
Most Recent Note - 2/10/2023 5:21:06 PM
Y - Pulled back today on below average volume for a small loss. On 2/02/23 it broke out above a new pivot point cited based on its 4/20/22 high plus 10 cents. Prior highs in the $31 area define initial support to watch on pulllbacks.
>>> FEATURED STOCK ARTICLE : Perched Near High After Recent Breakout - 2/7/2023 |
View all notes |
Set NEW NOTE alert |
Company Profile |
SEC
News |
Chart |
Request a new note
C
A
S
I |
STRL
-
NASDAQ
Sterling Infrastructure
MATERIALS and; CONSTRUCTION - Heavy Construction
|
$36.16
|
+0.24
0.67% |
$36.84
|
222,226
90.34% of 50 DAV
50 DAV is 246,000
|
$37.78
-4.29%
|
12/14/2022
|
$32.41
|
PP = $33.72
|
|
MB = $35.41
|
Most Recent Note - 2/9/2023 4:53:58 PM
G - There was a "negative reversal" today for a loss on higher volume after touching a new all-time high, Prior highs in the $34-33 area define initial support to watch above its 50 DMA line ($33.10).
>>> FEATURED STOCK ARTICLE : Gain With Average Volume While Perched Near Recent Highs - 1/26/2023 |
View all notes |
Set NEW NOTE alert |
Company Profile |
SEC
News |
Chart |
Request a new note
C
A
S
I |
PERI
-
NASDAQ
Perion Networks Ltd
Comml Svcs-Advertising
|
$31.70
|
+0.63
2.03% |
$31.73
|
954,459
166.57% of 50 DAV
50 DAV is 573,000
|
$35.16
-9.84%
|
1/25/2023
|
$31.79
|
PP = $33.19
|
|
MB = $34.85
|
Most Recent Note - 2/10/2023 12:48:18 PM
Y - Halted its slide following 4 consecutive losses marked by above average volume. Color code was changed to yellow after slumping back below its "max buy" level, but it has also slumped below the prior high ($33) raising concerns. The next important suppport to watch is its 50 DMA line ($28.59).
>>> FEATURED STOCK ARTICLE : Spurt of Volume-Driven Gains Challenging Prior High - 1/25/2023 |
View all notes |
Set NEW NOTE alert |
Company Profile |
SEC
News |
Chart |
Request a new note
C
A
S
I |
ALGM
-
NASDAQ
Allegro Microsystems Inc
Elec-Semiconductor Mfg
|
$42.73
|
+0.03
0.07% |
$43.19
|
1,226,789
75.49% of 50 DAV
50 DAV is 1,625,000
|
$44.10
-3.11%
|
1/31/2023
|
$37.80
|
PP = $38.38
|
|
MB = $40.30
|
Most Recent Note - 2/7/2023 5:51:24 PM
G - Hit yet another new high with today's gain. Last week it posted 3 consecutive volume-driven gains and its color code was changed to green after rising above its "max buy" level. Prior high in the $38 area defines initial support to watch on pullbacks.
>>> FEATURED STOCK ARTICLE : Big Volume-Driven Gain for Best-Ever Close - 1/31/2023 |
View all notes |
Set NEW NOTE alert |
Company Profile |
SEC
News |
Chart |
Request a new note
C
A
S
I |
WCC
-
NYSE
Wesco International Inc
WHOLESALE - Electronics Wholesale
|
$148.78
|
-0.08
-0.05% |
$149.67
|
740,327
186.01% of 50 DAV
50 DAV is 398,000
|
$155.00
-4.01%
|
2/10/2023
|
$148.50
|
PP = $147.15
|
|
MB = $154.51
|
Most Recent Note - 2/10/2023 1:06:02 PM
Y - Color code is changed to yellow while consolidating this week. Recently rallied above prior highs with volume-driven gains triggering a technical buy signal. Prior highs in the $144-147 area define initial support to watch. Due to report Dec '22 quarterly results. Volume and volatility often increase near earnings news. Reported Sep '22 quarterly earnings +64% on +15% sales revenues versus the year ago period, continuing its strong earnings track record. Pulling back this week after recently rallying to a new all-time high above resistance in the $144 area.
>>> FEATURED STOCK ARTICLE : Big Volume-Driven Gain Helped Technical Stance Improve - 6/1/2022 |
View all notes |
Set NEW NOTE alert |
Company Profile |
SEC
News |
Chart |
Request a new note
C
A
S
I |
Symbol/Exchange
Company Name
Industry Group |
PRICE |
CHANGE
(%Change) |
Day High |
Volume
(% DAV)
(% 50 day avg vol) |
52 Wk Hi
% From Hi |
Featured
Date |
Price
Featured |
Pivot Featured |
|
Max Buy |
|
|
|
THESE ARE NOT BUY RECOMMENDATIONS!
Comments contained in the body of this report are technical
opinions only. The material herein has been obtained
from sources believed to be reliable and accurate, however,
its accuracy and completeness cannot be guaranteed.
This site is not an investment advisor, hence it does
not endorse or recommend any securities or other investments.
Any recommendation contained in this report may not
be suitable for all investors and it is not to be deemed
an offer or solicitation on our part with respect to
the purchase or sale of any securities. All trademarks,
service marks and trade names appearing in this report
are the property of their respective owners, and are
likewise used for identification purposes only.
This report is a service available
only to active Paid Premium Members.
You may opt-out of receiving report notifications
at any time. Questions or comments may be submitted
by writing to Premium Membership Services 665 S.E. 10 Street, Suite 201 Deerfield Beach, FL 33441-5634 or by calling 1-800-965-8307
or 954-785-1121.
|
|
|