You are not logged in.
This means you
CAN ONLY VIEW reports that were published prior to Sunday, April 6, 2025.
You
MUST UPGRADE YOUR MEMBERSHIP if you want to see any current reports.
AFTER MARKET UPDATE - TUESDAY, FEBRUARY 7TH, 2023
Previous After Market Report Next After Market Report >>>
|
|
|
|
DOW |
+265.67 |
34,156.69 |
+0.78% |
|
Volume |
911,436,937 |
+7% |
|
Volume |
5,687,202,800 |
+3% |
|
NASDAQ |
+226.34 |
12,113.79 |
+1.90% |
|
Advancers |
1,843 |
63% |
|
Advancers |
2,600 |
58% |
|
S&P 500 |
+52.92 |
4,164.00 |
+1.29% |
|
Decliners |
1,093 |
37% |
|
Decliners |
1,871 |
42% |
|
Russell 2000 |
+14.89 |
1,972.61 |
+0.76% |
|
52 Wk Highs |
85 |
|
|
52 Wk Highs |
104 |
|
|
S&P 600 |
+8.90 |
1,298.53 |
+0.69% |
|
52 Wk Lows |
8 |
|
|
52 Wk Lows |
43 |
|
|
 |
Breadth Positive as Major Averages Rose
Kenneth J. Gruneisen - Passed the CAN SLIM® Master's Exam
The Dow added 265 points, while the Nasdaq Composite gained 1.9%. The S&P 500 increased 1.3% with eight of 11 sectors finishing in positive territory. Volume totals were higher than the prior session on the NYSE and on the Nasdaq exchange. Breadth was positive as advancers led decliners by more than a 3-2 margin on the NYSE and by a 5-4 margin the Nasdaq exchange. There were 35 high-ranked companies from the Leaders List that hit new 52-week highs and were listed on the BreakOuts Page versus the total of 28 on the prior session. New 52-week highs totals expanded and solidly outnumbered new 52-week lows totals on both the NYSE and the Nasdaq exchange. The major indices are in a confirmed uptrend (M criteria). Disciplined investors have a green light for making new buys only in stocks matching all key criteria of the fact-based investment system.
PICTURED: The Nasdaq Composite Index posted a gain. It has recently made progress above its 50-day and 200-day moving average lines.
U.S. equities finished higher Tuesday following Federal Reserve (Fed) Chair Jerome Powell’s press conference in Washington. Powell cautioned investors that surprisingly strong economic data could push the Fed to increase interest rates even higher, following last week’s stronger-than-forecasted jobs report. However, Powell did not drastically change his tone from last week’s post rate decision speech. He remained relatively hawkish stating the central bank still has a long road ahead of them to bring inflation down to the 2% target but acknowledged inflation has recently eased.
On the data front, December’s consumer credit came in weaker-than-expected at $11.57 billion, down from November’s upwardly revised $33.12 billion print. In corporate news, Zoom Video Communications Inc (ZM +9.85%) rose after announcing its plans to lay off 15% of its workforce, about 1,300 employees. Royal Caribbean Cruises Ltd (RCL +7.12%) rose after its fourth-quarter revenue narrowly missed estimates but the company gave investors a positive guidance on its 2023 per-share earnings estimates.
Treasuries were mixed, with the yield on the 10-year note up four basis points (0.04%) to 3.68%, while the 30-year bond yield increased four basis points (0.04%) to 3.71%. The yield on the two-year note dropped one basis point (0.01%) to 4.47%. In commodities, West Texas Intermediate (WTI) crude increased 4.4% to $77.34/barrel after Powell eased market concerns regarding future rate hikes. Meanwhile, the Turkish crude oil export terminal in Ceyhan has paused its operations following the earthquake that shook eastern Turkey earlier in the week. |
 Kenneth J. Gruneisen started out as a licensed stockbroker in August 1987, a couple of months prior to the historic stock market crash that took the Dow Jones Industrial Average down -22.6% in a single day. He has published daily fact-based fundamental and technical analysis on high-ranked stocks online for two decades. Through FACTBASEDINVESTING.COM, Kenneth provides educational articles, news, market commentary, and other information regarding proven investment systems that work in good times and bad.
Comments contained in the body of this report are technical opinions only and are not necessarily those of Gruneisen Growth Corp. The material herein has been obtained from sources believed to be reliable and accurate, however, its accuracy and completeness cannot be guaranteed. Our firm, employees, and customers may effect transactions, including transactions contrary to any recommendation herein, or have positions in the securities mentioned herein or options with respect thereto. Any recommendation contained in this report may not be suitable for all investors and it is not to be deemed an offer or solicitation on our part with respect to the purchase or sale of any securities. |
|
 |
Commodity-Linked Groups Led Financial and Tech Indexes Higher
Kenneth J. Gruneisen - Passed the CAN SLIM® Master's Exam
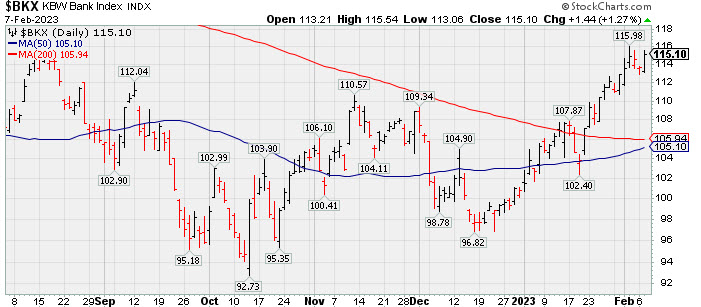
Gains from the Bank Index ($BKX +1.27%) and Broker/Dealer Index ($XBD +0.87%) helped underpin then major indices' gains on Tuesday but the Retail Index ($RLX -0.33%) created a drag as it edged lower. The Semiconductor Index ($SOX +3.12%) led the tech sector higher while the Networking Index ($NWX +0.92%) and Biotech Index ($BTK +0.89%) both posted smaller gains. Commodity-linked groups had a positive bias as the Oil Services Index ($OSX +2.78%) and Integrated Oil Index ($XOI +3.91%) both outpaced the Gold & Silver Index ($XAU +1.16%).
PICTURED: The Bank Index ($BKX +1.27%) has made steady progress from the December 2022 low.
| Oil Services |
$OSX |
91.79 |
+2.49 |
+2.78% |
+9.45% |
| Integrated Oil |
$XOI |
1,815.29 |
+68.29 |
+3.91% |
+1.57% |
| Semiconductor |
$SOX |
3,124.15 |
+94.40 |
+3.12% |
+23.38% |
| Networking |
$NWX |
830.72 |
+7.58 |
+0.92% |
+6.05% |
| Broker/Dealer |
$XBD |
498.57 |
+4.30 |
+0.87% |
+11.01% |
| Retail |
$RLX |
3,076.43 |
-10.20 |
-0.33% |
+11.71% |
| Gold & Silver |
$XAU |
127.66 |
+1.46 |
+1.16% |
+5.63% |
| Bank |
$BKX |
115.10 |
+1.44 |
+1.27% |
+14.13% |
| Biotech |
$BTK |
5,612.10 |
+49.28 |
+0.89% |
+6.27% |
|
|
|
 |
Perched Near High After Recent Breakout
Kenneth J. Gruneisen - Passed the CAN SLIM® Master's Exam
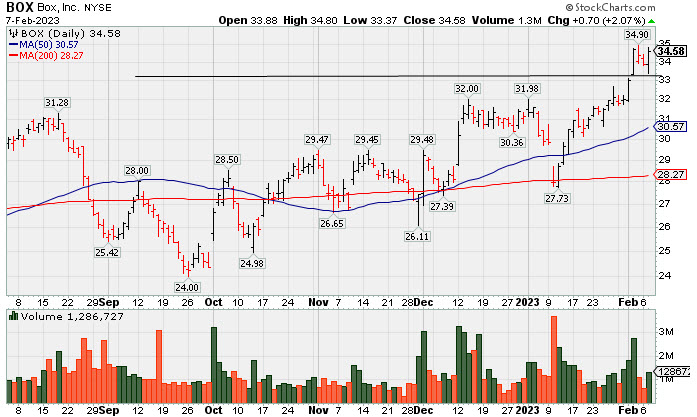
Box Inc Cl A (BOX +$0.70 or +2.07% to $34.58) remains perched near its high after volume-driven gains. On 2/02/23 it broke out above a new pivot point cited based on its 4/20/22 high plus 10 cents. Prior highs in the $31 area define initial support to watch on pullbacks.
BOX was highlighted in yellow with pivot point cited based on its 11/01/22 high plus 10 cents in the 12/12/22 mid-day report (read here). It was last shown in greater detail on 1/24/23 with an annotated graph under the headline, "Perched Above "Max Buy" Level Near Recent Highs".
BOX reported Oct '22 quarterly earnings +41% on +12% sales revenues over the year ago period, above the +25% minimum earnings guideline (C criteria) for the 3rd consecutive quarterly comparison. Quarterly and annual earnings increases have been strong and steady. It has a 97 Earnings Per Share Rating.
There are 142.9 million shares outstanding. The number of top-rated funds owning its shares rose from 468 in Dec '21 to 593 in Dec '22, a reassuring sign concerning the I criteria. Its current Up/Down Volume Ratio of 1.6 is an unbiased indication its shares have been under accumulation over the past 50 days.
|
|
|
Color Codes Explained :
Y - Better candidates highlighted by our
staff of experts.
G - Previously featured
in past reports as yellow but may no longer be buyable under the
guidelines.
***Last / Change / Volume data in this table is the closing quote data***
Symbol/Exchange
Company Name
Industry Group |
PRICE |
CHANGE
(%Change) |
Day High |
Volume
(% DAV)
(% 50 day avg vol) |
52 Wk Hi
% From Hi |
Featured
Date |
Price
Featured |
Pivot Featured |
|
Max Buy |
 CMC
-
NYSE
CMC
-
NYSE
Commercial Metals Co
METALS and MINING - Steel and Iron
|
$57.04
|
+1.10
1.97% |
$57.28
|
1,339,029
127.41% of 50 DAV
50 DAV is 1,051,000
|
$58.09
-1.81%
|
10/14/2022
|
$41.61
|
PP = $44.45
|
|
MB = $46.67
|
Most Recent Note - 2/6/2023 6:01:30 PM
G - Pulled back today following a streak of 4 consecutive gains to a new high. It is extended from any sound base. Its 50 DMA line ($50.91) defines important near-term support to watch on pullbacks. Fundamentals remain strong. See the latest FSU analysis for more details and a new annotated graph.
>>> FEATURED STOCK ARTICLE : Metals Firm Extended From Base and Perched Near High - 2/6/2023 |
View all notes |
Set NEW NOTE alert |
Company Profile |
SEC
News |
Chart |
Request a new note
C
A
S
I |
GPK
-
NYSE
Graphic Packaging Hldg
CONSUMER NON-DURABLES - Packaging and Containers
|
$22.14
|
-1.52
-6.42% |
$23.38
|
10,161,978
339.54% of 50 DAV
50 DAV is 2,992,900
|
$24.20
-8.51%
|
10/25/2022
|
$22.75
|
PP = $24.17
|
|
MB = $25.38
|
 Most Recent Note - 2/7/2023 1:27:45 PM
G - Gapped down today and its color code is changed to green after it abruptly slumped from near its 52-week high, violating its 50 DMA line and undercutting its 200 DMA line, raising concerns. After challenging its pivot point last week members were again reminded - "Disciplined investors know that gains above a stock's pivot point must be backed by at least +40% above average volume to trigger a proper technical buy signal."
>>> FEATURED STOCK ARTICLE : Graphic Packaging Perched Near Pivot Point - 1/27/2023 |
View all notes |
Set NEW NOTE alert |
Company Profile |
SEC
News |
Chart |
Request a new note
C
A
S
I |
GFF
-
NYSE
Griffon Corporation
MATERIALS and CONSTRUCTION - General Building Materials
|
$40.64
|
-0.24
-0.59% |
$40.98
|
537,547
107.29% of 50 DAV
50 DAV is 501,000
|
$43.74
-7.09%
|
11/10/2022
|
$34.13
|
PP = $35.02
|
|
MB = $36.77
|
Most Recent Note - 2/6/2023 6:03:29 PM
G - Pulled back from its 52-week high with today's loss on average volume following 4 consecutive gains backed by above average volume, It is extended from any sound base. Its 50 DMA line ($37.16) defines near-term support to watch on pullbacks. Reported Dec '22 quarterly earnings +121 on +10% sales revenues versus the year ago period.
>>> FEATURED STOCK ARTICLE : Extended From Any Sound Base and Still Hitting New Highs - 2/2/2023 |
View all notes |
Set NEW NOTE alert |
Company Profile |
SEC
News |
Chart |
Request a new note
C
A
S
I |
TITN
-
NASDAQ
Titan Machinery Inc
SPECIALTY RETAIL
|
$44.26
|
-0.11
-0.25% |
$44.49
|
163,007
62.45% of 50 DAV
50 DAV is 261,000
|
$46.40
-4.61%
|
1/13/2023
|
$40.10
|
PP = $44.45
|
|
MB = $46.67
|
Most Recent Note - 2/6/2023 6:06:07 PM
Y - Pulled back today following a streak of 11 consecutive gains. Its 50 DMA line ($40.62) definies important near-term support to watch on pullbacks. It wedged into new high territory with gains lacking great volume conviction since a new pivot point was recently cited based on its 12/01/22 high plus 10 cents.
>>> FEATURED STOCK ARTICLE : 7th Consecutive Gain for Titan - 1/30/2023 |
View all notes |
Set NEW NOTE alert |
Company Profile |
SEC
News |
Chart |
Request a new note
C
A
S
I |
MYE
-
NYSE
Myers Industries Inc
Containers/Packaging
|
$24.57
|
+0.05
0.20% |
$24.93
|
199,849
124.13% of 50 DAV
50 DAV is 161,000
|
$25.55
-3.84%
|
12/8/2022
|
$23.94
|
PP = $25.65
|
|
MB = $26.93
|
Most Recent Note - 2/3/2023 7:37:12 PM
Y - Posted a 2nd consecutive gain with average volume. Found support while testing its 50 DMA line ($23.27) in recent weeks. Faces little resistance due to overhead supply up to the $25.50 level. See the latest FSU analysis for more details and a new annotated graph.
>>> FEATURED STOCK ARTICLE : Perched Near High After Finding Support at 50 DMA - 2/3/2023 |
View all notes |
Set NEW NOTE alert |
Company Profile |
SEC
News |
Chart |
Request a new note
C
A
S
I |
Symbol/Exchange
Company Name
Industry Group |
PRICE |
CHANGE
(%Change) |
Day High |
Volume
(% DAV)
(% 50 day avg vol) |
52 Wk Hi
% From Hi |
Featured
Date |
Price
Featured |
Pivot Featured |
|
Max Buy |
BOX
-
NYSE
Box Inc Cl A
Computer Sftwr-Database
|
$34.58
|
+0.70
2.07% |
$34.80
|
1,286,737
91.26% of 50 DAV
50 DAV is 1,410,000
|
$34.90
-0.92%
|
2/2/2023
|
$34.68
|
PP = $33.14
|
|
MB = $34.80
|
Most Recent Note - 2/7/2023 5:52:56 PM
Y - Posted a gain today and it is near its "max buy" level. On 2/02/23 it broke out above a new pivot point cited based on its 4/20/22 high plus 10 cents. Prior highs in the $31 area define initial support to watch on pulllbacks. See the latest FSU analysis for more details and a new annotated graph.
>>> FEATURED STOCK ARTICLE : Perched Above "Max Buy" Level Near Recent Highs - 1/24/2023 |
View all notes |
Set NEW NOTE alert |
Company Profile |
SEC
News |
Chart |
Request a new note
C
A
S
I |
STRL
-
NASDAQ
Sterling Infrastructure
MATERIALS and; CONSTRUCTION - Heavy Construction
|
$37.18
|
+0.33
0.90% |
$37.56
|
311,708
131.52% of 50 DAV
50 DAV is 237,000
|
$37.00
0.49%
|
12/14/2022
|
$32.41
|
PP = $33.72
|
|
MB = $35.41
|
Most Recent Note - 2/3/2023 7:42:26 PM
G - Color code is changed to green after a gain above its "max buy" level backed by light volume. Prior highs in the $34-33 area define initial support to watch above its 50 DMA line ($32.73).
>>> FEATURED STOCK ARTICLE : Gain With Average Volume While Perched Near Recent Highs - 1/26/2023 |
View all notes |
Set NEW NOTE alert |
Company Profile |
SEC
News |
Chart |
Request a new note
C
A
S
I |
PERI
-
NASDAQ
Perion Networks Ltd
Comml Svcs-Advertising
|
$33.54
|
-0.20
-0.59% |
$33.68
|
736,687
146.17% of 50 DAV
50 DAV is 504,000
|
$35.16
-4.61%
|
1/25/2023
|
$31.79
|
PP = $33.19
|
|
MB = $34.85
|
Most Recent Note - 2/7/2023 5:55:03 PM
G - Pulled back today for a 3rd consecutive loss marked by above average volume. Perched at multi-year highs and above its "max buy" level. On pullbacks the prior high ($33) defines initial suppport to watch abvoe its 50 DMA line ($28.34).
>>> FEATURED STOCK ARTICLE : Spurt of Volume-Driven Gains Challenging Prior High - 1/25/2023 |
View all notes |
Set NEW NOTE alert |
Company Profile |
SEC
News |
Chart |
Request a new note
C
A
S
I |
ALGM
-
NASDAQ
Allegro Microsystems Inc
Elec-Semiconductor Mfg
|
$42.84
|
+1.62
3.93% |
$42.96
|
1,993,154
125.04% of 50 DAV
50 DAV is 1,594,000
|
$41.98
2.05%
|
1/31/2023
|
$37.80
|
PP = $38.38
|
|
MB = $40.30
|
Most Recent Note - 2/7/2023 5:51:24 PM
G - Hit yet another new high with today's gain. Last week it posted 3 consecutive volume-driven gains and its color code was changed to green after rising above its "max buy" level. Prior high in the $38 area defines initial support to watch on pullbacks.
>>> FEATURED STOCK ARTICLE : Big Volume-Driven Gain for Best-Ever Close - 1/31/2023 |
View all notes |
Set NEW NOTE alert |
Company Profile |
SEC
News |
Chart |
Request a new note
C
A
S
I |
|
|
|
THESE ARE NOT BUY RECOMMENDATIONS!
Comments contained in the body of this report are technical
opinions only. The material herein has been obtained
from sources believed to be reliable and accurate, however,
its accuracy and completeness cannot be guaranteed.
This site is not an investment advisor, hence it does
not endorse or recommend any securities or other investments.
Any recommendation contained in this report may not
be suitable for all investors and it is not to be deemed
an offer or solicitation on our part with respect to
the purchase or sale of any securities. All trademarks,
service marks and trade names appearing in this report
are the property of their respective owners, and are
likewise used for identification purposes only.
This report is a service available
only to active Paid Premium Members.
You may opt-out of receiving report notifications
at any time. Questions or comments may be submitted
by writing to Premium Membership Services 665 S.E. 10 Street, Suite 201 Deerfield Beach, FL 33441-5634 or by calling 1-800-965-8307
or 954-785-1121.
|
|
|