You are not logged in.
This means you
CAN ONLY VIEW reports that were published prior to Tuesday, April 8, 2025.
You
MUST UPGRADE YOUR MEMBERSHIP if you want to see any current reports.
AFTER MARKET UPDATE - WEDNESDAY, FEBRUARY 22ND, 2023
Previous After Market Report Next After Market Report >>>
|
|
|
|
DOW |
-84.50 |
33,045.09 |
-0.26% |
|
Volume |
920,045,194 |
-6% |
|
Volume |
4,655,179,300 |
-7% |
|
NASDAQ |
+14.77 |
11,507.07 |
+0.13% |
|
Advancers |
1,568 |
54% |
|
Advancers |
2,193 |
49% |
|
S&P 500 |
-6.29 |
3,991.05 |
-0.16% |
|
Decliners |
1,324 |
46% |
|
Decliners |
2,265 |
51% |
|
Russell 2000 |
+6.46 |
1,894.67 |
+0.34% |
|
52 Wk Highs |
32 |
|
|
52 Wk Highs |
46 |
|
|
S&P 600 |
+4.35 |
1,248.66 |
+0.35% |
|
52 Wk Lows |
34 |
|
|
52 Wk Lows |
123 |
|
|
 |
Advancers and Decliners Mixed With Major Averages Indecisive
Kenneth J. Gruneisen - Passed the CAN SLIM® Master's Exam
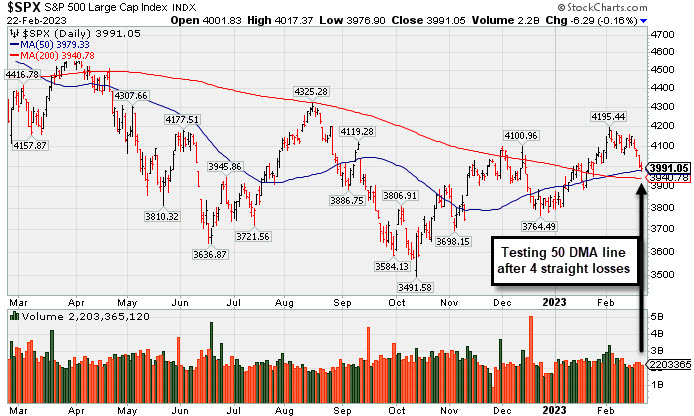
The Dow lost 84 points, while the Nasdaq Composite added 0.1%. The S&P 500 fell 0.2% with nine of 11 sectors finishing in negative territory. Volume totals were lighter than the prior session on the NYSE and on the Nasdaq exchange. Advancers led decliners by a narrow margin on the NYSE but decliners led advancers by a small margin on the Nasdaq exchange. There were 9 high-ranked companies from the Leaders List that hit new 52-week highs and were listed on the BreakOuts Page, versus 10 on the prior session. New 52-week lows totals outnumbered new 52-week highs on the NYSE and on the Nasdaq exchange. The major indices are in an uptrend under pressure (M criteria). Disciplined investors still have a green light for making new buys only in stocks matching all key criteria of the fact-based investment system.
PICTURED: The S&P 500 Index suffered a 4th consecutive loss testing its 50-day moving average line.
U.S. equities finished mixed Wednesday as investors digested the Federal Reserve’s (Fed) February 1 meeting minutes. The release showed there were some officials who favored a larger, 50-basis point (0.50%) interest rate hike. They acknowledged the risk persistently high inflation poses to the economy and highlighted concerns over stopping before reaching sufficiently restrictive territory to bring prices down. The state of the labor market was also discussed, with officials noting there is evidence of "labor hoarding" as employers remained concerned about losing talent.
On the data front, MBA mortgage applications for the week ended February 17 fell 13.3%, the biggest decline since the end of September 2022. The report cited the latest jump in mortgage rates as the key driver behind the recent decline in demand. Treasuries strengthened, with the yield on the benchmark 10-year note down three basis points (0.03%) to 3.92%, while the 30-year bond yield shed six basis points (0.06%) to 3.92%. The yield on the two-year note, which is more sensitive to changes in Fed policy, dipped four basis points (0.04%) to 4.69%. In commodities, West Texas Intermediate (WTI) crude tumbled 3% to $73.91/barrel as worries over global crude demand dampened investor sentiment.
|
 Kenneth J. Gruneisen started out as a licensed stockbroker in August 1987, a couple of months prior to the historic stock market crash that took the Dow Jones Industrial Average down -22.6% in a single day. He has published daily fact-based fundamental and technical analysis on high-ranked stocks online for two decades. Through FACTBASEDINVESTING.COM, Kenneth provides educational articles, news, market commentary, and other information regarding proven investment systems that work in good times and bad.
Comments contained in the body of this report are technical opinions only and are not necessarily those of Gruneisen Growth Corp. The material herein has been obtained from sources believed to be reliable and accurate, however, its accuracy and completeness cannot be guaranteed. Our firm, employees, and customers may effect transactions, including transactions contrary to any recommendation herein, or have positions in the securities mentioned herein or options with respect thereto. Any recommendation contained in this report may not be suitable for all investors and it is not to be deemed an offer or solicitation on our part with respect to the purchase or sale of any securities. |
|
 |
Retail and Networking Indexes Rose Amid Broader Losses
Kenneth J. Gruneisen - Passed the CAN SLIM® Master's Exam
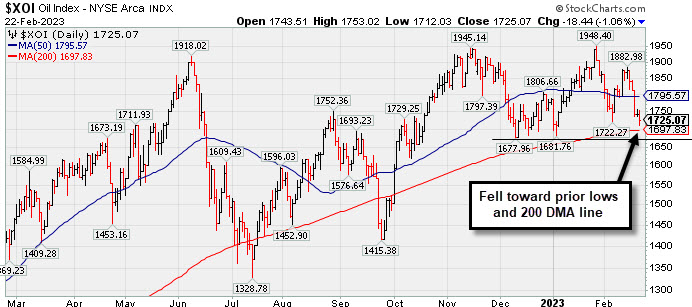
The Retail Index ($RLX +0.50%) posted a modest gain while the Broker/Dealer Index ($XBD -0.63%) and Bank Index ($BKX -0.34%) both edged lower. The Biotech Index ($BTK -0.63%) and Semiconductor Index ($SOX -0.48%) both edged lower, meanwhile the Networking Index ($NWX +0.73%) posted a decent gain. Commodity-linked groups lost ground as the Gold & Silver Index ($XAU -1.91%), Oil Services Index ($OSX -2.70%), and Integrated Oil Index ($XOI -1.06%) finished unanimously lower.
PICTURED: The Integrated Oil Index ($XOI -1.06%) has been slumping toward its 200-day moving average (DMA) line and prior lows.
| Oil Services |
$OSX |
83.78 |
-2.32 |
-2.70% |
-0.09% |
| Integrated Oil |
$XOI |
1,725.07 |
-18.44 |
-1.06% |
-3.48% |
| Semiconductor |
$SOX |
2,892.39 |
-13.87 |
-0.48% |
+14.23% |
| Networking |
$NWX |
814.40 |
+5.91 |
+0.73% |
+3.97% |
| Broker/Dealer |
$XBD |
492.33 |
-3.10 |
-0.63% |
+9.62% |
| Retail |
$RLX |
2,913.27 |
+14.38 |
+0.50% |
+5.78% |
| Gold & Silver |
$XAU |
114.14 |
-2.22 |
-1.91% |
-5.56% |
| Bank |
$BKX |
108.50 |
-0.37 |
-0.34% |
+7.58% |
| Biotech |
$BTK |
5,338.74 |
-33.88 |
-0.63% |
+1.09% |
|
|
|
 |
Perion Stubbornly Holding Ground Near High After Spurt of Gains
Kenneth J. Gruneisen - Passed the CAN SLIM® Master's Exam
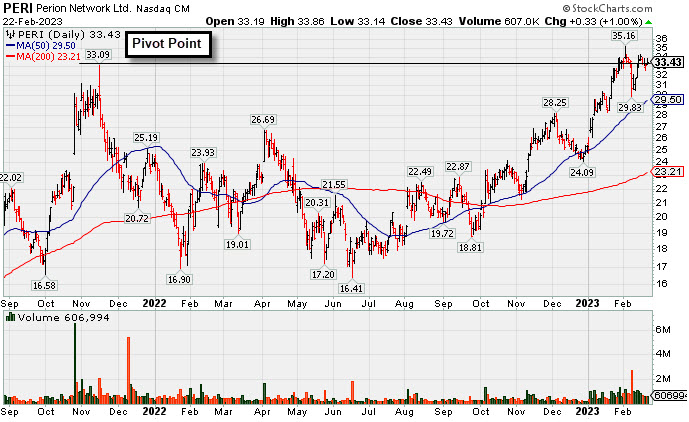
Perion Networks Ltd (PERI +$0.33 or +1.00% to $33.43) finished higher today and has been hovering near its 52-week high, showing resiience after undercutting its pivot point. The next important suppport to watch is its 50-day moving average (DMA) line ($29.50).
PERI was highlighted in yellow in the 1/25/23 mid-day report (read here) with pivot point cited based upon its 11/15/21 high plus 10 cents. It was shown in this FSU section in greater detail that evening with an annotated graph under the headline, "Spurt of Volume-Driven Gains Challenging Prior High".
PERI has a 98 Earnings Per Share Rating. It reported Dec '22 quarterly earnings +45% on +33% sales revenues versus the year ago period and its prior quarterly earnings history has been above the +25% minimum (C criteria). Its annual earnings (A criteria) history has been improving steadily after a downturn from FY '15-18. It hails from the Commercial Services-Advertising group which is currently ranked 43rd on the 197 Industry Groups list.
There are 45.8 million shares outstanding which can contribute to greater price volatility in the event of institutional buying or selling. The number of top-rated funds owning its shares rose from 113 in Mar '22 to 142 in Dec '22, a reassuring sign concerning the I criteria. Its current Up/Down Volume Ratio of 1.50 is an unbiased indication its shares have been under accumulation over the past 50 days.
|
|
|
Color Codes Explained :
Y - Better candidates highlighted by our
staff of experts.
G - Previously featured
in past reports as yellow but may no longer be buyable under the
guidelines.
***Last / Change / Volume data in this table is the closing quote data***
Symbol/Exchange
Company Name
Industry Group |
PRICE |
CHANGE
(%Change) |
Day High |
Volume
(% DAV)
(% 50 day avg vol) |
52 Wk Hi
% From Hi |
Featured
Date |
Price
Featured |
Pivot Featured |
|
Max Buy |
 CMC
-
NYSE
CMC
-
NYSE
Commercial Metals Co
METALS and MINING - Steel and Iron
|
$55.59
|
+0.03
0.05% |
$55.92
|
771,707
70.35% of 50 DAV
50 DAV is 1,097,000
|
$58.09
-4.30%
|
10/14/2022
|
$41.61
|
PP = $44.45
|
|
MB = $46.67
|
Most Recent Note - 2/21/2023 9:59:05 AM
G -Stubbornly holding its ground in recent weeks near its all-time high, extended from any sound base. Its 50 DMA line ($52.46) defines important near-term support to watch on pullbacks. Fundamentals remain strong.
>>> FEATURED STOCK ARTICLE : Metals Firm Extended From Base and Perched Near High - 2/6/2023 |
View all notes |
Set NEW NOTE alert |
Company Profile |
SEC
News |
Chart |
Request a new note
C
A
S
I |
GPK
-
NYSE
Graphic Packaging Hldg
CONSUMER NON-DURABLES - Packaging and Containers
|
$22.97
|
-0.12
-0.52% |
$23.28
|
2,623,117
79.23% of 50 DAV
50 DAV is 3,310,800
|
$24.20
-5.08%
|
10/25/2022
|
$22.75
|
PP = $24.17
|
|
MB = $25.38
|
Most Recent Note - 2/21/2023 10:04:37 AM
Y - Quietly perched only -4.3% off its all-time high. Showed resilience after briefly violating its 50 DMA line on 2/07/23. Members were reminded - "Disciplined investors know that gains above a stock's pivot point must be backed by at least +40% above average volume to trigger a proper technical buy signal."
>>> FEATURED STOCK ARTICLE : Graphic Packaging Perched Near Pivot Point - 1/27/2023 |
View all notes |
Set NEW NOTE alert |
Company Profile |
SEC
News |
Chart |
Request a new note
C
A
S
I |
GFF
-
NYSE
Griffon Corporation
MATERIALS and CONSTRUCTION - General Building Materials
|
$36.94
|
-0.05
-0.14% |
$37.57
|
622,047
120.79% of 50 DAV
50 DAV is 515,000
|
$43.74
-15.55%
|
11/10/2022
|
$34.13
|
PP = $35.02
|
|
MB = $36.77
|
Most Recent Note - 2/21/2023 10:02:18 AM
G - Pulling back near its "max buy" level and today's early loss was nearly testing its 50 DMA line ($38) which defines important support to watch. Reported Dec '22 quarterly earnings +121 on +10% sales revenues versus the year ago period.
>>> FEATURED STOCK ARTICLE : Extended From Any Sound Base and Still Hitting New Highs - 2/2/2023 |
View all notes |
Set NEW NOTE alert |
Company Profile |
SEC
News |
Chart |
Request a new note
C
A
S
I |
TITN
-
NASDAQ
Titan Machinery Inc
SPECIALTY RETAIL
|
$44.48
|
+0.53
1.21% |
$45.07
|
246,702
117.48% of 50 DAV
50 DAV is 210,000
|
$46.40
-4.14%
|
1/13/2023
|
$40.10
|
PP = $44.45
|
|
MB = $46.67
|
Most Recent Note - 2/21/2023 10:14:00 AM
Y - Still sputtering near its pivot point. Its 50 DMA line ($41.60) definies important near-term support to watch. It wedged into new high territory with gains lacking great volume conviction since a new pivot point was recently cited based on its 12/01/22 high plus 10 cents.
>>> FEATURED STOCK ARTICLE : 7th Consecutive Gain for Titan - 1/30/2023 |
View all notes |
Set NEW NOTE alert |
Company Profile |
SEC
News |
Chart |
Request a new note
C
A
S
I |
MYE
-
NYSE
Myers Industries Inc
Containers/Packaging
|
$24.05
|
-0.07
-0.29% |
$24.45
|
153,538
95.96% of 50 DAV
50 DAV is 160,000
|
$25.55
-5.87%
|
12/8/2022
|
$23.94
|
PP = $25.65
|
|
MB = $26.93
|
Most Recent Note - 2/21/2023 10:06:16 AM
Y - Found prompt support near its 50 DMA line ($23.54) on recent pullbacks. It still faces very little resistance due to overhead supply up to the $25.50 level.
>>> FEATURED STOCK ARTICLE : Perched Near High After Finding Support at 50 DMA - 2/3/2023 |
View all notes |
Set NEW NOTE alert |
Company Profile |
SEC
News |
Chart |
Request a new note
C
A
S
I |
Symbol/Exchange
Company Name
Industry Group |
PRICE |
CHANGE
(%Change) |
Day High |
Volume
(% DAV)
(% 50 day avg vol) |
52 Wk Hi
% From Hi |
Featured
Date |
Price
Featured |
Pivot Featured |
|
Max Buy |
BOX
-
NYSE
Box Inc Cl A
Computer Sftwr-Database
|
$33.66
|
+0.13
0.39% |
$33.99
|
2,026,055
145.13% of 50 DAV
50 DAV is 1,396,000
|
$34.98
-3.77%
|
2/2/2023
|
$34.68
|
PP = $33.14
|
|
MB = $34.80
|
Most Recent Note - 2/21/2023 9:57:17 AM
Y - Consolidating above prior highs and its 50 DMA line which coincide in the $32 area defining important near term support to watch.
>>> FEATURED STOCK ARTICLE : Perched Near High After Recent Breakout - 2/7/2023 |
View all notes |
Set NEW NOTE alert |
Company Profile |
SEC
News |
Chart |
Request a new note
C
A
S
I |
STRL
-
NASDAQ
Sterling Infrastructure
MATERIALS and; CONSTRUCTION - Heavy Construction
|
$36.13
|
+0.14
0.39% |
$36.30
|
190,802
75.42% of 50 DAV
50 DAV is 253,000
|
$38.43
-5.98%
|
12/14/2022
|
$32.41
|
PP = $33.72
|
|
MB = $35.41
|
Most Recent Note - 2/21/2023 10:12:00 AM
G - Perched at its all-time high and stubbornly holding its ground. Prior highs in the $34-33 area and its 50 DMA line ($33.63) define important near-term support to watch.
>>> FEATURED STOCK ARTICLE : Gain With Average Volume While Perched Near Recent Highs - 1/26/2023 |
View all notes |
Set NEW NOTE alert |
Company Profile |
SEC
News |
Chart |
Request a new note
C
A
S
I |
PERI
-
NASDAQ
Perion Networks Ltd
Comml Svcs-Advertising
|
$33.43
|
+0.33
1.00% |
$33.86
|
607,024
95.44% of 50 DAV
50 DAV is 636,000
|
$35.16
-4.92%
|
1/25/2023
|
$31.79
|
PP = $33.19
|
|
MB = $34.85
|
 Most Recent Note - 2/22/2023 6:53:43 PM
Y - Hovering near its 52-week high stubbornly holding ground. Showed resilience after undercutting its pivot point. The next important suppport to watch is its 50 DMA line ($29.50). See the latest FSU analysis for more details and a new annotated graph.
>>> FEATURED STOCK ARTICLE : Perion Stubbornly Holding Ground Near High After Spurt of Gains - 2/22/2023 |
View all notes |
Set NEW NOTE alert |
Company Profile |
SEC
News |
Chart |
Request a new note
C
A
S
I |
ALGM
-
NASDAQ
Allegro Microsystems Inc
Elec-Semiconductor Mfg
|
$43.04
|
+0.16
0.37% |
$43.59
|
974,371
59.52% of 50 DAV
50 DAV is 1,637,000
|
$45.99
-6.41%
|
1/31/2023
|
$37.80
|
PP = $38.38
|
|
MB = $40.30
|
Most Recent Note - 2/21/2023 9:55:27 AM
G - Holding its ground stubbornly after rising above its "max buy" level. Prior high in the $38 area defines initial support to watch on pullbacks.
>>> FEATURED STOCK ARTICLE : Big Volume-Driven Gain for Best-Ever Close - 1/31/2023 |
View all notes |
Set NEW NOTE alert |
Company Profile |
SEC
News |
Chart |
Request a new note
C
A
S
I |
WCC
-
NYSE
Wesco International Inc
WHOLESALE - Electronics Wholesale
|
$161.81
|
-0.56
-0.34% |
$163.31
|
422,830
92.32% of 50 DAV
50 DAV is 458,000
|
$172.91
-6.42%
|
2/10/2023
|
$148.50
|
PP = $147.15
|
|
MB = $154.51
|
Most Recent Note - 2/21/2023 7:01:16 PM
G - Color code was changed to green after rallying above its "max buy" level. Prior highs in the $144-147 area define initial support to watch. Reported Dec '22 quarterly earnings +40% on +15% sales revenues versus the year ago period. See the latest FSU analysis for more details and a new annotated graph.
>>> FEATURED STOCK ARTICLE : Powered Higher After Recently Highlighted in Feb 10th Report - 2/21/2023 |
View all notes |
Set NEW NOTE alert |
Company Profile |
SEC
News |
Chart |
Request a new note
C
A
S
I |
Symbol/Exchange
Company Name
Industry Group |
PRICE |
CHANGE
(%Change) |
Day High |
Volume
(% DAV)
(% 50 day avg vol) |
52 Wk Hi
% From Hi |
Featured
Date |
Price
Featured |
Pivot Featured |
|
Max Buy |
|
|
|
THESE ARE NOT BUY RECOMMENDATIONS!
Comments contained in the body of this report are technical
opinions only. The material herein has been obtained
from sources believed to be reliable and accurate, however,
its accuracy and completeness cannot be guaranteed.
This site is not an investment advisor, hence it does
not endorse or recommend any securities or other investments.
Any recommendation contained in this report may not
be suitable for all investors and it is not to be deemed
an offer or solicitation on our part with respect to
the purchase or sale of any securities. All trademarks,
service marks and trade names appearing in this report
are the property of their respective owners, and are
likewise used for identification purposes only.
This report is a service available
only to active Paid Premium Members.
You may opt-out of receiving report notifications
at any time. Questions or comments may be submitted
by writing to Premium Membership Services 665 S.E. 10 Street, Suite 201 Deerfield Beach, FL 33441-5634 or by calling 1-800-965-8307
or 954-785-1121.
|
|
|