You are not logged in.
This means you
CAN ONLY VIEW reports that were published prior to Tuesday, April 1, 2025.
You
MUST UPGRADE YOUR MEMBERSHIP if you want to see any current reports.
AFTER MARKET UPDATE - WEDNESDAY, JANUARY 25TH, 2023
Previous After Market Report Next After Market Report >>>
|
|
|
|
DOW |
+9.88 |
33,743.84 |
+0.03% |
|
Volume |
772,888,665 |
+27% |
|
Volume |
5,462,686,300 |
-4% |
|
NASDAQ |
-20.91 |
11,313.36 |
-0.18% |
|
Advancers |
1,622 |
55% |
|
Advancers |
2,338 |
52% |
|
S&P 500 |
-0.73 |
4,016.22 |
-0.02% |
|
Decliners |
1,344 |
45% |
|
Decliners |
2,167 |
48% |
|
Russell 2000 |
+4.71 |
1,890.32 |
+0.25% |
|
52 Wk Highs |
70 |
|
|
52 Wk Highs |
97 |
|
|
S&P 600 |
+3.50 |
1,235.57 |
+0.28% |
|
52 Wk Lows |
13 |
|
|
52 Wk Lows |
43 |
|
|
 |
Major Averages Were Little Changed While Leadership Thinned
Kenneth J. Gruneisen - Passed the CAN SLIM® Master's Exam
The Dow added 9 points while the S&P 500 remained unchanged and the Nasdaq Composite fell 0.2% after multiple technology earnings reports missed estimates. Volume totals were higher than the prior session on the NYSE and lighter on the Nasdaq exchange. Breadth was just slightly positive as advancers led decliners by a narrow margin on the NYSE and on the Nasdaq exchange. There were 18 high-ranked companies from the Leaders List that hit new 52-week highs and were listed on the BreakOuts Page versus the total of 39 on the prior session. New 52-week highs totals contracted yet still outnumbered new 52-week lows on both the NYSE and the Nasdaq exchange. The major indices are in a confirmed uptrend (M criteria). Disciplined investors have a green light for making new buys only in stocks matching all key criteria of the fact-based investment system.
PICTURED: The Nasdaq Composite Index recently rose back above its 50-day moving average line toward its 200 DMA line. The tech heavy index has lived below its 200 DMA line since January of 2022. Subsequent gains above the 200 DMA line would be a reassuring sign of a healthier market. Six of 11 sectors ended in positive territory as U.S. equities trimmed earlier losses to finish mixed on Wednesday. Investors examined the latest batch of corporate earnings. On the data front, Mortgage Banker Association (MBA) mortgage applications for the week ended January 20 increased for a third-consecutive week while refinancing activity surged approximately 62% in the first three weeks of January, up 15% last week. The spark in activity comes after 30-year average mortgage rates dropped by almost 1% from its 7.08% peak last November. In corporate earnings news, Kimberly-Clark Corporation (KMB -1.91%) was lower after it reported better-than-expected earnings before the bell this morning but missed Wall Street’s revenue estimates. Next year, the company expects net sales to grow between 0% and 2% as consumer spending begins to slow. After the bell, Tesla Inc. (TSLA +0.38%) held its ground and announced it topped analysts’ earnings estimates but missed revenue forecasts following a report from earlier in the month a jump in vehicle deliveries by 40% in 2022 versus 2021.
Treasuries strengthened as investors await upcoming economic data ahead of the Federal Reserve’s (Fed) first meeting of 2023. The yield on the benchmark 10-year note lost one basis point (0.01%) to 3.45%, while the 30-year bond yield shed one basis point (0.01%) to 3.60%. The two-year note yield, which is more sensitive to changes in monetary policy, fell eight basis points (0.08%) to 4.13%. In commodities, West Texas Intermediate (WTI) crude increased 0.6% to $80.58/barrel after the Department of Energy showed a smaller-than-anticipated build in U.S. crude oil inventories for the week ended January 20. |
 Kenneth J. Gruneisen started out as a licensed stockbroker in August 1987, a couple of months prior to the historic stock market crash that took the Dow Jones Industrial Average down -22.6% in a single day. He has published daily fact-based fundamental and technical analysis on high-ranked stocks online for two decades. Through FACTBASEDINVESTING.COM, Kenneth provides educational articles, news, market commentary, and other information regarding proven investment systems that work in good times and bad.
Comments contained in the body of this report are technical opinions only and are not necessarily those of Gruneisen Growth Corp. The material herein has been obtained from sources believed to be reliable and accurate, however, its accuracy and completeness cannot be guaranteed. Our firm, employees, and customers may effect transactions, including transactions contrary to any recommendation herein, or have positions in the securities mentioned herein or options with respect thereto. Any recommendation contained in this report may not be suitable for all investors and it is not to be deemed an offer or solicitation on our part with respect to the purchase or sale of any securities. |
|
 |
Financial, Retail, and Commodity-Linked Groups Rose
Kenneth J. Gruneisen - Passed the CAN SLIM® Master's Exam
The Broker/Dealer Index ($XBD +1.19%) and Bank Index ($BKX +1.59%) both posted gains and the Retail Index ($RLX +0.69%) also edged higher. The tech sector was indecisive as the Semiconductor Index ($SOX +0.18%) and Biotech Index ($BTK +0.09%) inched higher and the Networking Index ($NWX -0.47%) edged lower. Commodity-linked groups had a positive bias as the Gold & Silver Index ($XAU +1.91%) and Oil Services Index ($OSX +2.18%) both posted solid gains and outpaced the Integrated Oil Index ($XOI +0.18%).
PICTURED: The Biotech Index ($BTK +0.09%) recently rose above its 2022 high.
PICTURED: The 3-year Biotech Index graph shows a lot of overhead supply remains while rebounding toward 2021 highs.
| Oil Services |
$OSX |
92.60 |
+1.98 |
+2.18% |
+10.42% |
| Integrated Oil |
$XOI |
1,882.54 |
+3.31 |
+0.18% |
+5.33% |
| Semiconductor |
$SOX |
2,918.99 |
+5.25 |
+0.18% |
+15.28% |
| Networking |
$NWX |
809.63 |
-3.86 |
-0.47% |
+3.36% |
| Broker/Dealer |
$XBD |
486.88 |
+5.71 |
+1.19% |
+8.41% |
| Retail |
$RLX |
2,975.15 |
+20.48 |
+0.69% |
+8.03% |
| Gold & Silver |
$XAU |
139.16 |
+2.61 |
+1.91% |
+15.14% |
| Bank |
$BKX |
110.37 |
+1.73 |
+1.59% |
+9.44% |
| Biotech |
$BTK |
5,556.72 |
+4.82 |
+0.09% |
+5.22% |
|
|
|
 |
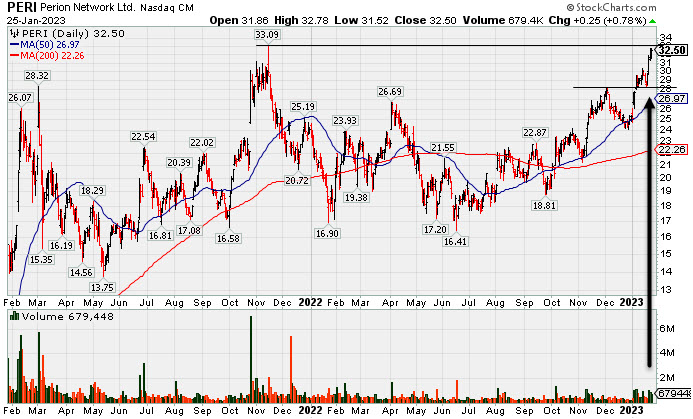
Spurt of Volume-Driven Gains Challenging Prior High
Kenneth J. Gruneisen - Passed the CAN SLIM® Master's Exam
Perion Networks Ltd (PERI +$0.25 or +0.78% or $32.50) overcame early weakness to finished higher after highlighted in yellow in the earlier mid-day report (read here) with pivot point cited based upon its 11/15/21 high plus 10 cents. It posted a 4th consecutive gain and 3rd consecutive gain backed by above average volume while challenging the Nov '21 high in the $33 area. Subsequent gains above the pivot point backed by at least +40% above average volume may trigger a technical buy signal. It found support near its 50-day moving average (DMA) line i($26.97) in recent weeks.
PERI has a 97 Earnings Per Share Rating. It reported Sep '22 quarterly earnings +53% on +31% sales revenues versus the year ago period and its prior quarterly earnings history has been above the +25% minimum (C criteria). Its annual earnings (A criteria) history has been improving steadily after a downturn from FY '15-18. It hails from the Commercial Services-Advertising group which is currently ranked 77th on the 197 Industry Groups list.
There are 45.1 million shares outstanding which can contribute to greater price volatility in the event of institutional buying or selling. The number of top-rated funds owning its shares rose from 113 in Mar '22 to 130 in Dec '22, a reassuring sign concerning the I criteria. Its current Up/Down Volume Ratio of 2.0 is an unbiased indication its shares have been under accumulation over the past 50 days.
|
|
|
Color Codes Explained :
Y - Better candidates highlighted by our
staff of experts.
G - Previously featured
in past reports as yellow but may no longer be buyable under the
guidelines.
***Last / Change / Volume data in this table is the closing quote data***
Symbol/Exchange
Company Name
Industry Group |
PRICE |
CHANGE
(%Change) |
Day High |
Volume
(% DAV)
(% 50 day avg vol) |
52 Wk Hi
% From Hi |
Featured
Date |
Price
Featured |
Pivot Featured |
|
Max Buy |
 CMC
-
NYSE
CMC
-
NYSE
Commercial Metals Co
METALS and MINING - Steel and Iron
|
$53.21
|
+1.64
3.18% |
$53.26
|
1,138,018
109.11% of 50 DAV
50 DAV is 1,043,000
|
$56.88
-6.45%
|
10/14/2022
|
$41.61
|
PP = $44.45
|
|
MB = $46.67
|
 Most Recent Note - 1/25/2023 5:30:30 PM
G - Posted a solid gain today with higher (near average) volume and finished near the session high. Its 50 DMA line ($49.63) defines important near-term support to watch on pullbacks. Fundamentals remain strong.
>>> FEATURED STOCK ARTICLE : Pulling Back After Rallying From 50-Day Moving Average Line - 1/18/2023 |
View all notes |
Set NEW NOTE alert |
Company Profile |
SEC
News |
Chart |
Request a new note
C
A
S
I |
GPK
-
NYSE
Graphic Packaging Hldg
CONSUMER NON-DURABLES - Packaging and Containers
|
$23.42
|
+0.50
2.18% |
$23.56
|
4,005,572
133.43% of 50 DAV
50 DAV is 3,002,100
|
$24.07
-2.70%
|
10/25/2022
|
$22.75
|
PP = $24.17
|
|
MB = $25.38
|
Most Recent Note - 1/25/2023 5:35:12 PM
Y - Posted a 4th consecutive gain today and 2nd consecutive gain with above average volume while approaching prior highs. Faces little resistance due to overhead supply up to the $24 level. Showed resilience and it is consolidating above its 50 and 200 DMA lines. Losses back below them would raise concerns and trigger technical sell signals. Fundamentals remain strong.
>>> FEATURED STOCK ARTICLE : Found Support at 200-Day Moving Average and Still Faces Resistance - 1/10/2023 |
View all notes |
Set NEW NOTE alert |
Company Profile |
SEC
News |
Chart |
Request a new note
C
A
S
I |
GFF
-
NYSE
Griffon Corporation
MATERIALS and CONSTRUCTION - General Building Materials
|
$39.53
|
+0.21
0.53% |
$39.61
|
232,560
47.27% of 50 DAV
50 DAV is 492,000
|
$40.74
-2.97%
|
11/10/2022
|
$34.13
|
PP = $35.02
|
|
MB = $36.77
|
Most Recent Note - 1/23/2023 6:46:59 PM
G - Showed resilience and volume totals have cooled following a "negative reversal" at its 52-week high on 1/18/23. Its 50 DMA line ($35.88) defines near-term support above recent lows in the $33.82 area. Reported Sep '22 quarterly earnings +230% on +24% sales revenues versus the year ago period.
>>> FEATURED STOCK ARTICLE : Showed Resilience Following Negative Reversal at 52-Week High - 1/19/2023 |
View all notes |
Set NEW NOTE alert |
Company Profile |
SEC
News |
Chart |
Request a new note
C
A
S
I |
CPRX
-
NASDAQ
Catalyst Pharma Inc
Medical-Biomed/Biotech
|
$16.73
|
+0.61
3.78% |
$16.88
|
3,686,432
129.17% of 50 DAV
50 DAV is 2,854,000
|
$22.11
-24.33%
|
11/22/2022
|
$17.38
|
PP = $16.66
|
|
MB = $17.49
|
Most Recent Note - 1/25/2023 5:32:42 PM
G - Posted a 2nd solid gain today after a gap down and considerable volume-driven loss on 1/23/23 violated its 50 DMA line ($17.67) triggering a technical sell signal. A prompt rebound above the 50 DMA line is needed for its outlook to improve.
>>> FEATURED STOCK ARTICLE : Decisive Sell Signal Triggered by Considerable Loss on Heavy Volume - 1/23/2023 |
View all notes |
Set NEW NOTE alert |
Company Profile |
SEC
News |
Chart |
Request a new note
C
A
S
I |
TITN
-
NASDAQ
Titan Machinery Inc
SPECIALTY RETAIL
|
$41.67
|
+0.52
1.26% |
$41.73
|
95,207
39.50% of 50 DAV
50 DAV is 241,000
|
$44.35
-6.04%
|
1/13/2023
|
$40.10
|
PP = $44.45
|
|
MB = $46.67
|
Most Recent Note - 1/25/2023 5:36:20 PM
Y - Posted a 4th consecutive gain today with below average volume. The prior high in the $38 area defines important support to watch along with its 50 DMA line ($39.10)..A new pivot point was recently cited based on its 12/01/22 high plus 10 cents.
>>> FEATURED STOCK ARTICLE : Forming New Base for Past 7 Weeks - 1/13/2023 |
View all notes |
Set NEW NOTE alert |
Company Profile |
SEC
News |
Chart |
Request a new note
C
A
S
I |
Symbol/Exchange
Company Name
Industry Group |
PRICE |
CHANGE
(%Change) |
Day High |
Volume
(% DAV)
(% 50 day avg vol) |
52 Wk Hi
% From Hi |
Featured
Date |
Price
Featured |
Pivot Featured |
|
Max Buy |
MYE
-
NYSE
Myers Industries Inc
Containers/Packaging
|
$23.41
|
+0.07
0.30% |
$23.41
|
120,376
72.52% of 50 DAV
50 DAV is 166,000
|
$25.55
-8.38%
|
12/8/2022
|
$23.94
|
PP = $25.65
|
|
MB = $26.93
|
Most Recent Note - 1/24/2023 5:46:23 PM
Y - Still sputtering following a noted "negative reversal" on 1/17/23. Its 50 DMA line ($22.93) defines near-term support to watch. Faces little resistance due to overhead supply up to the $25.50 level.
>>> FEATURED STOCK ARTICLE : Myers Quietly Consolidating Within Striking Distance of Prior High - 1/20/2023 |
View all notes |
Set NEW NOTE alert |
Company Profile |
SEC
News |
Chart |
Request a new note
C
A
S
I |
BOX
-
NYSE
Box Inc Cl A
Computer Sftwr-Database
|
$31.50
|
+0.10
0.32% |
$31.56
|
742,252
55.52% of 50 DAV
50 DAV is 1,337,000
|
$33.04
-4.66%
|
12/12/2022
|
$29.83
|
PP = $29.57
|
|
MB = $31.05
|
Most Recent Note - 1/24/2023 5:43:39 PM
Y - Holding its ground and recently challenging prior highs in the $31-32 area. Its 50 DMA line ($29.68) defines important near-term support to watch. Faces very little resistance due to overhead supply up to the $32 level. Quarterly and annual earnings increases have been strong and steady. See the latest FSU analysis for more details and a new annotated graph.
>>> FEATURED STOCK ARTICLE : Perched Above "Max Buy" Level Near Recent Highs - 1/24/2023 |
View all notes |
Set NEW NOTE alert |
Company Profile |
SEC
News |
Chart |
Request a new note
C
A
S
I |
STRL
-
NASDAQ
Sterling Infrastructure
MATERIALS and; CONSTRUCTION - Heavy Construction
|
$33.53
|
-0.62
-1.82% |
$34.32
|
318,875
144.29% of 50 DAV
50 DAV is 221,000
|
$34.86
-3.82%
|
12/14/2022
|
$32.41
|
PP = $33.72
|
|
MB = $35.41
|
Most Recent Note - 1/25/2023 5:27:32 PM
Y - Pulled back today with +44% above average volume and retreated back below the previously cited pivot point yet again. The 50 DMA line ($32.16) and recent low ($30.60 on 1/19/23) define near-term support levels to watch following its recently noted failed breakout attempt. Highlighted in yellow with pivot point cited based on its 11/08/22 high plus 10 cents in the 12/14/22 mid-day report. Confirming volume-driven gains for a new high would be a reassuring sign of fresh institutional buying demand.
>>> FEATURED STOCK ARTICLE : Finding Support Near 50-Day Moving Average After Failed Breakout Attempt - 1/9/2023 |
View all notes |
Set NEW NOTE alert |
Company Profile |
SEC
News |
Chart |
Request a new note
C
A
S
I |
PERI
-
NASDAQ
Perion Networks Ltd
Comml Svcs-Advertising
|
$32.50
|
+0.25
0.78% |
$32.78
|
679,448
154.42% of 50 DAV
50 DAV is 440,000
|
$32.75
-0.76%
|
1/25/2023
|
$31.79
|
PP = $33.19
|
|
MB = $34.85
|
Most Recent Note - 1/25/2023 5:12:13 PM
Y - Posted a 4th consecutive gain today, its 3rd consecutive gain backed by above average volume. Its color code was changed to yellow with pivot point cited based upon its 11/15/21 high plus 10 cents in the earlier mid-day report. PERI held its ground after recently noted volume-driven gains and it is challenging the Nov '21 high in the $33 area. Subsequent gains above the pivot point backed by at least +40% above average volume may trigger a technical buy signal. Found support near its 50 DMA line since noted in the 12/06/22 mid-day report. Reported Sep '22 quarterly earnings +53% on +31% sales revenues versus the year ago period. Prior quarterly earnings history (C criteria) has been above the +25% minimum. Annual earnings (A criteria) history has been improving steadily after a downturn from FY '15-18. See the latest FSU analysis for more details and a new annotated graph.
>>> FEATURED STOCK ARTICLE : Spurt of Volume-Driven Gains Challenging Prior High - 1/25/2023 |
View all notes |
Set NEW NOTE alert |
Company Profile |
SEC
News |
Chart |
Request a new note
C
A
S
I |
|
|
|
THESE ARE NOT BUY RECOMMENDATIONS!
Comments contained in the body of this report are technical
opinions only. The material herein has been obtained
from sources believed to be reliable and accurate, however,
its accuracy and completeness cannot be guaranteed.
This site is not an investment advisor, hence it does
not endorse or recommend any securities or other investments.
Any recommendation contained in this report may not
be suitable for all investors and it is not to be deemed
an offer or solicitation on our part with respect to
the purchase or sale of any securities. All trademarks,
service marks and trade names appearing in this report
are the property of their respective owners, and are
likewise used for identification purposes only.
This report is a service available
only to active Paid Premium Members.
You may opt-out of receiving report notifications
at any time. Questions or comments may be submitted
by writing to Premium Membership Services 665 S.E. 10 Street, Suite 201 Deerfield Beach, FL 33441-5634 or by calling 1-800-965-8307
or 954-785-1121.
|
|
|