You are not logged in.
This means you
CAN ONLY VIEW reports that were published prior to Monday, March 31, 2025.
You
MUST UPGRADE YOUR MEMBERSHIP if you want to see any current reports.
AFTER MARKET UPDATE - FRIDAY, FEBRUARY 3RD, 2023
Previous After Market Report Next After Market Report >>>
|
|
|
|
DOW |
-127.93 |
33,926.01 |
-0.38% |
|
Volume |
982,230,541 |
-5% |
|
Volume |
5,969,644,700 |
-6% |
|
NASDAQ |
-193.86 |
12,006.95 |
-1.59% |
|
Advancers |
801 |
27% |
|
Advancers |
1,713 |
37% |
|
S&P 500 |
-43.28 |
4,136.48 |
-1.04% |
|
Decliners |
2,176 |
73% |
|
Decliners |
2,859 |
63% |
|
Russell 2000 |
-15.69 |
1,985.53 |
-0.78% |
|
52 Wk Highs |
121 |
|
|
52 Wk Highs |
144 |
|
|
S&P 600 |
-5.02 |
1,310.80 |
-0.38% |
|
52 Wk Lows |
3 |
|
|
52 Wk Lows |
22 |
|
|
 |
Major Indices Retreat With Lighter Volume Totals
Kenneth J. Gruneisen - Passed the CAN SLIM® Master's Exam
The Dow lost 127 points and notched a 0.2% weekly decline. The Nasdaq Composite decreased 1.6% and jumped 3.3% for the week despite mixed fourth-quarter earnings results from technology companies. The S&P 500 declined 1% and climbed 1.6% for the week.Volume totals were lighter than the prior session on the NYSE and on the Nasdaq exchange. Breadth was negative as decliners led advancers by an 11-4 margin on the NYSE and by more than a 3-2 margin the Nasdaq exchange. There were 80 high-ranked companies from the Leaders List that hit new 52-week highs and were listed on the BreakOuts Page versus the total of 121 on the prior session. New 52-week highs totals solidly outnumbered shrinking new 52-week lows totals on both the NYSE and the Nasdaq exchange. The major indices are in a confirmed uptrend (M criteria). Disciplined investors have a green light for making new buys only in stocks matching all key criteria of the fact-based investment system.
PICTURED: The Dow Jones Industrial Average posted a 2nd consecutive small loss with higher volume, yet remains above its 50 DMA line and perched within close striking distance of its December high.
U.S. equities finished lower Friday amid a strong jobs report and diminishing investor hopes for a near-term pivot in interest rates. The resilient labor market seen today will have market participants debating on how much further the Federal Reserve (Fed) will need to go to tackle inflation. However, the labor market is a lagging indicator, meaning it will be the last area to show any amount of weakness. All eleven S&P sectors finished in negative territory with Consumer Discretionary leading laggards.
On the data front, the U.S. economy added 517,000 in January, drastically surging from the prior month’s revised 260,000, notching the largest gain since July 2022. With the jump in payrolls, the unemployment rate dropped to 3.4%, a 53-year low, leaving investors concerned the Fed may keep raising rates.
Treasuries weakened, with the yield on the 10-year note up 14 basis points (0.14%) to 3.53%, while the 30-year bond yield increased eight basis points (0.08%) to 3.63%. The yield on the two-year note climbed 21 basis points (0.21%) to 4.30%. In commodities, West Texas Intermediate (WTI) crude declined 3.5% to $73.21/barrel after a volatile day of trading amid strong economic data buoying fears of an economic slowdown. Meanwhile, the European Union is slated to discuss the development of a potential ban on Russian refined products on February 5. |
 Kenneth J. Gruneisen started out as a licensed stockbroker in August 1987, a couple of months prior to the historic stock market crash that took the Dow Jones Industrial Average down -22.6% in a single day. He has published daily fact-based fundamental and technical analysis on high-ranked stocks online for two decades. Through FACTBASEDINVESTING.COM, Kenneth provides educational articles, news, market commentary, and other information regarding proven investment systems that work in good times and bad.
Comments contained in the body of this report are technical opinions only and are not necessarily those of Gruneisen Growth Corp. The material herein has been obtained from sources believed to be reliable and accurate, however, its accuracy and completeness cannot be guaranteed. Our firm, employees, and customers may effect transactions, including transactions contrary to any recommendation herein, or have positions in the securities mentioned herein or options with respect thereto. Any recommendation contained in this report may not be suitable for all investors and it is not to be deemed an offer or solicitation on our part with respect to the purchase or sale of any securities. |
|
 |
Retail, Gold & Silver, and Tech Indexes Lost Ground
Kenneth J. Gruneisen - Passed the CAN SLIM® Master's Exam
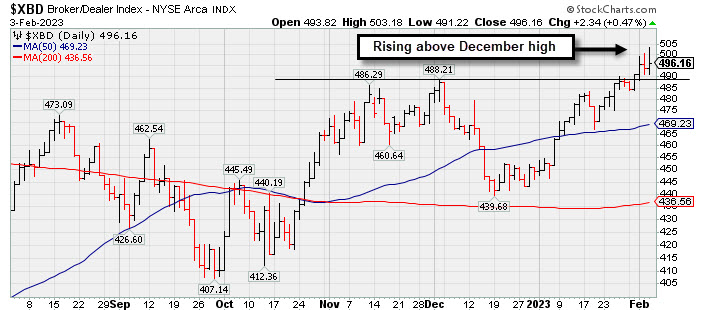
A big loss for the Retail Index ($RLX -5.03%) created a drag on the major averages on Friday. Meanwhile financials were mixed as the Bank Index ($BKX -0.30%) edged lower and the Broker/Dealer Index ($XBD +0.47%) edged higher. The tech sector had a negative bias as the Semiconductor Index ($SOX -1.90%), Networking Index ($NWX -1.26%), and Biotech Index ($BTK -0.80%) finished unanimously lower. The Gold & Silver Index ($XAU -3.76%) suffered a large loss. Energy-linked groups were mixed as the Oil Services Index ($OSX +0.34%) edged higher and the Integrated Oil Index ($XOI -0.36%) edged lower.
PICTURED: The Broker/Dealer Index ($XBD +0.47%) rose above its December high with recent gains. Longtime members know that the financials have been reliable "leading indicators" for the broader market, so the recent strength is a reassuring sign.
| Oil Services |
$OSX |
89.32 |
+0.31 |
+0.34% |
+6.51% |
| Integrated Oil |
$XOI |
1,760.35 |
-6.31 |
-0.36% |
-1.50% |
| Semiconductor |
$SOX |
3,082.11 |
-59.73 |
-1.90% |
+21.72% |
| Networking |
$NWX |
834.60 |
-10.68 |
-1.26% |
+6.55% |
| Broker/Dealer |
$XBD |
496.16 |
+2.34 |
+0.47% |
+10.47% |
| Retail |
$RLX |
3,109.81 |
-164.67 |
-5.03% |
+12.92% |
| Gold & Silver |
$XAU |
127.60 |
-4.99 |
-3.76% |
+5.58% |
| Bank |
$BKX |
114.52 |
-0.35 |
-0.30% |
+13.56% |
| Biotech |
$BTK |
5,599.37 |
-45.14 |
-0.80% |
+6.03% |
|
|
|
 |
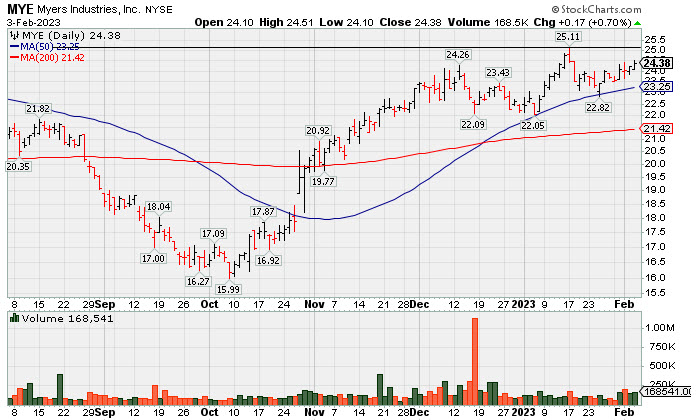
Perched Near High After Finding Support at 50 DMA
Kenneth J. Gruneisen - Passed the CAN SLIM® Master's Exam
Myers Industries Inc (MYE +$0.17 or +0.70% to $24.38) found support while testing its 50-day moving average (DMA) line ($23.27) in recent weeks. It faces little resistance due to overhead supply up to the $25.50 level. Subsequent volume-driven gains for new highs would be a reassuring sign of fresh institutional buying demand that could lead to a more meaningful leg up.
MYE was highlighted in yellow in the 12/08/22 mid-day report (read here). It was last covered in greater detail in the FSU section on 1/20/23 with an annotated graph under the headline, "Myers Quietly Consolidating Within Striking Distance of Prior High". It has a 97 Earnings Per Share Rating. The Sep '22 quarter showed +78% earnings on +14% sales revenues versus the year ago period. The past 4 quarterly comparisons were above the +25% minimum guideline (C criteria), however, its sales revenues growth rate has shown deceleration in sequential comparisons +45%, +29%, +24%, to +14%. Annual earnings (A criteria) history had a slight downturn in FY '19 but growth has been otherwise strong and steady.
It hails from the Containers/Packaging industry group which is now ranked 50th on the 197 Industry Groups list (L criteria). There are only 36.5 million shares outstanding (S criteria) which can contribute to greater price volatility in the event of institutional buying or selling. The number of top-rated funds owning its shares was 336 in Mar '22 and was reported at 343 as of Dec '22. Its current Up/Down Volume Ratio of 1.0 is an unbiased indication its shares have been neutral concerning accumulation/distribution over the past 50 days (I criteria). |
|
|
Color Codes Explained :
Y - Better candidates highlighted by our
staff of experts.
G - Previously featured
in past reports as yellow but may no longer be buyable under the
guidelines.
***Last / Change / Volume data in this table is the closing quote data***
Symbol/Exchange
Company Name
Industry Group |
PRICE |
CHANGE
(%Change) |
Day High |
Volume
(% DAV)
(% 50 day avg vol) |
52 Wk Hi
% From Hi |
Featured
Date |
Price
Featured |
Pivot Featured |
|
Max Buy |
 CMC
-
NYSE
CMC
-
NYSE
Commercial Metals Co
METALS and MINING - Steel and Iron
|
$56.57
|
+0.53
0.95% |
$58.09
|
1,263,238
121.23% of 50 DAV
50 DAV is 1,042,000
|
$56.88
-0.55%
|
10/14/2022
|
$41.61
|
PP = $44.45
|
|
MB = $46.67
|
Most Recent Note - 2/1/2023 5:44:11 PM
G - Posted a gain today with average volume and finished 16 cents off its best-ever close. It is extended from any sound base. Its 50 DMA line ($50.41) defines important near-term support to watch on pullbacks. Fundamentals remain strong. See the latest FSU analysis for more details and a new annotated graph.
>>> FEATURED STOCK ARTICLE : Extended From Any Sound Base and Perched Near High - 2/1/2023 |
View all notes |
Set NEW NOTE alert |
Company Profile |
SEC
News |
Chart |
Request a new note
C
A
S
I |
GPK
-
NYSE
Graphic Packaging Hldg
CONSUMER NON-DURABLES - Packaging and Containers
|
$23.66
|
-0.16
-0.67% |
$23.91
|
3,120,537
104.63% of 50 DAV
50 DAV is 2,982,500
|
$24.20
-2.23%
|
10/25/2022
|
$22.75
|
PP = $24.17
|
|
MB = $25.38
|
 Most Recent Note - 2/3/2023 7:39:26 PM
Y - Hovered near its 52-week high after challenging its pivot point this week. Disciplined investors know that gains above a stock's pivot point must be backed by at least +40% above average volume to trigger a proper technical buy signal.
>>> FEATURED STOCK ARTICLE : Graphic Packaging Perched Near Pivot Point - 1/27/2023 |
View all notes |
Set NEW NOTE alert |
Company Profile |
SEC
News |
Chart |
Request a new note
C
A
S
I |
GFF
-
NYSE
Griffon Corporation
MATERIALS and CONSTRUCTION - General Building Materials
|
$43.01
|
+0.97
2.31% |
$43.74
|
1,110,863
227.64% of 50 DAV
50 DAV is 488,000
|
$42.16
2.02%
|
11/10/2022
|
$34.13
|
PP = $35.02
|
|
MB = $36.77
|
Most Recent Note - 2/3/2023 12:25:52 PM
G - Hitting yet another new 52-week high with today's 4th consecutive gain backed by above average volume, getting more extended from any sound base. Its 50 DMA line ($37.07) defines near-term support to watch on pullbacks. Reported Dec '22 quarterly earnings +121 on +10% sales revenues versus the year ago period.
>>> FEATURED STOCK ARTICLE : Extended From Any Sound Base and Still Hitting New Highs - 2/2/2023 |
View all notes |
Set NEW NOTE alert |
Company Profile |
SEC
News |
Chart |
Request a new note
C
A
S
I |
TITN
-
NASDAQ
Titan Machinery Inc
SPECIALTY RETAIL
|
$45.80
|
+0.89
1.98% |
$46.00
|
185,807
72.30% of 50 DAV
50 DAV is 257,000
|
$45.35
0.99%
|
1/13/2023
|
$40.10
|
PP = $44.45
|
|
MB = $46.67
|
Most Recent Note - 2/2/2023 6:23:32 PM
Y - Wedging higher, it hit yet another new all-time high with volume +18% above average behind today's 10th consecutive gain. Its 50 DMA line ($40.20) definies important near-term support to watch on pullbacks. A new pivot point was recently cited based on its 12/01/22 high plus 10 cents.
>>> FEATURED STOCK ARTICLE : 7th Consecutive Gain for Titan - 1/30/2023 |
View all notes |
Set NEW NOTE alert |
Company Profile |
SEC
News |
Chart |
Request a new note
C
A
S
I |
MYE
-
NYSE
Myers Industries Inc
Containers/Packaging
|
$24.38
|
+0.17
0.70% |
$24.51
|
168,541
104.04% of 50 DAV
50 DAV is 162,000
|
$25.55
-4.58%
|
12/8/2022
|
$23.94
|
PP = $25.65
|
|
MB = $26.93
|
Most Recent Note - 2/3/2023 7:37:12 PM
Y - Posted a 2nd consecutive gain with average volume. Found support while testing its 50 DMA line ($23.27) in recent weeks. Faces little resistance due to overhead supply up to the $25.50 level. See the latest FSU analysis for more details and a new annotated graph.
>>> FEATURED STOCK ARTICLE : Perched Near High After Finding Support at 50 DMA - 2/3/2023 |
View all notes |
Set NEW NOTE alert |
Company Profile |
SEC
News |
Chart |
Request a new note
C
A
S
I |
Symbol/Exchange
Company Name
Industry Group |
PRICE |
CHANGE
(%Change) |
Day High |
Volume
(% DAV)
(% 50 day avg vol) |
52 Wk Hi
% From Hi |
Featured
Date |
Price
Featured |
Pivot Featured |
|
Max Buy |
BOX
-
NYSE
Box Inc Cl A
Computer Sftwr-Database
|
$34.38
|
-0.30
-0.87% |
$34.90
|
1,099,454
78.59% of 50 DAV
50 DAV is 1,399,000
|
$34.74
-1.04%
|
2/2/2023
|
$34.68
|
PP = $33.14
|
|
MB = $34.80
|
Most Recent Note - 2/2/2023 6:28:47 PM
Y - Posted a 3rd consecutive gain today backed by +41% above average volume hitting a new high. Color code is changed to yellow as it also broke out today above a new pivot point cited based on its 4/20/22 high plus 10 cents. Prior highs in the $31 area define initial support to watch on pulllbacks.
>>> FEATURED STOCK ARTICLE : Perched Above "Max Buy" Level Near Recent Highs - 1/24/2023 |
View all notes |
Set NEW NOTE alert |
Company Profile |
SEC
News |
Chart |
Request a new note
C
A
S
I |
STRL
-
NASDAQ
Sterling Infrastructure
MATERIALS and; CONSTRUCTION - Heavy Construction
|
$36.86
|
+0.54
1.49% |
$36.89
|
202,099
86.74% of 50 DAV
50 DAV is 233,000
|
$36.98
-0.32%
|
12/14/2022
|
$32.41
|
PP = $33.72
|
|
MB = $35.41
|
Most Recent Note - 2/3/2023 7:42:26 PM
G - Color code is changed to green after a gain above its "max buy" level backed by light volume. Prior highs in the $34-33 area define initial support to watch above its 50 DMA line ($32.73).
>>> FEATURED STOCK ARTICLE : Gain With Average Volume While Perched Near Recent Highs - 1/26/2023 |
View all notes |
Set NEW NOTE alert |
Company Profile |
SEC
News |
Chart |
Request a new note
C
A
S
I |
PERI
-
NASDAQ
Perion Networks Ltd
Comml Svcs-Advertising
|
$33.93
|
-0.07
-0.21% |
$34.32
|
560,872
114.46% of 50 DAV
50 DAV is 490,000
|
$35.16
-3.50%
|
1/25/2023
|
$31.79
|
PP = $33.19
|
|
MB = $34.85
|
Most Recent Note - 2/2/2023 2:30:16 PM
Y - Gain today marked by above average volume is adding to a recent spurt, hitting new multi-year highs and challenging its "max buy" level. On pullbacks the prior high ($33) defines initial suppport to watch abvoe its 50 DMA line ($27.89).
>>> FEATURED STOCK ARTICLE : Spurt of Volume-Driven Gains Challenging Prior High - 1/25/2023 |
View all notes |
Set NEW NOTE alert |
Company Profile |
SEC
News |
Chart |
Request a new note
C
A
S
I |
ALGM
-
NASDAQ
Allegro Microsystems Inc
Elec-Semiconductor Mfg
|
$41.56
|
+0.46
1.12% |
$41.94
|
1,908,139
123.11% of 50 DAV
50 DAV is 1,550,000
|
$41.59
-0.07%
|
1/31/2023
|
$37.80
|
PP = $38.38
|
|
MB = $40.30
|
Most Recent Note - 2/2/2023 1:55:12 PM
G - Hitting yet another new high with today's 3rd consecutive volume-driven gain and its color code is changed to green after rising above its "max buy" level. New CEO in Jun '22. Quarterly comparisons through Dec '22 have been above the +25% minimum earnings guideline (C criteria). Annual earnings history has been strong since its $14 IPO in Oct '20.
>>> FEATURED STOCK ARTICLE : Big Volume-Driven Gain for Best-Ever Close - 1/31/2023 |
View all notes |
Set NEW NOTE alert |
Company Profile |
SEC
News |
Chart |
Request a new note
C
A
S
I |
|
|
|
THESE ARE NOT BUY RECOMMENDATIONS!
Comments contained in the body of this report are technical
opinions only. The material herein has been obtained
from sources believed to be reliable and accurate, however,
its accuracy and completeness cannot be guaranteed.
This site is not an investment advisor, hence it does
not endorse or recommend any securities or other investments.
Any recommendation contained in this report may not
be suitable for all investors and it is not to be deemed
an offer or solicitation on our part with respect to
the purchase or sale of any securities. All trademarks,
service marks and trade names appearing in this report
are the property of their respective owners, and are
likewise used for identification purposes only.
This report is a service available
only to active Paid Premium Members.
You may opt-out of receiving report notifications
at any time. Questions or comments may be submitted
by writing to Premium Membership Services 665 S.E. 10 Street, Suite 201 Deerfield Beach, FL 33441-5634 or by calling 1-800-965-8307
or 954-785-1121.
|
|
|