You are not logged in.
This means you
CAN ONLY VIEW reports that were published prior to Monday, March 31, 2025.
You
MUST UPGRADE YOUR MEMBERSHIP if you want to see any current reports.
AFTER MARKET UPDATE - TUESDAY, JANUARY 31ST, 2023
Previous After Market Report Next After Market Report >>>
|
|
|
|
DOW |
+368.95 |
34,086.04 |
+1.09% |
|
Volume |
1,288,140,533 |
+62% |
|
Volume |
5,657,399,100 |
+11% |
|
NASDAQ |
+190.74 |
11,584.55 |
+1.67% |
|
Advancers |
2,540 |
84% |
|
Advancers |
3,445 |
76% |
|
S&P 500 |
+58.83 |
4,076.60 |
+1.46% |
|
Decliners |
471 |
16% |
|
Decliners |
1,102 |
24% |
|
Russell 2000 |
+46.22 |
1,931.94 |
+2.45% |
|
52 Wk Highs |
104 |
|
|
52 Wk Highs |
141 |
|
|
S&P 600 |
+31.29 |
1,266.36 |
+2.53% |
|
52 Wk Lows |
4 |
|
|
52 Wk Lows |
31 |
|
|
 |
Leadership Improved as Indices Rose With Higher Volume Totals
Kenneth J. Gruneisen - Passed the CAN SLIM® Master's Exam
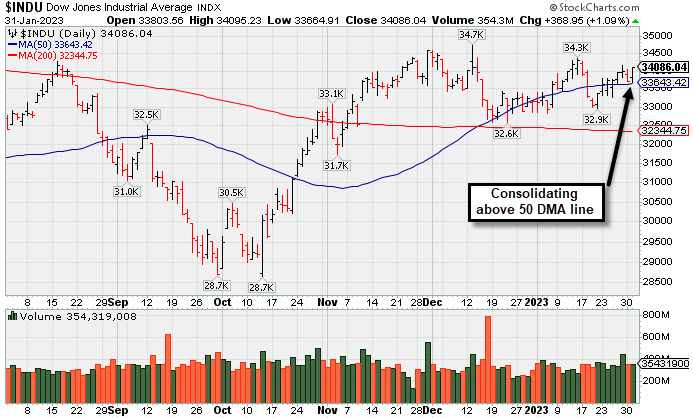
The Dow climbed 368 points, while the Nasdaq Composite gained 1.7%. The S&P 500 ended 1.5% higher, with all sectors finishing in positive territory. For the month, the S&P 500 climbed 6.2% to notch its best January since 2019, while the Nasdaq Composite advanced 10.7%. The Dow added 2.8%. Volume totals were higher than the prior session on the NYSE and on the Nasdaq exchange, indicative of an increase in institutional buying demand. Breadth was clearly posiiive as advancers led decliners by more than a 5-1 margin on the NYSE and by more than a 3-1 margin the Nasdaq exchange. Leadership improved as there were 48 high-ranked companies from the Leaders List that hit new 52-week highs and were listed on the BreakOuts Page versus the total of 18 on the prior session. New 52-week highs totals expanded and solidly outnumbered new 52-week lows on both the NYSE and the Nasdaq exchange. The major indices are in a confirmed uptrend (M criteria). Disciplined investors have a green light for making new buys only in stocks matching all key criteria of the fact-based investment system.
PICTURED: The Dow Jones Industrial Average is consolidating above its 50-day moving average (DMA) line.
U.S. equities finished higher Tuesday as investors await tomorrow’s interest rate decision from the Federal Reserve (Fed). On the data front, the Employment Cost Index, the Fed’s preferred measure of wages, came in softer-than-expected, climbing 1% in the fourth quarter versus the expected 1.1% climb. The slower pace adds to signs of slowing inflation and reinforces expectations for a smaller interest rate hike. Meanwhile, the FHFA House Price Index fell 0.1% month-over-month in November while S&P CoreLogic’s House Price Indices showed year-over-year price increases slowed. The MNI Chicago Purchasing Managers’ Index (PMI) unexpectedly slipped further into contractionary territory, coming in at 44.3 in January. Rounding out the data docket, the Conference Board Consumer Confidence Survey unexpectedly fell to 107.1 in January as consumers assess the global economic outlook.
Treasuries strengthened, with the yield on the benchmark 10-year note shedding three basis points (0.03%) to 3.51%, while the 30-year bond dipped one basis point (0.01%) to 3.64%. The yield on the two-year note, which is more sensitive to changes in Fed policy, fell four basis points (0.04%) to 4.20%. In commodities, West Texas Intermediate (WTI) crude added 1.5% to $79.03/barrel amid a weakening U.S. dollar and reports that demand for domestic crude products rose in November. WTI crude declined for the month as global economic concerns weighed on prices. |
 Kenneth J. Gruneisen started out as a licensed stockbroker in August 1987, a couple of months prior to the historic stock market crash that took the Dow Jones Industrial Average down -22.6% in a single day. He has published daily fact-based fundamental and technical analysis on high-ranked stocks online for two decades. Through FACTBASEDINVESTING.COM, Kenneth provides educational articles, news, market commentary, and other information regarding proven investment systems that work in good times and bad.
Comments contained in the body of this report are technical opinions only and are not necessarily those of Gruneisen Growth Corp. The material herein has been obtained from sources believed to be reliable and accurate, however, its accuracy and completeness cannot be guaranteed. Our firm, employees, and customers may effect transactions, including transactions contrary to any recommendation herein, or have positions in the securities mentioned herein or options with respect thereto. Any recommendation contained in this report may not be suitable for all investors and it is not to be deemed an offer or solicitation on our part with respect to the purchase or sale of any securities. |
|
 |
Retail, Financial, Tech and Commodity-Linked Groups Rose
Kenneth J. Gruneisen - Passed the CAN SLIM® Master's Exam
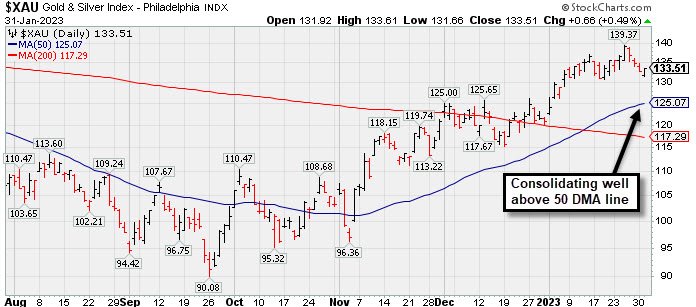
The Retail Index ($RLX +2.24%) notched a solid gain and the financial indexes also posted influential gains on Tuesday as the Broker/Dealer Index ($XBD +1.31%) and Bank Index ($BKX +1.69%) both rose. The tech sector had a positive bias as the Semiconductor Index ($SOX +1.93%), Networking Index ($NWX +1.90%), and Biotech Index ($BTK +1.68%) each posted solid gains. The Gold & Silver Index ($XAU +0.49%) and Oil Services Index ($OSX +1.81%) also rose while the Integrated Oil Index ($XOI +0.09%) was little changed.
PICTURED: The Gold & Silver Index ($XAU +0.49%) is consolidating well above its 50-day moving average (DMA) line.
| Oil Services |
$OSX |
93.58 |
+1.67 |
+1.81% |
+11.59% |
| Integrated Oil |
$XOI |
1,860.99 |
+1.65 |
+0.09% |
+4.13% |
| Semiconductor |
$SOX |
2,921.92 |
+55.23 |
+1.93% |
+15.39% |
| Networking |
$NWX |
826.29 |
+15.43 |
+1.90% |
+5.49% |
| Broker/Dealer |
$XBD |
490.92 |
+6.35 |
+1.31% |
+9.30% |
| Retail |
$RLX |
3,083.71 |
+67.60 |
+2.24% |
+11.97% |
| Gold & Silver |
$XAU |
133.51 |
+0.66 |
+0.49% |
+10.47% |
| Bank |
$BKX |
112.93 |
+1.87 |
+1.69% |
+11.98% |
| Biotech |
$BTK |
5,595.88 |
+92.52 |
+1.68% |
+5.96% |
|
|
|
 |
Big Volume-Driven Gain for Best-Ever Close
Kenneth J. Gruneisen - Passed the CAN SLIM® Master's Exam
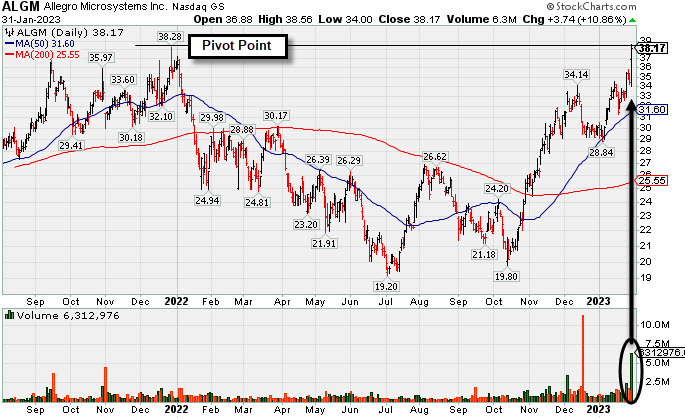
Allegro Microsystems Inc (ALGM +$3.74 or +10.86% to $38.17) was highlighted in yellow with pivot point cited based on its 12/28/21 high plus 10 cents in the earlier mid-day report (read here). It hit a new all-time high with today's big gain backed by +378% above average volume after a deep 12-month consolidation. Subsequent gains and a strong close above the pivot point may help clinch a technical buy signal.
The company hails from the Elec-Semiconductor Mfg group which is currently ranked 110th on the 197 Industry Groups list. Quarterly comparisons through Dec '22 have been above the +25% minimum earnings guideline (C criteria). Annual earnings history has been strong since its $14 IPO in Oct '20. ALGM has a new CEO as of Jun '22.
The number of top-rated funds owning its shares rose from 341 in Mar '22 to 425 in Dec '22, a reassuringn sign concerning the I criteria. However, the current Up/Down Volume Ratio of 0.8 is an unbiased indication its shares have encountered some distributional pressure over the past 50 days. |
|
|
Color Codes Explained :
Y - Better candidates highlighted by our
staff of experts.
G - Previously featured
in past reports as yellow but may no longer be buyable under the
guidelines.
***Last / Change / Volume data in this table is the closing quote data***
Symbol/Exchange
Company Name
Industry Group |
PRICE |
CHANGE
(%Change) |
Day High |
Volume
(% DAV)
(% 50 day avg vol) |
52 Wk Hi
% From Hi |
Featured
Date |
Price
Featured |
Pivot Featured |
|
Max Buy |
 CMC
-
NYSE
CMC
-
NYSE
Commercial Metals Co
METALS and MINING - Steel and Iron
|
$54.27
|
+0.39
0.72% |
$54.29
|
924,729
90.57% of 50 DAV
50 DAV is 1,021,000
|
$56.88
-4.59%
|
10/14/2022
|
$41.61
|
PP = $44.45
|
|
MB = $46.67
|
Most Recent Note - 1/30/2023 6:05:53 PM
G - Pullled back with below average volume for 2nd small loss. Its 50 DMA line ($50.10) defines important near-term support to watch on pullbacks. Fundamentals remain strong.
>>> FEATURED STOCK ARTICLE : Pulling Back After Rallying From 50-Day Moving Average Line - 1/18/2023 |
View all notes |
Set NEW NOTE alert |
Company Profile |
SEC
News |
Chart |
Request a new note
C
A
S
I |
GPK
-
NYSE
Graphic Packaging Hldg
CONSUMER NON-DURABLES - Packaging and Containers
|
$24.09
|
+0.92
3.97% |
$24.20
|
4,842,421
168.68% of 50 DAV
50 DAV is 2,870,800
|
$24.07
0.08%
|
10/25/2022
|
$22.75
|
PP = $24.17
|
|
MB = $25.38
|
 Most Recent Note - 1/31/2023 6:09:36 PM
Y - Hit a new high challlenging its pivot point with +68% above average volume behind today's big gain. Disciplined investors know that gains above a stock's pivot point must be backed by at least +40% above average volume to trigger a proper technical buy signal.
>>> FEATURED STOCK ARTICLE : Graphic Packaging Perched Near Pivot Point - 1/27/2023 |
View all notes |
Set NEW NOTE alert |
Company Profile |
SEC
News |
Chart |
Request a new note
C
A
S
I |
GFF
-
NYSE
Griffon Corporation
MATERIALS and CONSTRUCTION - General Building Materials
|
$40.88
|
+1.48
3.76% |
$40.88
|
595,473
122.27% of 50 DAV
50 DAV is 487,000
|
$40.74
0.34%
|
11/10/2022
|
$34.13
|
PP = $35.02
|
|
MB = $36.77
|
Most Recent Note - 1/31/2023 6:08:24 PM
G - Hit a new 52-week high and finished at the session high today with a solid gain backed by +22% above average volume. Its 50 DMA line ($36.63) defines near-term support to watch on pullbacks. Reported Sep '22 quarterly earnings +230% on +24% sales revenues versus the year ago period.
>>> FEATURED STOCK ARTICLE : Showed Resilience Following Negative Reversal at 52-Week High - 1/19/2023 |
View all notes |
Set NEW NOTE alert |
Company Profile |
SEC
News |
Chart |
Request a new note
C
A
S
I |
TITN
-
NASDAQ
Titan Machinery Inc
SPECIALTY RETAIL
|
$43.94
|
+0.12
0.27% |
$44.28
|
392,155
158.13% of 50 DAV
50 DAV is 248,000
|
$44.85
-2.03%
|
1/13/2023
|
$40.10
|
PP = $44.45
|
|
MB = $46.67
|
Most Recent Note - 1/30/2023 6:04:29 PM
Y - Ended near the middle of iits intra-day range today after hitting a new all-time high with its 7th consecutive gain. The prior high in the $38 area defines important support to watch along with its 50 DMA line ($39.60). A new pivot point was recently cited based on its 12/01/22 high plus 10 cents. See the latest FSU analysis for more details and a new annotated graph.
>>> FEATURED STOCK ARTICLE : 7th Consecutive Gain for Titan - 1/30/2023 |
View all notes |
Set NEW NOTE alert |
Company Profile |
SEC
News |
Chart |
Request a new note
C
A
S
I |
MYE
-
NYSE
Myers Industries Inc
Containers/Packaging
|
$24.08
|
+0.52
2.21% |
$24.31
|
169,669
104.09% of 50 DAV
50 DAV is 163,000
|
$25.55
-5.75%
|
12/8/2022
|
$23.94
|
PP = $25.65
|
|
MB = $26.93
|
Most Recent Note - 1/31/2023 6:11:00 PM
Y - Posted a solid gain today with average volume. Found support while testing support at its 50 DMA line ($23.14) in recent weeks. Faces little resistance due to overhead supply up to the $25.50 level.
>>> FEATURED STOCK ARTICLE : Myers Quietly Consolidating Within Striking Distance of Prior High - 1/20/2023 |
View all notes |
Set NEW NOTE alert |
Company Profile |
SEC
News |
Chart |
Request a new note
C
A
S
I |
Symbol/Exchange
Company Name
Industry Group |
PRICE |
CHANGE
(%Change) |
Day High |
Volume
(% DAV)
(% 50 day avg vol) |
52 Wk Hi
% From Hi |
Featured
Date |
Price
Featured |
Pivot Featured |
|
Max Buy |
BOX
-
NYSE
Box Inc Cl A
Computer Sftwr-Database
|
$31.99
|
+0.19
0.60% |
$32.19
|
1,438,786
108.59% of 50 DAV
50 DAV is 1,325,000
|
$33.04
-3.18%
|
12/12/2022
|
$29.83
|
PP = $29.57
|
|
MB = $31.05
|
Most Recent Note - 1/30/2023 6:06:49 PM
Y - Pulled back today with lighter volume after challenging prior highs in the $31-32 area. Its 50 DMA line ($29.93) defines important near-term support to watch. Faces very little resistance due to overhead supply up to the $32 level. Quarterly and annual earnings increases have been strong and steady.
>>> FEATURED STOCK ARTICLE : Perched Above "Max Buy" Level Near Recent Highs - 1/24/2023 |
View all notes |
Set NEW NOTE alert |
Company Profile |
SEC
News |
Chart |
Request a new note
C
A
S
I |
STRL
-
NASDAQ
Sterling Infrastructure
MATERIALS and; CONSTRUCTION - Heavy Construction
|
$36.39
|
+1.92
5.57% |
$36.42
|
429,705
193.56% of 50 DAV
50 DAV is 222,000
|
$34.89
4.30%
|
12/14/2022
|
$32.41
|
PP = $33.72
|
|
MB = $35.41
|
Most Recent Note - 1/31/2023 1:33:50 PM
Y - Hitting a new high with today's big gain backed by light volume. Gain on 1/27/23 with +64% above average volume cleared the previously cited pivot point. The 50 DMA line ($32.43) and recent low ($30.60 on 1/19/23) define near-term support levels to watch on pullbacks.
>>> FEATURED STOCK ARTICLE : Gain With Average Volume While Perched Near Recent Highs - 1/26/2023 |
View all notes |
Set NEW NOTE alert |
Company Profile |
SEC
News |
Chart |
Request a new note
C
A
S
I |
PERI
-
NASDAQ
Perion Networks Ltd
Comml Svcs-Advertising
|
$33.50
|
+0.07
0.21% |
$33.58
|
619,841
135.93% of 50 DAV
50 DAV is 456,000
|
$33.97
-1.38%
|
1/25/2023
|
$31.79
|
PP = $33.19
|
|
MB = $34.85
|
Most Recent Note - 1/30/2023 12:43:58 PM
Y - Gain today marked by above average volume is adding to a recent spurt, hitting new multi-year highs and rising above its pivot point based upon its 11/15/21 high plus 10 cents. Triggered a technical buy signal on the prior session. See the latest FSU analysis for more details and an annotated graph.
>>> FEATURED STOCK ARTICLE : Spurt of Volume-Driven Gains Challenging Prior High - 1/25/2023 |
View all notes |
Set NEW NOTE alert |
Company Profile |
SEC
News |
Chart |
Request a new note
C
A
S
I |
ALGM
-
NASDAQ
Allegro Microsystems Inc
Elec-Semiconductor Mfg
|
$38.17
|
+3.74
10.86% |
$38.56
|
6,311,407
478.14% of 50 DAV
50 DAV is 1,320,000
|
$35.85
6.47%
|
1/31/2023
|
$37.80
|
PP = $38.38
|
|
MB = $40.30
|
Most Recent Note - 1/31/2023 6:04:07 PM
Y - Posted a big gain with +378% above average volume for a best-ever close today after highlighted in yellow with pivot point cited based on its 12/28/21 high plus 10 cents in the earlier mid-day report. After a deep 12-month consolidation, subsequent gains and a strong close above the pivot point may clinch a technical buy signal. New CEO in Jun '22. Quarterly comparisons through Dec '22 have been above the +25% minimum earnings guideline (C criteria). Annual earnings history has been strong since its $14 IPO in Oct '20. See the latest FSU analysis for more details and a new annotated graph.
>>> FEATURED STOCK ARTICLE : Big Volume-Driven Gain for Best-Ever Close - 1/31/2023 |
View all notes |
Set NEW NOTE alert |
Company Profile |
SEC
News |
Chart |
Request a new note
C
A
S
I |
|
|
|
THESE ARE NOT BUY RECOMMENDATIONS!
Comments contained in the body of this report are technical
opinions only. The material herein has been obtained
from sources believed to be reliable and accurate, however,
its accuracy and completeness cannot be guaranteed.
This site is not an investment advisor, hence it does
not endorse or recommend any securities or other investments.
Any recommendation contained in this report may not
be suitable for all investors and it is not to be deemed
an offer or solicitation on our part with respect to
the purchase or sale of any securities. All trademarks,
service marks and trade names appearing in this report
are the property of their respective owners, and are
likewise used for identification purposes only.
This report is a service available
only to active Paid Premium Members.
You may opt-out of receiving report notifications
at any time. Questions or comments may be submitted
by writing to Premium Membership Services 665 S.E. 10 Street, Suite 201 Deerfield Beach, FL 33441-5634 or by calling 1-800-965-8307
or 954-785-1121.
|
|
|


 X
X