You are not logged in.
This means you
CAN ONLY VIEW reports that were published prior to Monday, March 31, 2025.
You
MUST UPGRADE YOUR MEMBERSHIP if you want to see any current reports.
AFTER MARKET UPDATE - MONDAY, JANUARY 30TH, 2023
Previous After Market Report Next After Market Report >>>
|
|
|
|
DOW |
-260.99 |
33,717.09 |
-0.77% |
|
Volume |
794,803,400 |
+4% |
|
Volume |
5,110,192,900 |
-18% |
|
NASDAQ |
-227.90 |
11,393.81 |
-1.96% |
|
Advancers |
938 |
31% |
|
Advancers |
1,394 |
30% |
|
S&P 500 |
-52.79 |
4,017.77 |
-1.30% |
|
Decliners |
2,052 |
69% |
|
Decliners |
3,221 |
70% |
|
Russell 2000 |
-25.74 |
1,885.72 |
-1.35% |
|
52 Wk Highs |
66 |
|
|
52 Wk Highs |
92 |
|
|
S&P 600 |
-13.52 |
1,235.07 |
-1.08% |
|
52 Wk Lows |
8 |
|
|
52 Wk Lows |
20 |
|
|
 |
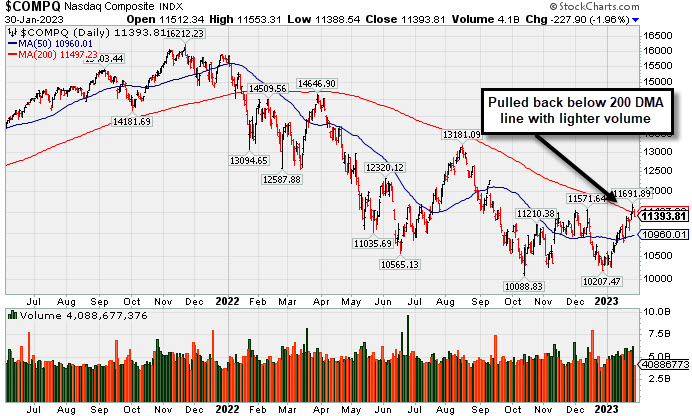
Leadership Waned as Major Indices Pulled Back
Kenneth J. Gruneisen - Passed the CAN SLIM® Master's Exam
The Dow lost 260 points and the Nasdaq Composite declined 2%. The S&P 500 decreased 1.3%; however, the index is currently on track for its best January since 2019. Volume totals were mixed, higher than the prior session on the NYSE and lighter on the Nasdaq exchange. Breadth was negative as decliners led advancers by more than a 2-1 margin on the NYSE and on the Nasdaq exchange. Leadership thinned as there were 18 high-ranked companies from the Leaders List that hit new 52-week highs and were listed on the BreakOuts Page versus the total of 50 on the prior session. New 52-week highs totals contracted yet still outnumbered new 52-week lows on both the NYSE and the Nasdaq exchange. The major indices are in a confirmed uptrend (M criteria). Disciplined investors have a green light for making new buys only in stocks matching all key criteria of the fact-based investment system.
PICTURED: The Nasdaq Composite Index pulled back below its 200-day moving average (DMA) line with a loss on lighter volume.
U.S. equities finished lower Monday as investors prepare for a busy week of corporate earnings and the Federal Reserve’s (Fed) interest rate decision along with its counterparts in London and Frankfurt. Ten of the eleven S&P sectors finished in negative territory, with Energy the worst of laggards.
On the data front, December’s Dallas Federal Manufacturing Activity came in stronger-than-expected declining 8.4 versus the forecasted -15. In corporate news, the Ford Motor Company (F -2.86%) announced their plans to lower prices on an average Mustang Mach-E crossover model by $4,500 and boost its production on the electric vehicle, following a similar announcement from Tesla days earlier. Meanwhile, American Express Co. (AXP +0.20%) shares surged after reporting earnings Friday amid optimism in its forward-looking guidance despite missing fourth quarter expectations.
Treasury yields gained momentum ahead of the Fed’s first 2023 meeting. The yield on the 10-year note increased three basis points (0.03%) to 3.54%, while the 30-year bond yield gained two basis points (0.02%) at 3.65%. The yield on the two-year note climbed four basis points (0.04%) to 4.24%. In commodities, West Texas Intermediate (WTI) crude fell 2.4% to $77.79/barrel amid signs of strong Russian exports despite recent sanctions from the European Union’s ban and the Group of Seven’s (G7) price cap. Meanwhile, ministers from the Organization of the Petroleum Exporting Countries and its allies (OPEC+) are slated to gather Wednesday. Analyst forecast the current output policy may remain unchanged.
|
 Kenneth J. Gruneisen started out as a licensed stockbroker in August 1987, a couple of months prior to the historic stock market crash that took the Dow Jones Industrial Average down -22.6% in a single day. He has published daily fact-based fundamental and technical analysis on high-ranked stocks online for two decades. Through FACTBASEDINVESTING.COM, Kenneth provides educational articles, news, market commentary, and other information regarding proven investment systems that work in good times and bad.
Comments contained in the body of this report are technical opinions only and are not necessarily those of Gruneisen Growth Corp. The material herein has been obtained from sources believed to be reliable and accurate, however, its accuracy and completeness cannot be guaranteed. Our firm, employees, and customers may effect transactions, including transactions contrary to any recommendation herein, or have positions in the securities mentioned herein or options with respect thereto. Any recommendation contained in this report may not be suitable for all investors and it is not to be deemed an offer or solicitation on our part with respect to the purchase or sale of any securities. |
|
 |
Retail, Financial, Tech, and Commodity-Linked Groups Lost Ground
Kenneth J. Gruneisen - Passed the CAN SLIM® Master's Exam
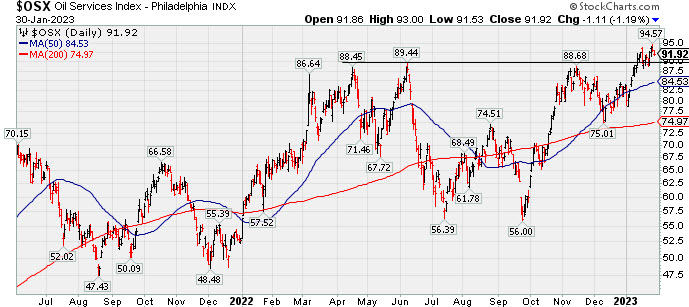
The Retail Index ($RLX -0.90%),Bank Index ($BKX -0.91%), and Broker/Dealer Index ($XBD -0.58%) each lost less than -1% on Monday, but all created a drag on the major averages. Commodiity-linked groups lost ground as the Gold & Silver Index ($XAU -1.43%), Oil Services Index ($OSX -1.19%) and Integrated Oil Index ($XOI -2.47%) ended unanimously lower. The Semiconductor Index ($SOX -2.67%), Networking Index ($NWX -1.24%), and Biotech Index ($BTK -1.58%) also finished unanimoulsy lower.
PICTURED: The Oil Services Index ($OSX -1.19%) pulled back today but has recently been rising above its 2022 highs.
| Oil Services |
$OSX |
91.92 |
-1.11 |
-1.19% |
+9.61% |
| Integrated Oil |
$XOI |
1,859.34 |
-47.12 |
-2.47% |
+4.03% |
| Semiconductor |
$SOX |
2,866.69 |
-78.58 |
-2.67% |
+13.21% |
| Networking |
$NWX |
810.86 |
-10.21 |
-1.24% |
+3.52% |
| Broker/Dealer |
$XBD |
484.57 |
-2.82 |
-0.58% |
+7.89% |
| Retail |
$RLX |
3,016.11 |
-27.43 |
-0.90% |
+9.52% |
| Gold & Silver |
$XAU |
132.86 |
-1.93 |
-1.43% |
+9.93% |
| Bank |
$BKX |
111.05 |
-1.02 |
-0.91% |
+10.12% |
| Biotech |
$BTK |
5,503.36 |
-88.55 |
-1.58% |
+4.21% |
|
|
|
 |
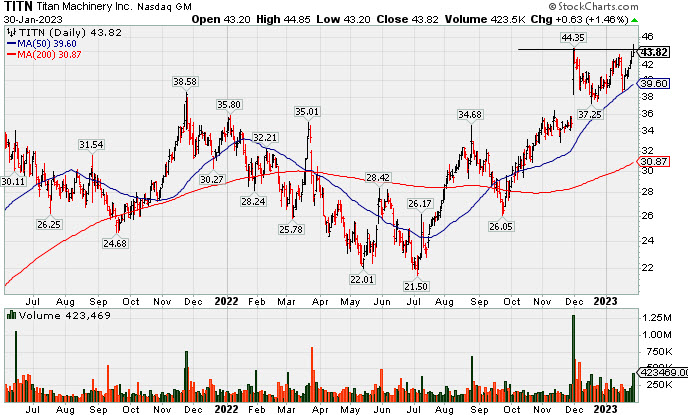
7th Consecutive Gain for Titan
Kenneth J. Gruneisen - Passed the CAN SLIM® Master's Exam
Titan Machinery Inc (TITN +0.63 ort +1.46% to $43.82) posted a 7th consecutive gain today backbed by higher volume. It found support when recently consolidating near the prior high in the $38 area which defines important support to watch along with its 50-day moving average (DMA) line ($39.60). Its color code has been changed to yellow with a new pivot point cited based on its 12/01/22 high plus 10 cents. Subsequent gains above the pivot point backed by at least +40% above average volume may trigger a new technical buy signal. A valid secondary buy point also may be considered up to 5% above the recent high since it found support at the 10-week moving average line.
Fundamentals remain strong after reporting Oct '22 quarterly earnings +91% on +47% sales revenues. It currently has the highest possible earnings Per Share Rating of 99. Following years of losses it has shown strong earnings growth for FY '19-22. TITN was highlighted in yellow with pivot point cited based on its 11/23/21 high plus 10 cents in the 11/30/22 mid-day report (read here). It was last shown in greater detail on 1/13/23 with an annotated graph under the headline, "Forming New Base for Past 7 Weeks".
The small supply of only 22.7 million shares outstanding (S criteria) can contribute to greater price volatility in the event of institutional buying or selling. The number of top-rated funds owning its shares rose from 241 in Dec '20 to 361 in Dec '22, a reassuring sign concerning the I criteria. Its current Up/Down Volume Ratio of 1.2 is an unbiased indication its shares have been under slight accumulation over the past 50 days. |
|
|
Color Codes Explained :
Y - Better candidates highlighted by our
staff of experts.
G - Previously featured
in past reports as yellow but may no longer be buyable under the
guidelines.
***Last / Change / Volume data in this table is the closing quote data***
Symbol/Exchange
Company Name
Industry Group |
PRICE |
CHANGE
(%Change) |
Day High |
Volume
(% DAV)
(% 50 day avg vol) |
52 Wk Hi
% From Hi |
Featured
Date |
Price
Featured |
Pivot Featured |
|
Max Buy |
 CMC
-
NYSE
CMC
-
NYSE
Commercial Metals Co
METALS and MINING - Steel and Iron
|
$53.88
|
-0.99
-1.80% |
$55.21
|
830,610
80.64% of 50 DAV
50 DAV is 1,030,000
|
$56.88
-5.27%
|
10/14/2022
|
$41.61
|
PP = $44.45
|
|
MB = $46.67
|
 Most Recent Note - 1/30/2023 6:05:53 PM
G - Pullled back with below average volume for 2nd small loss. Its 50 DMA line ($50.10) defines important near-term support to watch on pullbacks. Fundamentals remain strong.
>>> FEATURED STOCK ARTICLE : Pulling Back After Rallying From 50-Day Moving Average Line - 1/18/2023 |
View all notes |
Set NEW NOTE alert |
Company Profile |
SEC
News |
Chart |
Request a new note
C
A
S
I |
GPK
-
NYSE
Graphic Packaging Hldg
CONSUMER NON-DURABLES - Packaging and Containers
|
$23.17
|
-0.59
-2.48% |
$23.83
|
3,777,220
132.77% of 50 DAV
50 DAV is 2,845,000
|
$24.07
-3.74%
|
10/25/2022
|
$22.75
|
PP = $24.17
|
|
MB = $25.38
|
Most Recent Note - 1/27/2023 5:58:40 PM
Y - Paused today after 5 consecutive gains approaching prior highs. Faces very little resistance due to overhead supply up to the $24 level. Subsequent gains above the pivot point backed by at least +40% above average volume may trigger a technical buy signal. See the latest FSU analysis for more details and a new annotated graph.
>>> FEATURED STOCK ARTICLE : Graphic Packaging Perched Near Pivot Point - 1/27/2023 |
View all notes |
Set NEW NOTE alert |
Company Profile |
SEC
News |
Chart |
Request a new note
C
A
S
I |
GFF
-
NYSE
Griffon Corporation
MATERIALS and CONSTRUCTION - General Building Materials
|
$39.40
|
-0.35
-0.88% |
$40.14
|
325,168
66.63% of 50 DAV
50 DAV is 488,000
|
$40.74
-3.29%
|
11/10/2022
|
$34.13
|
PP = $35.02
|
|
MB = $36.77
|
Most Recent Note - 1/30/2023 6:08:10 PM
G - Pulled back from its 52-week high with today's 2nd consecutive small loss with below average volume. Its 50 DMA line ($36.49) defines near-term support above recent lows in the $33.82 area. Reported Sep '22 quarterly earnings +230% on +24% sales revenues versus the year ago period.
>>> FEATURED STOCK ARTICLE : Showed Resilience Following Negative Reversal at 52-Week High - 1/19/2023 |
View all notes |
Set NEW NOTE alert |
Company Profile |
SEC
News |
Chart |
Request a new note
C
A
S
I |
TITN
-
NASDAQ
Titan Machinery Inc
SPECIALTY RETAIL
|
$43.82
|
+0.63
1.46% |
$44.85
|
423,469
174.99% of 50 DAV
50 DAV is 242,000
|
$44.35
-1.20%
|
1/13/2023
|
$40.10
|
PP = $44.45
|
|
MB = $46.67
|
Most Recent Note - 1/30/2023 6:04:29 PM
Y - Ended near the middle of iits intra-day range today after hitting a new all-time high with its 7th consecutive gain. The prior high in the $38 area defines important support to watch along with its 50 DMA line ($39.60). A new pivot point was recently cited based on its 12/01/22 high plus 10 cents. See the latest FSU analysis for more details and a new annotated graph.
>>> FEATURED STOCK ARTICLE : 7th Consecutive Gain for Titan - 1/30/2023 |
View all notes |
Set NEW NOTE alert |
Company Profile |
SEC
News |
Chart |
Request a new note
C
A
S
I |
MYE
-
NYSE
Myers Industries Inc
Containers/Packaging
|
$23.56
|
-0.15
-0.63% |
$23.73
|
61,041
37.22% of 50 DAV
50 DAV is 164,000
|
$25.55
-7.79%
|
12/8/2022
|
$23.94
|
PP = $25.65
|
|
MB = $26.93
|
Most Recent Note - 1/30/2023 6:09:09 PM
Y - Pulled back today for a 2nd consecutive small loss on light volume. Found support while testing support at its 50 DMA line ($23.10) last week. Faces little resistance due to overhead supply up to the $25.50 level.
>>> FEATURED STOCK ARTICLE : Myers Quietly Consolidating Within Striking Distance of Prior High - 1/20/2023 |
View all notes |
Set NEW NOTE alert |
Company Profile |
SEC
News |
Chart |
Request a new note
C
A
S
I |
Symbol/Exchange
Company Name
Industry Group |
PRICE |
CHANGE
(%Change) |
Day High |
Volume
(% DAV)
(% 50 day avg vol) |
52 Wk Hi
% From Hi |
Featured
Date |
Price
Featured |
Pivot Featured |
|
Max Buy |
BOX
-
NYSE
Box Inc Cl A
Computer Sftwr-Database
|
$31.80
|
-0.32
-1.00% |
$32.23
|
822,897
62.11% of 50 DAV
50 DAV is 1,325,000
|
$33.04
-3.75%
|
12/12/2022
|
$29.83
|
PP = $29.57
|
|
MB = $31.05
|
Most Recent Note - 1/30/2023 6:06:49 PM
Y - Pulled back today with lighter volume after challenging prior highs in the $31-32 area. Its 50 DMA line ($29.93) defines important near-term support to watch. Faces very little resistance due to overhead supply up to the $32 level. Quarterly and annual earnings increases have been strong and steady.
>>> FEATURED STOCK ARTICLE : Perched Above "Max Buy" Level Near Recent Highs - 1/24/2023 |
View all notes |
Set NEW NOTE alert |
Company Profile |
SEC
News |
Chart |
Request a new note
C
A
S
I |
STRL
-
NASDAQ
Sterling Infrastructure
MATERIALS and; CONSTRUCTION - Heavy Construction
|
$34.47
|
-0.03
-0.09% |
$34.60
|
217,053
96.90% of 50 DAV
50 DAV is 224,000
|
$34.89
-1.20%
|
12/14/2022
|
$32.41
|
PP = $33.72
|
|
MB = $35.41
|
Most Recent Note - 1/27/2023 6:02:56 PM
Y - Posted a gain today with +64% above average volume for a best ever close while rallying above the previously cited pivot point. The 50 DMA line ($32.26) and recent low ($30.60 on 1/19/23) define near-term support levels to watch following its recently noted failed breakout attempt. Highlighted in yellow with pivot point cited based on its 11/08/22 high plus 10 cents in the 12/14/22 mid-day report. Confirming volume-driven gains for a new high would be a reassuring sign of fresh institutional buying demand. See the latest FSU analysis for more details and an annotated graph.
>>> FEATURED STOCK ARTICLE : Gain With Average Volume While Perched Near Recent Highs - 1/26/2023 |
View all notes |
Set NEW NOTE alert |
Company Profile |
SEC
News |
Chart |
Request a new note
C
A
S
I |
PERI
-
NASDAQ
Perion Networks Ltd
Comml Svcs-Advertising
|
$33.43
|
+0.20
0.60% |
$33.97
|
1,370,190
308.60% of 50 DAV
50 DAV is 444,000
|
$33.80
-1.09%
|
1/25/2023
|
$31.79
|
PP = $33.19
|
|
MB = $34.85
|
Most Recent Note - 1/30/2023 12:43:58 PM
Y - Gain today marked by above average volume is adding to a recent spurt, hitting new multi-year highs and rising above its pivot point based upon its 11/15/21 high plus 10 cents. Triggered a technical buy signal on the prior session. See the latest FSU analysis for more details and an annotated graph.
>>> FEATURED STOCK ARTICLE : Spurt of Volume-Driven Gains Challenging Prior High - 1/25/2023 |
View all notes |
Set NEW NOTE alert |
Company Profile |
SEC
News |
Chart |
Request a new note
C
A
S
I |
|
|
|
THESE ARE NOT BUY RECOMMENDATIONS!
Comments contained in the body of this report are technical
opinions only. The material herein has been obtained
from sources believed to be reliable and accurate, however,
its accuracy and completeness cannot be guaranteed.
This site is not an investment advisor, hence it does
not endorse or recommend any securities or other investments.
Any recommendation contained in this report may not
be suitable for all investors and it is not to be deemed
an offer or solicitation on our part with respect to
the purchase or sale of any securities. All trademarks,
service marks and trade names appearing in this report
are the property of their respective owners, and are
likewise used for identification purposes only.
This report is a service available
only to active Paid Premium Members.
You may opt-out of receiving report notifications
at any time. Questions or comments may be submitted
by writing to Premium Membership Services 665 S.E. 10 Street, Suite 201 Deerfield Beach, FL 33441-5634 or by calling 1-800-965-8307
or 954-785-1121.
|
|
|