You are not logged in.
This means you
CAN ONLY VIEW reports that were published prior to Monday, March 24, 2025.
You
MUST UPGRADE YOUR MEMBERSHIP if you want to see any current reports.
AFTER MARKET UPDATE - THURSDAY, FEBRUARY 2ND, 2023
Previous After Market Report Next After Market Report >>>
|
|
|
|
DOW |
+6.92 |
34,092.96 |
+0.02% |
|
Volume |
1,037,449,413 |
-7% |
|
Volume |
6,336,042,685 |
-11% |
|
NASDAQ |
+231.77 |
11,816.32 |
+2.00% |
|
Advancers |
2,227 |
72% |
|
Advancers |
3,147 |
69% |
|
S&P 500 |
+42.61 |
4,119.21 |
+1.05% |
|
Decliners |
855 |
28% |
|
Decliners |
1,428 |
31% |
|
Russell 2000 |
+28.87 |
1,960.81 |
+1.49% |
|
52 Wk Highs |
177 |
|
|
52 Wk Highs |
186 |
|
|
S&P 600 |
+18.82 |
1,285.18 |
+1.49% |
|
52 Wk Lows |
8 |
|
|
52 Wk Lows |
34 |
|
|
 |
Bullish Action Once Again Indicative of Institutional Buying Demand
Kenneth J. Gruneisen - Passed the CAN SLIM® Master's Exam
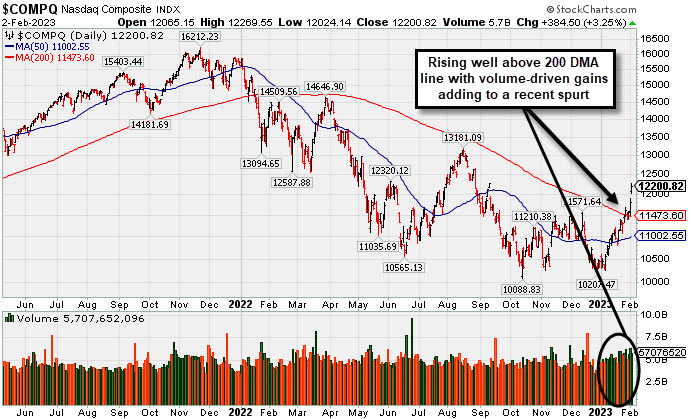
The Dow lost 39 points, dragged lower by Merck & Co Inc’s (MRK -3.29%) weak 2023 outlook. Meanwhile, the S&P 500 added 1.5% to rise to its highest level in five months and the Nasdaq Composite advanced 3.3% amid a rally in technology shares. Volume totals were mixed, lighter than the prior session on the NYSE and higher on the Nasdaq exchange, and overall actionm was indicative of an increase in institutional buying demand. Breadth again was clearly posiiive as advancers led decliners by almost a 3-1 margin on the NYSE and by more than a 2-1 margin the Nasdaq exchange. Leadership improved as there were 121 high-ranked companies from the Leaders List that hit new 52-week highs and were listed on the BreakOuts Page versus the total of 101 on the prior session. New 52-week highs totals expanded and solidly outnumbered new 52-week lows on both the NYSE and the Nasdaq exchange. The major indices are in a confirmed uptrend (M criteria). Disciplined investors have a green light for making new buys only in stocks matching all key criteria of the fact-based investment system.
PICTURED: The Nasdaq Composite Index has rebounded well above its 200-day moving average (DMA) line (red line) while adding to a recent spurt of volume-driven gains.
U.S. equities finished mixed on Thursday as investors digested key corporate earnings and the Federal Reserve’s (Fed) interest rate hike decision. Yesterday, the central bank downshifted the pace of interest rate hikes, opting to implement a 25 basis point (0.25%) increase. After the meeting, in his post-meeting presser, Fed Chair Jerome Powell signaled further rate hikes are necessary to curb inflation.
On the data front, fourth-quarter nonfarm productivity climbed more than expected, coming in at 3% versus the expected 2.4% climb, while unit labor costs came in softer than expected, rising 1.1%. Meanwhile, initial jobless claims unexpectedly fell in the week ended January 28, signaling the labor market remains tight. In corporate news, Meta Platforms Inc surpassed fourth-quarter revenue estimates and announced a $40 billion stock buyback program.
Treasuries strengthened, with the yield on the benchmark 10-year note down two basis points (0.02%) to 3.39%, while the 30-year bond yield dipped two basis points (0.02%) to 3.55%. The yield on the two-year note, which is more sensitive to changes in Fed policy, was unchanged at 4.09%. In commodities, West Texas Intermediate (WTI) crude fell 0.8% to $75.82/barrel despite reports of an impending ban on Russian oil products. The U.S. Dollar Index climbed 0.5% against a basket of major currencies amid a flurry of central bank decisions. |
 Kenneth J. Gruneisen started out as a licensed stockbroker in August 1987, a couple of months prior to the historic stock market crash that took the Dow Jones Industrial Average down -22.6% in a single day. He has published daily fact-based fundamental and technical analysis on high-ranked stocks online for two decades. Through FACTBASEDINVESTING.COM, Kenneth provides educational articles, news, market commentary, and other information regarding proven investment systems that work in good times and bad.
Comments contained in the body of this report are technical opinions only and are not necessarily those of Gruneisen Growth Corp. The material herein has been obtained from sources believed to be reliable and accurate, however, its accuracy and completeness cannot be guaranteed. Our firm, employees, and customers may effect transactions, including transactions contrary to any recommendation herein, or have positions in the securities mentioned herein or options with respect thereto. Any recommendation contained in this report may not be suitable for all investors and it is not to be deemed an offer or solicitation on our part with respect to the purchase or sale of any securities. |
|
 |
Retail and Semiconductor Indexes Led Gainers as Commodity-Linked Groups Fell
Kenneth J. Gruneisen - Passed the CAN SLIM® Master's Exam
The Retail Index ($RLX +4.32%) posted an influential gain while the Bank Index ($BKX +1.15%) also rose, meanwhile the Broker/Dealer Index ($XBD -0.35%) inched lower. The Semiconductor Index ($SOX +2.22%) led the tech sector higher while the Networking Index ($NWX +0.99%) also rose and the Biotech Index ($BTK +0.59%) followed with a smaller gain. Commodoity-linked groups had a negative bias as the Gold & Silver Index ($XAU -2.58%), Oil Services Index ($OSX -4.10%), and Integrated Oil Index ($XOI -2.66%) each suffered large losses.
PICTURED: The Integrated Oil Index ($XOI -2.66%) stalled after recently touching new multi-year higs, suffering losses and falling below its 50-day moving average (DMA) line. Its 200 DMA line and prior lows define the next important chart support to watch.
| Oil Services |
$OSX |
89.02 |
-3.81 |
-4.10% |
+6.15% |
| Integrated Oil |
$XOI |
1,766.67 |
-48.25 |
-2.66% |
-1.15% |
| Semiconductor |
$SOX |
3,141.84 |
+68.37 |
+2.22% |
+24.08% |
| Networking |
$NWX |
845.29 |
+8.33 |
+0.99% |
+7.91% |
| Broker/Dealer |
$XBD |
493.82 |
-1.71 |
-0.35% |
+9.95% |
| Retail |
$RLX |
3,274.48 |
+135.75 |
+4.32% |
+18.90% |
| Gold & Silver |
$XAU |
132.59 |
-3.51 |
-2.58% |
+9.71% |
| Bank |
$BKX |
114.87 |
+1.31 |
+1.15% |
+13.90% |
| Biotech |
$BTK |
5,644.50 |
+33.14 |
+0.59% |
+6.88% |
|
|
|
 |
Extended From Any Sound Base and Still Hitting New Highs
Kenneth J. Gruneisen - Passed the CAN SLIM® Master's Exam
Griffon Corporation (GFF +$1.02 or +2.49% to $42.04) hit a new 52-week high and finished near the session high today with its 3rd consecutive gain backed by +27% above average volume. It is extended from any sound base. Its 50-day moving average (DMA) line ($36.90) defines near-term support to watch on pullbacks.
Fundamentals remain strong after it reported Dec '22 quarterly earnings +121% on +10% sales revenues versus the year ago period, continuing its strong earniongs track record. It has a 99 Earnings Per Share Rating. Annual earnings (A criteria) growth has been strong and steady.
The company has only 57.1 million shares outstanding (S criteria) which can contribute to greater volatility in the event of institutional buying or selling. The number of top-dated funds owning its shares rose from 331 in Mar '22 to 376 in Dec '22. Its current Up/Down Volume Ratio of 2.4 is an unbiased indication its shares have been under accumulation over the past 50 days. It has an A Timeliness rating and an A Sponsorship Rating.
|
|
|
Color Codes Explained :
Y - Better candidates highlighted by our
staff of experts.
G - Previously featured
in past reports as yellow but may no longer be buyable under the
guidelines.
***Last / Change / Volume data in this table is the closing quote data***
Symbol/Exchange
Company Name
Industry Group |
PRICE |
CHANGE
(%Change) |
Day High |
Volume
(% DAV)
(% 50 day avg vol) |
52 Wk Hi
% From Hi |
Featured
Date |
Price
Featured |
Pivot Featured |
|
Max Buy |
 CMC
-
NYSE
CMC
-
NYSE
Commercial Metals Co
METALS and MINING - Steel and Iron
|
$56.04
|
+0.03
0.05% |
$56.42
|
995,028
96.23% of 50 DAV
50 DAV is 1,034,000
|
$56.88
-1.48%
|
10/14/2022
|
$41.61
|
PP = $44.45
|
|
MB = $46.67
|
Most Recent Note - 2/1/2023 5:44:11 PM
G - Posted a gain today with average volume and finished 16 cents off its best-ever close. It is extended from any sound base. Its 50 DMA line ($50.41) defines important near-term support to watch on pullbacks. Fundamentals remain strong. See the latest FSU analysis for more details and a new annotated graph.
>>> FEATURED STOCK ARTICLE : Extended From Any Sound Base and Perched Near High - 2/1/2023 |
View all notes |
Set NEW NOTE alert |
Company Profile |
SEC
News |
Chart |
Request a new note
C
A
S
I |
GPK
-
NYSE
Graphic Packaging Hldg
CONSUMER NON-DURABLES - Packaging and Containers
|
$23.82
|
+0.06
0.25% |
$23.86
|
2,225,096
74.60% of 50 DAV
50 DAV is 2,982,600
|
$24.20
-1.57%
|
10/25/2022
|
$22.75
|
PP = $24.17
|
|
MB = $25.38
|
Most Recent Note - 1/31/2023 6:09:36 PM
Y - Hit a new high challlenging its pivot point with +68% above average volume behind today's big gain. Disciplined investors know that gains above a stock's pivot point must be backed by at least +40% above average volume to trigger a proper technical buy signal.
>>> FEATURED STOCK ARTICLE : Graphic Packaging Perched Near Pivot Point - 1/27/2023 |
View all notes |
Set NEW NOTE alert |
Company Profile |
SEC
News |
Chart |
Request a new note
C
A
S
I |
GFF
-
NYSE
Griffon Corporation
MATERIALS and CONSTRUCTION - General Building Materials
|
$42.04
|
+1.02
2.49% |
$42.16
|
632,480
126.75% of 50 DAV
50 DAV is 499,000
|
$41.77
0.65%
|
11/10/2022
|
$34.13
|
PP = $35.02
|
|
MB = $36.77
|
 Most Recent Note - 2/2/2023 6:20:20 PM
G - Hit another new 52-week high with today's 3rd consecutive gain backed by +27% above average volume. Extended from any sound base. Its 50 DMA line ($36.90) defines near-term support to watch on pullbacks. Reported Dec '22 quarterly earnings +121 on +10% sales revenues versus the year ago period. See the latest FSU analysis for more details and a new annotated graph.
>>> FEATURED STOCK ARTICLE : Extended From Any Sound Base and Still Hitting New Highs - 2/2/2023 |
View all notes |
Set NEW NOTE alert |
Company Profile |
SEC
News |
Chart |
Request a new note
C
A
S
I |
TITN
-
NASDAQ
Titan Machinery Inc
SPECIALTY RETAIL
|
$44.91
|
+0.82
1.86% |
$45.35
|
303,629
120.01% of 50 DAV
50 DAV is 253,000
|
$44.85
0.13%
|
1/13/2023
|
$40.10
|
PP = $44.45
|
|
MB = $46.67
|
Most Recent Note - 2/2/2023 6:23:32 PM
Y - Wedging higher, it hit yet another new all-time high with volume +18% above average behind today's 10th consecutive gain. Its 50 DMA line ($40.20) definies important near-term support to watch on pullbacks. A new pivot point was recently cited based on its 12/01/22 high plus 10 cents.
>>> FEATURED STOCK ARTICLE : 7th Consecutive Gain for Titan - 1/30/2023 |
View all notes |
Set NEW NOTE alert |
Company Profile |
SEC
News |
Chart |
Request a new note
C
A
S
I |
MYE
-
NYSE
Myers Industries Inc
Containers/Packaging
|
$24.21
|
+0.16
0.67% |
$24.21
|
154,120
92.29% of 50 DAV
50 DAV is 167,000
|
$25.55
-5.24%
|
12/8/2022
|
$23.94
|
PP = $25.65
|
|
MB = $26.93
|
Most Recent Note - 1/31/2023 6:11:00 PM
Y - Posted a solid gain today with average volume. Found support while testing support at its 50 DMA line ($23.14) in recent weeks. Faces little resistance due to overhead supply up to the $25.50 level.
>>> FEATURED STOCK ARTICLE : Myers Quietly Consolidating Within Striking Distance of Prior High - 1/20/2023 |
View all notes |
Set NEW NOTE alert |
Company Profile |
SEC
News |
Chart |
Request a new note
C
A
S
I |
Symbol/Exchange
Company Name
Industry Group |
PRICE |
CHANGE
(%Change) |
Day High |
Volume
(% DAV)
(% 50 day avg vol) |
52 Wk Hi
% From Hi |
Featured
Date |
Price
Featured |
Pivot Featured |
|
Max Buy |
BOX
-
NYSE
Box Inc Cl A
Computer Sftwr-Database
|
$34.68
|
+1.68
5.09% |
$34.74
|
2,734,553
200.77% of 50 DAV
50 DAV is 1,362,000
|
$33.09
4.81%
|
2/2/2023
|
$34.68
|
PP = $33.14
|
|
MB = $34.80
|
Most Recent Note - 2/2/2023 6:28:47 PM
Y - Posted a 3rd consecutive gain today backed by +41% above average volume hitting a new high. Color code is changed to yellow as it also broke out today above a new pivot point cited based on its 4/20/22 high plus 10 cents. Prior highs in the $31 area define initial support to watch on pulllbacks.
>>> FEATURED STOCK ARTICLE : Perched Above "Max Buy" Level Near Recent Highs - 1/24/2023 |
View all notes |
Set NEW NOTE alert |
Company Profile |
SEC
News |
Chart |
Request a new note
C
A
S
I |
STRL
-
NASDAQ
Sterling Infrastructure
MATERIALS and; CONSTRUCTION - Heavy Construction
|
$36.32
|
-0.32
-0.87% |
$36.98
|
328,243
142.71% of 50 DAV
50 DAV is 230,000
|
$36.98
-1.78%
|
12/14/2022
|
$32.41
|
PP = $33.72
|
|
MB = $35.41
|
Most Recent Note - 1/31/2023 1:33:50 PM
Y - Hitting a new high with today's big gain backed by light volume. Gain on 1/27/23 with +64% above average volume cleared the previously cited pivot point. The 50 DMA line ($32.43) and recent low ($30.60 on 1/19/23) define near-term support levels to watch on pullbacks.
>>> FEATURED STOCK ARTICLE : Gain With Average Volume While Perched Near Recent Highs - 1/26/2023 |
View all notes |
Set NEW NOTE alert |
Company Profile |
SEC
News |
Chart |
Request a new note
C
A
S
I |
PERI
-
NASDAQ
Perion Networks Ltd
Comml Svcs-Advertising
|
$34.00
|
+0.53
1.58% |
$35.16
|
1,217,356
259.01% of 50 DAV
50 DAV is 470,000
|
$33.97
0.09%
|
1/25/2023
|
$31.79
|
PP = $33.19
|
|
MB = $34.85
|
Most Recent Note - 2/2/2023 2:30:16 PM
Y - Gain today marked by above average volume is adding to a recent spurt, hitting new multi-year highs and challenging its "max buy" level. On pullbacks the prior high ($33) defines initial suppport to watch abvoe its 50 DMA line ($27.89).
>>> FEATURED STOCK ARTICLE : Spurt of Volume-Driven Gains Challenging Prior High - 1/25/2023 |
View all notes |
Set NEW NOTE alert |
Company Profile |
SEC
News |
Chart |
Request a new note
C
A
S
I |
ALGM
-
NASDAQ
Allegro Microsystems Inc
Elec-Semiconductor Mfg
|
$41.10
|
+1.42
3.58% |
$41.59
|
5,668,975
389.09% of 50 DAV
50 DAV is 1,457,000
|
$39.97
2.83%
|
1/31/2023
|
$37.80
|
PP = $38.38
|
|
MB = $40.30
|
Most Recent Note - 2/2/2023 1:55:12 PM
G - Hitting yet another new high with today's 3rd consecutive volume-driven gain and its color code is changed to green after rising above its "max buy" level. New CEO in Jun '22. Quarterly comparisons through Dec '22 have been above the +25% minimum earnings guideline (C criteria). Annual earnings history has been strong since its $14 IPO in Oct '20.
>>> FEATURED STOCK ARTICLE : Big Volume-Driven Gain for Best-Ever Close - 1/31/2023 |
View all notes |
Set NEW NOTE alert |
Company Profile |
SEC
News |
Chart |
Request a new note
C
A
S
I |
|
|
|
THESE ARE NOT BUY RECOMMENDATIONS!
Comments contained in the body of this report are technical
opinions only. The material herein has been obtained
from sources believed to be reliable and accurate, however,
its accuracy and completeness cannot be guaranteed.
This site is not an investment advisor, hence it does
not endorse or recommend any securities or other investments.
Any recommendation contained in this report may not
be suitable for all investors and it is not to be deemed
an offer or solicitation on our part with respect to
the purchase or sale of any securities. All trademarks,
service marks and trade names appearing in this report
are the property of their respective owners, and are
likewise used for identification purposes only.
This report is a service available
only to active Paid Premium Members.
You may opt-out of receiving report notifications
at any time. Questions or comments may be submitted
by writing to Premium Membership Services 665 S.E. 10 Street, Suite 201 Deerfield Beach, FL 33441-5634 or by calling 1-800-965-8307
or 954-785-1121.
|
|
|