You are not logged in.
This means you
CAN ONLY VIEW reports that were published prior to Friday, April 18, 2025.
You
MUST UPGRADE YOUR MEMBERSHIP if you want to see any current reports.
AFTER MARKET UPDATE - MONDAY, FEBRUARY 6TH, 2023
Previous After Market Report Next After Market Report >>>
|
|
|
|
DOW |
-34.99 |
33,891.02 |
-0.10% |
|
Volume |
853,394,396 |
-13% |
|
Volume |
5,496,721,300 |
-8% |
|
NASDAQ |
-119.50 |
11,887.45 |
-1.00% |
|
Advancers |
740 |
25% |
|
Advancers |
1,547 |
34% |
|
S&P 500 |
-25.40 |
4,111.08 |
-0.61% |
|
Decliners |
2,276 |
75% |
|
Decliners |
2,977 |
66% |
|
Russell 2000 |
-27.82 |
1,957.72 |
-1.40% |
|
52 Wk Highs |
61 |
|
|
52 Wk Highs |
92 |
|
|
S&P 600 |
-21.17 |
1,289.63 |
-1.62% |
|
52 Wk Lows |
12 |
|
|
52 Wk Lows |
34 |
|
|
 |
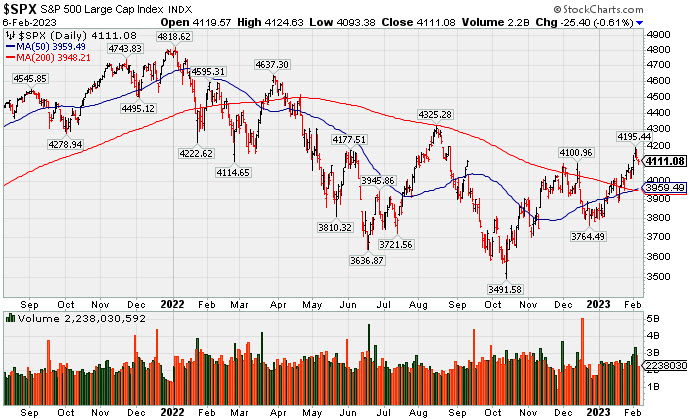
Major Averages Pulled back With Lighter Volume
Kenneth J. Gruneisen - Passed the CAN SLIM® Master's Exam
The Dow lost 34 points, while the Nasdaq Composite shed 1% amid a rout in technology shares. The S&P 500 fell 0.6% with nine of 11 sectors finishing in negative territory. Volume totals were lighter than the prior session on the NYSE and on the Nasdaq exchange. Breadth was negative as decliners led advancers by a 3-1 margin on the NYSE and by nearly 2-1 margin the Nasdaq exchange. There were 28 high-ranked companies from the Leaders List that hit new 52-week highs and were listed on the BreakOuts Page versus the total of 80 on the prior session. New 52-week highs totals solidly outnumbered new 52-week lows totals on both the NYSE and the Nasdaq exchange. The major indices are in a confirmed uptrend (M criteria). Disciplined investors have a green light for making new buys only in stocks matching all key criteria of the fact-based investment system.
PICTURED: The S&P 500 Index pulled back with lighter volume for a 2nd consecutive loss.
U.S. equities finished lower Monday amid climbing Treasury yields and as investors assessed the Federal Reserve’s (Fed) monetary policy path. The central bank has indicated they need to see marked softening in the labor market to be sure their policy is working, and Friday’s hotter-than-expected jobs report has raised worries they may have to continue hiking rates for longer. All eyes will be on Fed Chair Jerome Powell’s speaking engagement tomorrow as investors look for clues as to the future of interest rate hikes.
Treasuries weakened, with the yield on the benchmark 10-year note up 11 basis points (0.11%) to 3.64%, while the 30-year bond yield climbed four basis points (0.04%) to 3.67%. The yield on the two-year note, which is more sensitive to changes in monetary policy, advanced 18 basis points (0.18%) to 4.48%. In the past two sessions, the policy-sensitive two-year note yield has gained 39 basis points (0.39%) as investors speculate whether the Fed may need to raise rates higher than forecasted. In commodities, West Texas Intermediate (WTI) crude climbed 1.3% to $74.36/barrel amid renewed concerns over supply. However, concerns over global growth and the oil demand outlook has kept a cap on gains. The U.S. Dollar Index added 0.7% against a basket of major currencies as markets continued to digest Friday’s jobs data.
|
 Kenneth J. Gruneisen started out as a licensed stockbroker in August 1987, a couple of months prior to the historic stock market crash that took the Dow Jones Industrial Average down -22.6% in a single day. He has published daily fact-based fundamental and technical analysis on high-ranked stocks online for two decades. Through FACTBASEDINVESTING.COM, Kenneth provides educational articles, news, market commentary, and other information regarding proven investment systems that work in good times and bad.
Comments contained in the body of this report are technical opinions only and are not necessarily those of Gruneisen Growth Corp. The material herein has been obtained from sources believed to be reliable and accurate, however, its accuracy and completeness cannot be guaranteed. Our firm, employees, and customers may effect transactions, including transactions contrary to any recommendation herein, or have positions in the securities mentioned herein or options with respect thereto. Any recommendation contained in this report may not be suitable for all investors and it is not to be deemed an offer or solicitation on our part with respect to the purchase or sale of any securities. |
|
 |
Financial, Tech, Retail and Commodity-Linked Groups Fell
Kenneth J. Gruneisen - Passed the CAN SLIM® Master's Exam
The Bank Index ($BKX -0.75%), Broker/Dealer Index ($XBD -0.38%), and Retail Index ($RLX -0.75%) ended unanimously lower. The Gold & Silver Index ($XAU -1.10%) and Integrated Oil Index ($XOI -0.76%) both lost ground while the Oil Services Index ($OSX -0.02%) finished flat. The Semiconductor Index ($SOX -1.70%) and Networking Index ($NWX -1.37%) both ost ground while the Biotech Index ($BTK -0.65%) also edged lower.
PICTURED: The Biotech Index ($BTK -0.65%) pulled back for a 2nd consecutive loss.
| Oil Services |
$OSX |
89.30 |
-0.02 |
-0.02% |
+6.49% |
| Integrated Oil |
$XOI |
1,747.00 |
-13.35 |
-0.76% |
-2.25% |
| Semiconductor |
$SOX |
3,029.74 |
-52.36 |
-1.70% |
+19.65% |
| Networking |
$NWX |
823.14 |
-11.47 |
-1.37% |
+5.08% |
| Broker/Dealer |
$XBD |
494.27 |
-1.88 |
-0.38% |
+10.05% |
| Retail |
$RLX |
3,086.63 |
-23.18 |
-0.75% |
+12.08% |
| Gold & Silver |
$XAU |
126.20 |
-1.40 |
-1.10% |
+4.42% |
| Bank |
$BKX |
113.66 |
-0.86 |
-0.75% |
+12.70% |
| Biotech |
$BTK |
5,562.81 |
-36.55 |
-0.65% |
+5.33% |
|
|
|
 |
Metals Firm Extended From Base and Perched Near High
Kenneth J. Gruneisen - Passed the CAN SLIM® Master's Exam
Commercial Metals Co (CMC -$0.63 or -1.11% to $55.94) pulled back today following 4 consecutive gains. It is extended from any sound base. Its 50-day moving average (DMA) line ($50.91) defines important near-term support to watch on pullbacks.
Fundamentals remain strong. CMC has a highest possible 99 Earnings Per Share Rating. It reported Nov '22 quarterly earnings +38% on +12% sales revenues versus the year ago period and prior quarterly comparisons were well above the +25% minimum earnings guideline (C criteria) of the fact-based investment system. Annual earnings growth has been strong. It hails from the Metal Proc & Fabrication group which is currently ranked 51st on the 197 Industry Groups list (L criteria).
The company has 117.1 million shares outstanding (S criteria). The number of top-rated funds owning its shares rose from 586 in Dec '21 to 655 in Dec '22. Its current Up/Down Volume Ratio of 1.4 is an unbiased indication its shares have been under accumulation over the past 50 days. It has a Timeliness Rating of A and a Sponsorship Rating of A.
|
|
|
Color Codes Explained :
Y - Better candidates highlighted by our
staff of experts.
G - Previously featured
in past reports as yellow but may no longer be buyable under the
guidelines.
***Last / Change / Volume data in this table is the closing quote data***
Symbol/Exchange
Company Name
Industry Group |
PRICE |
CHANGE
(%Change) |
Day High |
Volume
(% DAV)
(% 50 day avg vol) |
52 Wk Hi
% From Hi |
Featured
Date |
Price
Featured |
Pivot Featured |
|
Max Buy |
 CMC
-
NYSE
CMC
-
NYSE
Commercial Metals Co
METALS and MINING - Steel and Iron
|
$55.94
|
-0.63
-1.11% |
$56.32
|
971,898
92.47% of 50 DAV
50 DAV is 1,051,000
|
$58.09
-3.70%
|
10/14/2022
|
$41.61
|
PP = $44.45
|
|
MB = $46.67
|
 Most Recent Note - 2/6/2023 6:01:30 PM
G - Pulled back today following a streak of 4 consecutive gains to a new high. It is extended from any sound base. Its 50 DMA line ($50.91) defines important near-term support to watch on pullbacks. Fundamentals remain strong. See the latest FSU analysis for more details and a new annotated graph.
>>> FEATURED STOCK ARTICLE : Metals Firm Extended From Base and Perched Near High - 2/6/2023 |
View all notes |
Set NEW NOTE alert |
Company Profile |
SEC
News |
Chart |
Request a new note
C
A
S
I |
GPK
-
NYSE
Graphic Packaging Hldg
CONSUMER NON-DURABLES - Packaging and Containers
|
$23.66
|
+0.00
0.00% |
$23.76
|
3,452,477
115.74% of 50 DAV
50 DAV is 2,982,900
|
$24.20
-2.23%
|
10/25/2022
|
$22.75
|
PP = $24.17
|
|
MB = $25.38
|
Most Recent Note - 2/3/2023 7:39:26 PM
Y - Hovered near its 52-week high after challenging its pivot point this week. Disciplined investors know that gains above a stock's pivot point must be backed by at least +40% above average volume to trigger a proper technical buy signal.
>>> FEATURED STOCK ARTICLE : Graphic Packaging Perched Near Pivot Point - 1/27/2023 |
View all notes |
Set NEW NOTE alert |
Company Profile |
SEC
News |
Chart |
Request a new note
C
A
S
I |
GFF
-
NYSE
Griffon Corporation
MATERIALS and CONSTRUCTION - General Building Materials
|
$40.88
|
-2.13
-4.95% |
$42.86
|
556,230
111.25% of 50 DAV
50 DAV is 500,000
|
$43.74
-6.54%
|
11/10/2022
|
$34.13
|
PP = $35.02
|
|
MB = $36.77
|
Most Recent Note - 2/6/2023 6:03:29 PM
G - Pulled back from its 52-week high with today's loss on average volume following 4 consecutive gains backed by above average volume, It is extended from any sound base. Its 50 DMA line ($37.16) defines near-term support to watch on pullbacks. Reported Dec '22 quarterly earnings +121 on +10% sales revenues versus the year ago period.
>>> FEATURED STOCK ARTICLE : Extended From Any Sound Base and Still Hitting New Highs - 2/2/2023 |
View all notes |
Set NEW NOTE alert |
Company Profile |
SEC
News |
Chart |
Request a new note
C
A
S
I |
TITN
-
NASDAQ
Titan Machinery Inc
SPECIALTY RETAIL
|
$44.37
|
-1.43
-3.12% |
$46.40
|
236,368
91.26% of 50 DAV
50 DAV is 259,000
|
$46.00
-3.54%
|
1/13/2023
|
$40.10
|
PP = $44.45
|
|
MB = $46.67
|
Most Recent Note - 2/6/2023 6:06:07 PM
Y - Pulled back today following a streak of 11 consecutive gains. Its 50 DMA line ($40.62) definies important near-term support to watch on pullbacks. It wedged into new high territory with gains lacking great volume conviction since a new pivot point was recently cited based on its 12/01/22 high plus 10 cents.
>>> FEATURED STOCK ARTICLE : 7th Consecutive Gain for Titan - 1/30/2023 |
View all notes |
Set NEW NOTE alert |
Company Profile |
SEC
News |
Chart |
Request a new note
C
A
S
I |
MYE
-
NYSE
Myers Industries Inc
Containers/Packaging
|
$24.52
|
+0.14
0.57% |
$24.54
|
104,049
63.83% of 50 DAV
50 DAV is 163,000
|
$25.55
-4.03%
|
12/8/2022
|
$23.94
|
PP = $25.65
|
|
MB = $26.93
|
Most Recent Note - 2/3/2023 7:37:12 PM
Y - Posted a 2nd consecutive gain with average volume. Found support while testing its 50 DMA line ($23.27) in recent weeks. Faces little resistance due to overhead supply up to the $25.50 level. See the latest FSU analysis for more details and a new annotated graph.
>>> FEATURED STOCK ARTICLE : Perched Near High After Finding Support at 50 DMA - 2/3/2023 |
View all notes |
Set NEW NOTE alert |
Company Profile |
SEC
News |
Chart |
Request a new note
C
A
S
I |
Symbol/Exchange
Company Name
Industry Group |
PRICE |
CHANGE
(%Change) |
Day High |
Volume
(% DAV)
(% 50 day avg vol) |
52 Wk Hi
% From Hi |
Featured
Date |
Price
Featured |
Pivot Featured |
|
Max Buy |
BOX
-
NYSE
Box Inc Cl A
Computer Sftwr-Database
|
$33.88
|
-0.50
-1.45% |
$34.40
|
632,755
44.84% of 50 DAV
50 DAV is 1,411,000
|
$34.90
-2.92%
|
2/2/2023
|
$34.68
|
PP = $33.14
|
|
MB = $34.80
|
Most Recent Note - 2/2/2023 6:28:47 PM
Y - Posted a 3rd consecutive gain today backed by +41% above average volume hitting a new high. Color code is changed to yellow as it also broke out today above a new pivot point cited based on its 4/20/22 high plus 10 cents. Prior highs in the $31 area define initial support to watch on pulllbacks.
>>> FEATURED STOCK ARTICLE : Perched Above "Max Buy" Level Near Recent Highs - 1/24/2023 |
View all notes |
Set NEW NOTE alert |
Company Profile |
SEC
News |
Chart |
Request a new note
C
A
S
I |
STRL
-
NASDAQ
Sterling Infrastructure
MATERIALS and; CONSTRUCTION - Heavy Construction
|
$36.85
|
-0.01
-0.03% |
$37.00
|
295,940
127.01% of 50 DAV
50 DAV is 233,000
|
$36.98
-0.35%
|
12/14/2022
|
$32.41
|
PP = $33.72
|
|
MB = $35.41
|
Most Recent Note - 2/3/2023 7:42:26 PM
G - Color code is changed to green after a gain above its "max buy" level backed by light volume. Prior highs in the $34-33 area define initial support to watch above its 50 DMA line ($32.73).
>>> FEATURED STOCK ARTICLE : Gain With Average Volume While Perched Near Recent Highs - 1/26/2023 |
View all notes |
Set NEW NOTE alert |
Company Profile |
SEC
News |
Chart |
Request a new note
C
A
S
I |
PERI
-
NASDAQ
Perion Networks Ltd
Comml Svcs-Advertising
|
$33.74
|
-0.19
-0.56% |
$33.98
|
818,128
165.28% of 50 DAV
50 DAV is 495,000
|
$35.16
-4.04%
|
1/25/2023
|
$31.79
|
PP = $33.19
|
|
MB = $34.85
|
Most Recent Note - 2/2/2023 2:30:16 PM
Y - Gain today marked by above average volume is adding to a recent spurt, hitting new multi-year highs and challenging its "max buy" level. On pullbacks the prior high ($33) defines initial suppport to watch abvoe its 50 DMA line ($27.89).
>>> FEATURED STOCK ARTICLE : Spurt of Volume-Driven Gains Challenging Prior High - 1/25/2023 |
View all notes |
Set NEW NOTE alert |
Company Profile |
SEC
News |
Chart |
Request a new note
C
A
S
I |
ALGM
-
NASDAQ
Allegro Microsystems Inc
Elec-Semiconductor Mfg
|
$41.22
|
-0.34
-0.82% |
$41.98
|
1,826,263
116.03% of 50 DAV
50 DAV is 1,574,000
|
$41.94
-1.72%
|
1/31/2023
|
$37.80
|
PP = $38.38
|
|
MB = $40.30
|
Most Recent Note - 2/2/2023 1:55:12 PM
G - Hitting yet another new high with today's 3rd consecutive volume-driven gain and its color code is changed to green after rising above its "max buy" level. New CEO in Jun '22. Quarterly comparisons through Dec '22 have been above the +25% minimum earnings guideline (C criteria). Annual earnings history has been strong since its $14 IPO in Oct '20.
>>> FEATURED STOCK ARTICLE : Big Volume-Driven Gain for Best-Ever Close - 1/31/2023 |
View all notes |
Set NEW NOTE alert |
Company Profile |
SEC
News |
Chart |
Request a new note
C
A
S
I |
|
|
|
THESE ARE NOT BUY RECOMMENDATIONS!
Comments contained in the body of this report are technical
opinions only. The material herein has been obtained
from sources believed to be reliable and accurate, however,
its accuracy and completeness cannot be guaranteed.
This site is not an investment advisor, hence it does
not endorse or recommend any securities or other investments.
Any recommendation contained in this report may not
be suitable for all investors and it is not to be deemed
an offer or solicitation on our part with respect to
the purchase or sale of any securities. All trademarks,
service marks and trade names appearing in this report
are the property of their respective owners, and are
likewise used for identification purposes only.
This report is a service available
only to active Paid Premium Members.
You may opt-out of receiving report notifications
at any time. Questions or comments may be submitted
by writing to Premium Membership Services 665 S.E. 10 Street, Suite 201 Deerfield Beach, FL 33441-5634 or by calling 1-800-965-8307
or 954-785-1121.
|
|
|